QUADERNI DEL DIPARTIMENTO DI SCIENZE
ECONOMICHE E SOCIALI
UNIVERSITÀ CATTOLICA DEL SACRO CUORE PIACENZA
DETERMINANTS OF INTRA-DISTRIBUTION DYNAMICS IN
EUROPEAN REGIONS: AN EMPIRICAL ASSESSMENT OF
THE ROLE OF STRUCTURAL INTERVENTION
Enrico Fabrizi, Gianni Guastella, Stefano Marta, Francesco Timpano
1
Determinants of intra-distribution dynamics in European regions: An
empirical assessment of the role of structural intervention
Enrico FABRIZI - Dep of Economics and Social Sciences, Università Cattolica, Piacenza (IT) Gianni GUASTELLA1 - Dep of Agricultural Economics, Università Cattolica, Piacenza (IT)
Stefano MARTA - UN FAO, Rome (IT)
Francesco TIMPANO – Dep of Economics and Social Sciences, Università Cattolica, Piacenza (IT)
Abstract
This paper looks at the dynamic of income distribution in European regions and attempts to relate movements within the distribution to the regional structural characteristics and the support of Cohesion Policy (CP). Empirical evidence highlights two main features of regional development. A generally lagging periphery with high growth rates on the one hand and a set of leading regions facing the challenge of global competitiveness on the other. There is evidence that CP support advanced economic development in lagging and peripheral regions, hence contributing to the “convergence objective”. Nonetheless, effective catch-up remains circumscribed to certain very few regions. Contrarily, CP support has failed to stimulate growth potential in leading regions, failing to strengthen EU competitiveness. Evidence presented in this paper provide useful insights for the current debate about the reshaping of EU cohesion policy toward a more place-based approach.
Keywords: Regional development, European Union, distribution dynamics, multinomial logistic regression, cohesion policy, place-based territorial policies.
JEL: Q47, R11.
Introduction
After decades in which -convergence studies have been predominant in the debate on regional convergence, a series of contribution by Quah (1993a; 1996a; 1996b; 1996c) introduced transition matrices in the analysis of convergence, reassessing interest on the topic of -convergence. In -regression, evidence of a higher growth in less development economies is consistent with increasing income disparities (Quah, 1993b) and hence the significance of this empirical framework is questioned when testing the convergence hypothesis. Contrarily, transition matrices can be used to
1 Corresponding author: Gianni Guastella, Università Cattolica del Sacro Cuore. 84, via Emilia
2
inspect the evolution of income distribution over time with a closer focus on disparities and, accordingly, it is deemed more appropriate to assess convergence.
In contrast to -regression, however, income distribution only is studied with transition matrices; long-run income determinants are not. Examining income transition and convergence in European Union’s (EU) regions this paper aims at filling this gap by relating transition probabilities to the determinants of regional development. Multinomial logistic regressions are applied to this purpose, as the use of multinomial outcome models allows explaining the impact of some exogenous characteristics on the change in transition probabilities.
The focus of the present paper is on EU regions and, more specifically, on the impact of Cohesion Policy (CP), controlling for structural characteristics. For this reason the literature this paper can be framed in refers to both regional convergence studies and policy evaluation studies; and with respect to both the paper offers a new and innovative perspective. In summary, a large body of literature has already investigated the impact of cohesion policy using -regression framework. Many have used dummy variables to identify regions that are objective of EU policies; hence either Objective 1 dummy is included (Becker et al., 2010; Falk and Sinabell, 2008; de Freitas et al., 2003) or Cohesion Country dummy (Ramajo et al., 2008) in the regression of growth rate on initial income. Others have directly included the amount of support received or committed (Bouvet, 2005; Dall’erba and Le Gallo, 2008; Dall’erba, 2005; Ederveen et al., 2003; Eggert et al., 2007; Esposti and Bussoletti, 2008; Garcia-Milà and McGuire, 2001; Mohl and Hagen, 2010; Percoco, 2005; Puigcerver-Penalver, 2007; RodrÍguez-Pose and Fratesi, 2004; Soukiazis and Antunes, 2006). By and large there is heterogeneous evidence that EU policy exhibits a positive effect on regional growth. Nonetheless, as -regression is suspected to be inadequate to examine convergence, studies based on this method may fail to reveal a direct relationship between CP and regional convergence. Contrarily, the present paper studies convergence using distribution dynamics and transition probabilities to consider convergence, and links cohesion policy to such dynamics in an attempt to more effectively assess the effect of the CP on convergence in Europe. It is claimed that this modelling framework better interprets real catch-up and income convergence. Finally, as a minor innovation, this paper presents results using data of the most recent programming period (2000-2006), contrary to the majority of existing studies which use instead data up to 1999 (with the notable exception of Mohl and Hagen (2010)).
This paper also brings empirical evidence and contributes to the recent debate on regional policy intervention emerged in the last few years following some key publications and influential policy reports (Barca, 2009; CAF, 2010; OECD, 2009a, 2009b; World Bank, 2009) which bring and
3
support different policy perspectives and approaches to development policies and stress the importance and complexity of regional development policy (Barca et al., 2012). In particular, the Barca Report “An Agenda for a Reformed Cohesion Policy” (Barca, 2009) focuses on the need to reshape the EU cohesion policy and funding mechanisms on the basis of a place-based approach to improve the effectiveness of structural funds. In addition, within-country disparities has emerged as a major issue at the academic and the policy level and both globalization and the global economic crises has contributed to increase regional disparities (Barca et al., 2012; Gurría, 2013). OECD Secretary-General Angel Gurría stresses the importance of regions to tackle territorial disparities: “One of the most damaging legacies of the global crisis has been widening (regional) inequality. Our reports show that where you live can have a major impact on your opportunities and standard of living. We need to zoom in on our nations’ regions and cities to tackle our most pressing challenges … Regional, city and local authorities are on the front line to build fairer and more sustainable economic growth.” (Gurría, 2013). Barca et al. (2012) suggest that the main aim of development policies was the provision of important infrastructures and, in fact, during the period 2000-2006, more than 40% of Objective 1 funds have been intended for infrastructures (EU, 2004). Nevertheless, such policy has been implemented without considering the effective impact on territorial development. If, on the one hand, infrastructures may have promoted growth in certain (likely capital) regions, they may have caused marginalization of some more peripheral territories on the other. Advocates of place-based policy intervention thus call for a more explicit target of territorial needs, in a way to promote regional development by unveiling the growth potential of each region.
Based on NUTS II level data, transition probabilities are estimated for the period 1999-2007 using deciles of the income distribution in 1999 as class limits. Probabilities are further related to region’s characteristics and structural intervention, as measured by the amount of funds received by the region. Estimation’s results confirm evidence in previous empirical literature, depicting regional development in Europe as characterized by high persistence and low intra-distribution mobility. In addition, it is suggested that developed regions growing at substantially low rates have contributed to convergence more than less developed regions growing at sustained rates. In this respect, CP has only partially achieved the target of boosting convergence. Analysing the determinant of transition dynamics it is clearly evidenced that financial support to infrastructures only has promoted the catch-up of lagging regions and, overall, convergence in Europe. Oppositely, other categories of support have been primarily allocated to regions that exhibited relatively modest economic performances. Finally, common explanations for regional growth such human capital and investments in research, exhibit no significant effects on the transition, while a positive and
4
significant effect is evidenced in the case of communication infrastructures. Results support the call for a renewed approach to regional intervention in Europe. Spatially blinded provision of infrastructure should be maintained alongside more place-based policies allocating money in a more efficient way.
The remainder of the paper is organized as follows. The next section includes a review of the literature on regional convergence and EU policy evaluation, emphasizing the peculiar viewpoint of this study. Section three shows the transition matrix estimated for our sample and describes the distribution of EU funds across regions. Section four describes the dataset and illustrates the multinomial logistic regression approach. The results are summarized and discussed in section five. A concise conclusions section follows.
Convergence models and CP evaluation
The topic of convergence has been always central in growth literature and the interest of researchers has recently increased. This renewed interest can be related to research trajectories explored by New Growth Theory (NGT) (Aghion and Howitt, 1992; Lucas, 1988; Romer, 1986) and New Economic Geography (NEG) scholars (Krugman and Venables, 1995; Krugman, 1991; Ottaviano and Puga, 1998). Central in both NGT and NEG is the contribution of externalities, explained by the knowledge spillovers in the first case and by the geographical agglomeration in the latter. The extent to which externalities originated in one region can spread to the other regions determines convergence or divergence between groups of economies such as Europe. If growth is driven by physical capital accumulation, as neoclassical models predict (Solow, 1956), decreasing marginal returns to factors cause convergence. Contrarily, if growth is driven by externalities and these are extremely localized, a process of cumulative causation is likely to begin in certain regions, leading the formation of club-convergence and core-periphery patterns.
Barro-type regressions (Barro et al., 1991; Barro, 1991) have been for many years the standard workhorse of empirical growth economists looking for evidence of convergence at a national and regional level. The main equation to be estimated is directly derived from neo-classical growth models (Solow, 1956) which predicts that convergence in income levels operates through higher growth rates in poorer economies. A decrease in the level of disparities between economies is considered the natural outcome in the case of converging trajectories. Convergence is predicted in either its absolute or conditional form, the latter allowing for different long run equilibriums determined by different structural characteristics (as proxy by covariates in the cross-regional regression of annual average growth on initial income). Along with this type of cross-section
5
studies, other approaches have been developed which make use of time series and panel data analysis as well as of distribution dynamics. However, while the focus of cross-section, time-series and panel-data analysis is to find evidence of (absolute and/or conditional) convergence, -convergence has been instead investigated with distribution dynamics approaches, with a closer focus on the evolution of income dispersion and, more specifically, on that of the entire income distribution (Islam, 2003).
The analysis of income distribution’s dynamics has been introduced by Quah (1993a; 1996) debating the use of -regression approach to test convergence. More specifically, the approach is criticized because evidence of -convergence are consistent with increases in the level of overall disparities over time (Quah, 1993b). Transition matrices, on the opposite, focus on the income distribution and its evolution over time and hence show to be apt to analyse convergence. Probabilities estimated from the transition matrix represent the dynamic of income distribution and can be used to predict the shape of the distribution in the long-run.
After Quah, many other studies have used these methods to investigate regional convergence. (Bianchi, 1997) and (Desdoigts, 1999) analyzed convergence at a country level, while Fingleton (1997; 1999) and Le Gallo (2004) present contributions at a European regional level. Transition matrices provide a more complete picture of the development process, explaining which regions did move, from where and to where did they go in standardized distribution. Indeed there are restrictive assumptions behind the computation of the long-run distribution, not always satisfied by data used for empirical analysis (Bickenbach and Bode, 2001). In addition, income is discretized (i.e. divided in classes) to construct transition classes and result are sensitive to the choice of class limits. Although arbitrariness is reduced in the case that quantiles are used to define class limits, this remains an issue and different attempts have been made to introduce more sophistication in the empirical analysis (Bulli, 2001, 2001; Magrini, 1999, 2004). More important, the study of equilibrium analysis has proven very appropriate in the analysis of long-run income convergence, but its relevance is limited in the analysis of transition’s determinants inasmuch the shape of the equilibrium distribution cannot be associated to the socio-economic determinants at the territorial level and policies.
As CP represents the most relevant voice of EU budgeting in the 2000-2006 programming period2 after agricultural policy, policy evaluation is becoming more and more important and an academic literature is growing beside evaluation projects undertaken by the EU commission. Perspectives,
6
however, differ. The institutional perspective posed by the EU looks at counterfactual; hence it is asked “what if policies did not exist”3. Answers to this question are provided with a focus on case studies or, more in general, by mean of simulation models, like the Hermin or Quest models or counterfactual analysis. Focus of academic studies is, by the opposite, the effectiveness of policy intervention, summarized in the question “did intervention achieve the target of convergence and
cohesion?”.
These questions are key also in light of the policy debate about place-based vs spatially-blind approaches to policy interventions. According to the Barca Report (Barca, 2009), the OECD (2009a; 2009b; 2009c; 2011) and other influential policy-makers and academics (Barca et al., 2012), the place-based paradigm represents the innovative and appropriate approach to face the issue of regional disparities and to address and reach the goals of the EU Cohesion policy and of the EU Treaty. This approach is based on the recognition that traditional top-down, sectoral and “one-size-fits-all” policies are no longer sufficient to face the new challenges of development and it stresses the importance of geographical context and its specific and unique economic, social, cultural and institutional features for development as well as the need to shift from a one-size-fits-all approach to a context-specific (place-based) approach (Barca et al., 2012; Pike et al., 2011). In addition, with regards to the role of policy, it argues that according to the economic theory, an external policy intervention may be required and justified to overcome some sets of both market and government failures. On the contrary, the World Bank Report advocates for spatially-blind policies, “policies that are designed without explicit consideration to space” (World Bank 2009, p24) and it is based on the assumption that development is not evenly spread and economic growth is unbalanced and “to try to spread it out – too much, too far, or too soon – is to discourage it” (Deichmann et al., 2011, p. 30). The spatially-blind approach proposes the 3D model to development - density, distance and division - and three different types of interventions depending on the level of development and constraints to development of a country: i) spatially-blind institutions, ii) spatially connective infrastructure and iii) spatially target incentives. It also argues that the debate on development policies has been placing too much emphasis on spatially-target interventions in recent years and one of the aims of the Report is to rebalance it (World Bank, 2009).
The extent of heterogeneity in empirical approaches used to evaluate policy intervention requires, however, further clarifications. Evaluation of CP by mean of ex-ante approaches translates into a
3 http://ec.europa.eu/regional_policy/sources/docgener/evaluation/evalsed/sourcebooks/method_techniques/
7
focus on the potential impact of policies, as the final effect on the economy substantially depends on how funds are actually managed. Contrarily, ex-post evaluation concentrates on actual impacts of policy on growth and convergence and it proves accordingly more suitable to figure out effectiveness. Based on Ederveen et al. (2003), there is evidence that potential impact, as estimated ex-ante with macro-economic models, largely differs with respect to actual impact, as determined ex-post by econometric approaches. Furthermore, within the econometric approach, it is relevant to distinguish direct testing (explaining variation in regional economic performance with the amount granted under certain policies) from indirect testing (linking regional performance to the right to receive support under certain policies).
Evidences obtained in empirical studies are rather mixed. The positive effect of policy intervention largely characterizes ex-ante evaluations (Bradley et al., 2007; EU, 2007, 2010; Veld, 2007). Ex-post evaluation studies show more ambiguous. A large body of econometric literature uses direct testing of the policy impact within the -regression framework. Certain studies have found evidence of a positive effect of funds on growth at both the national and regional level (Beugelsdijk and Eijffinger, 2005; Bouvet, 2005; Cappelen et al., 2003; Dall’erba, 2005; Esposti and Bussoletti, 2008; Soukiazis and Antunes, 2006). Others have found no significant effect (Dall’erba and Le Gallo, 2008; Eggert et al., 2007; Garcia-Milà and McGuire, 2001; Hagen and Mohl, 2008). Many have found mixed results (Ederveen et al., 2003, 2006; Mohl and Hagen, 2010; Puigcerver-Penalver, 2007; RodrÍguez-Pose and Fratesi, 2004). Policy impact is tested indirectly also and evidence suggest a positive effect of treatment on regional growth (Becker et al., 2010; Falk and Sinabell, 2008; Ramajo et al., 2008). Finally, very few studies concentrate on measuring indirectly the effect of CP on the disparities by measuring the decline in income dispersion in the groups of recipient and non-recipient regions (Basile et al., 2001; Boldrin and Canova, 2001) and no relevant conclusion emerges. To the authors’ knowledge no attempt was made in the past to measure the incidence of Cohesion Policy on the decline of disparities directly.
Transition dynamics and CP (2000-2006)
Regional performance is investigated by looking at per capita GDP in PPS units at 2000 prices in a set of 243 NUTS II regions belonging to 24 EU member states4. As usual the variable is
standardized over the sample average. Transition is considered during years 1999-2007. In this way the study period is covered to a large extent by the programming period 2000-2006 and this facilitates the direct evaluation of CP’s effect in this period.
4 Islands like Canarias, Guadalupe and Martinique have been excluded from the analysis. Denmark has been excluded
8
Since only the beginning and the final period are studied, the two variables, y and 99 y 07
respectively, are presented in figure 1 as frequency distributions. Class limits are chosen based on deciles of standardized distribution in 1999 and are fixed for both periods. The number of classes is deemed appropriate as it is sufficiently large to reproduce in detail the transition but not that large to produce an excessive amount of zeroes in the transition matrix.
<Figure 1 about here>
Apparently, in the considered period, regions have not moved towards an equilibrium level in the neighbourhood of the EU average but, contrarily, have shifted partially more to the left tail of the distribution. Many regions were able to move from the first class and, as a result, there is evidence of concentration in the second class. Nevertheless, the first class is characterized by high persistence as the majority of regions did not left the class in the considered period. Regarding convergence, there is evidence that regional disparities shrank over the period, as the coefficient of variation narrowed from the value of 36.63 in 1999 to that of 35.58in 2007.
<Table 1 about here>
Estimated transition probabilities for the whole period are reported in table 1. Classes in the tails of the distribution appear to be those with the highest rates of persistence; hence shares of regions not moving from the origin class during the transition period. Considering the left tail, there is a persistence of 64% and 83% respectively in the first and second class. Considering the right tail, persistence is 62.5% and 68% respectively in the ninth and tenth class. In all other cases the ratio of regions not moving diminishes substantially, ranging between 26% and 46%.
In the beginning year of this study, there were 74 regions in the first three classes, with an income per capita lower or at least equal to the 83.5% of the sample average, and 71 regions in the last three classes, with an income per capita equal of higher than 122% of the sample average. In the first case, approximately 30% of regions moved on from the origin class, realizing catch-up; in the latter case 35% moved back. Consequently, convergence toward the average can be interpreted as the result of the economic decline of some leading regions more than of the catch-up of developing regions. There is evidence that as much as 75% of regions with an income lower than 74% of the sample average at the beginning year were in the same ranking in the end year. Finally weak evidence of catch-up are provided by regions which have considerably improved their performance over the period. 12 regions out of the 46 moving forward actually moved of more than one class. Oppositely, 9 over 74 regions moving backward only moved of more than one class.
9
Concerning CP, the impact of structural intervention for the period 2000-2006 is discussed here in relation to the probability of transition. Data on structural fund at the regional aggregate level expenditure have been collected by SWECO (2008) and are available at the EU regional policy website5. Unfortunately SWECO has been appointed to produce an evaluation of CP relative to only grants distributed through the European Regional Development Fund (ERDF) and the European Cohesion Fund (ECF). Accordingly the regional aggregate used in this paper does not include data for the European Social Fund (ESF).
The total amount received at regional level for structural intervention has been classified according to three main categories, namely Productive Environment (PE), Human Resources (HR) and Basic Infrastructures (BI). A more detailed description of the classification of regional expenditures in categories and subcategories is provided in the appendix. The database covers funds allocated under Objectives 1 and 2 of the European Regional Development Fund, the Cohesion Fund and Urban and Interreg IIIA projects of ERDF. Overall, the amount examined in the report equals 157 015 234 820 Euros, accounting for 98% of the total budget designated for the 2000-2006 period. A share corresponding to the 30% of this total amount has been committed to projects under the PE category. Funds have been committed to finance infrastructures to the greatest extent, as the relative figure rises up to 66% in the case of BI category. The remaining 2% only is committed to the HR category. The reason why the HR category is represented inadequately in this database is associated to the exclusion from the SWECO report of the ESF expenditures.
Preliminary descriptive statistics are summarized in tables 2 and 3 to analyse in which manner grants are distributed across income classes used to break the income distribution. More specifically the distribution of grants across classes is summarized for each category of grant in the table 2, reporting the total amount in million of Euro (Mil), the share of grants received by regions in each class over the total for each category (pct) and the cumulative share (cum sum). Conversely, the distribution of grant across categories, for each income class is summarized in the table 3.
<Table 2 about here>
Considering the entire amount (TOT), as much as 80% of money granted has been committed to regions with an income level lower or at least equal to the EU average; a half of this (approximately 38%) is committed to only regions ranking below the 75% of the EU average. Accordingly, CP has indeed accomplished the objective of targeting less developed regions, at least when development is measured with per capita income. Directing attention on BI only, 83% of money has been
10
committed to regions ranking below the EU average and more than a half of this to regions ranking below 75% than the EU average. The evidence is unsurprising as less developed regions generally lack basic infrastructures and consequently more funds are indeed needed to finance related projects. The share of funds committed to less developed regions decline in the case of both PE and HR categories. Specifically in the case of the PE category, there is evidence that a relatively larger share of money is committed to developed regions.
<Table 3 about here>
Considering each income class separately, there is general evidence that funds committed under the category of HR are generally represented inadequately. Funds committed under BI category are more relevant in less developed regions, Oppositely, funds committed under PE category are less relevant in these regions. In regions ranking below the 75% of the EU average income as much as 80% of total funds are directed to BI while only 20% are to PE. In other regions the difference is not as clear but, in general, PE commitments are weighted more.
Modelling transition probabilities
A link between transition probabilities and regional characteristics is set up by using Multinomial Logistic Regression (MLR). Such an approach to modelling transition probabilities estimated from a transition matrix is already in use in labour market studies (Alba-Ramirez, 1993; Egger et al., 2007; MacRae, 1977; Poterba and Summers, 1995). It is considered of wide utility as it allows estimation of a variable’ effect on the change in probability of realization of one possible outcome with respect to the probability of realization of a base outcome (Cameron and Trivedi, 2005). In terms of probability, the most likely outcome is that a region does not move from the origin class and that is considered the base outcome, accordingly. Concerning the other possible outcomes, forward moving regions are separated from backward moving regions and, within each of the two groups, regions moving of one class only from regions moving of more than one are distinguished. Overall, the following five possible outcomes are considered:
2 if the region moves forward of more than one class 1 if the region moves forward of one class 0 if the region does not move 1 if the region mo
i
y
ves backward of one class 2 if the region moves backward of more than one class .
11
The choice of such a restricted set of possible outcomes may appear as an excessive simplification. Nonetheless, it is motivated by the fact that transitions of more than two classes are infrequent in the sample in both the cases of forward (4 regions) and backward (1 region) directions. In addition, the number of observations in the sample is such that a larger number of outcomes will have dramatically reduced degrees of freedom, as a separate set of coefficients has to be estimated for each additional outcome. For the same reason the estimation of an origin-constrained model, where allowed outcomes vary according to the origin class, was excluded. Finally, five possible outcomes are deemed as sufficient to distinguish wide movements, which may affectively contribute to convergence, from short movements, which may result instead from a spurious statistical effect associated to the definition of class breaks. By and large, a possible drawback of more complex modeling of multinomial outcome models is that interpretation of results is upset, with substantial consequences for the policy analysis.
The MLR model is described in the following equation.
(1)
' , ' Pr | ; 2, 1,0,1, 2 i q i q z i i i q z q e y q z p q e
, , ,
Z X PE HR BI is a matrix with a set of exogenous variables
X and policy variablesdescribed before. Policy variables are measured as the total amount of funds committed to the region in the different categories. As 0 is the baseline outcome of this model 0 was set to 0. Exogenous variables proxy regional characteristics which are expected, on one hand, to influence regional economic performance in the short run and to control for any spurious relationship between transition and CP on the other. In fact, a spurious relationship between transition and CP may show up as regions are targeted for treatment based on the per-capita income at the regional level, in the case of “Objective1 fund”, and/or at the national level, in the case of the “Cohesion fund”.
In selecting explanatory variables likely to sort an effect on the regional development trajectory, many contributions from Neo-Classical Growth Theory (NCGT), New Growth Theory (NGT) and New Economic Geography (NEG) were taken into account. All data but the accessibility indicator (source: ESPON, year 2006) were collected at the regional section of the Eurostat database and refer to years 1999-2000. Accordingly, variables proxy for regional structural characteristics are observed at the beginning of the transition period. In what follows, a list of variables proxy for regional structural characteristics is presented motivating the rational for the choice.
12
Y is the log of the income level in 1999. Following the indication of neo-classical growth models
the variable is expected to exhibit a negative impact on transition and also controls for any spuriousness in the relationship between the probability of transition on the amount committed under CP.
INDis the share of workers in the manufacturing industry over the total of workers and employees. The effects of a change in the structure of the economy on regional development has been studied extensively and, among others, by Caselli and Wilbur (2001) who relate an increase in income level to a decrease in the number of people working in agriculture, as people working in industry are more skilled than those employed in agriculture and receive higher wages accordingly. There is general consensus on the fact that a shift of the economy toward more productive sectors will contribute to a growth of both the income and wealth. Although services more than manufacturing contribute to the value added of the region, the focus is maintained on the shift from agriculture to industry because this more likely describes the economic transition of developing regions in eastern Europe. In fact, low shares of manufacturing in a region may result from both an excessive weight of services and an excessive weight or agriculture, the two depicting very different scenarios of regional development. In the case of the sample used in this paper, however, there is evidence that the share of manufacturing is correlated to the share of services to the greatest extent. Both variable represent the shift of the regional economy from agriculture to non-agricultural sectors and, as a result, empirical estimates proven robust when tested including the share of services in place of the share of manufacturing.
ROAD is the indicator of accessibility, computed as the average distance from the origin region to
other region in Europe, weighted by the stock of road infrastructures (Spiekermann and Wegener, 2007). This key indicator is used as proxy for the market potential. Although in NEG models the market potential is related to both the economic size of other economies and the transport cost, this indicator accounts for transport costs more than for economic size. Nonetheless, the accessibility indicator based on market size, also available from ESPON, was deemed less relevant provided the high correlation between the indicator and regional GDP which may have eventually caused collinearity. Furthermore there is evidence that, at the EU regional level, infrastructures more than market size facilitate connections between regions (Guastella and Timpano, 2010). Indications about the sign of this variable are rather mixed. On the one hand it is expected that accessibility and infrastructures reduce transport costs, promoting spreading and, consequently, convergence. Evaluated at the single region level, an increase in accessibility should help transition by fostering
13
growth in less developed regions. On the other, transition is expected to occur more frequently in developing and most peripheral regions, where the level of accessibility is relatively lower.
LTU is the share of long term unemployment as a fraction of the unemployed labour force. Labour market disparities between regions are regarded as a possible determinant of labour mobility. Although mobility of workers is determined in NEG models primarily by wage differentials (Ottaviano and Puga, 1998) and labour market clears in absence of unemployment, inter-regional workers’ flows are also explained by the probability to find a job in the destination region (Crozet, 2004). For that reason LTU is included in the regression as a proxy for the intrinsic labour market conditions and is expected to positively contribute to regional transition. The choice of LTU was preferred to the unemployment rate, since the latter is suspected of endogeneity caused by the spurious correlation between regional development and unemployment due to short-run fluctuations.
EDUC is the percentage of people aged 24 years or more holding tertiary education. The use of educational attainment as proxy for human capital in growth empirics dates back to (Mankiw et al., 1992), where human capital is considered as an additional factor in the production function. In addition human capital is predicted to generate positive production externalities that are fundamentals in New Growth Theory (Lucas, 1988). As existing literature suggests that a positive relationships between human capital and regional development exists, the variable is expected to positively contribute to regional transition.
RED is the total intramural expenditure in Research and Development, measured in percentage of GDP. Efforts made by firms and spillovers involved in these activities are indicated by Aghion and Howitt (1992) as a source of increasing returns and related to the monopolistic power gained through the innovative activity. Although acknowledging that technological improvements might be better captured by either regional aggregates like patent applications or literature based measures of innovative activity (Acs et al., 2002) investments in research stress the role of voluntary efforts made by firms in order to increase their productivity through technological innovations. In this case also the effect is expected to be positive.
INTACC is the percentage of households having access to the internet. There is no precise
economic theory suggesting a link between technological infrastructure’ endowment and growth. That lack is, however, compensated by empirical evidences suggesting that network integration more than physical, usually achieved through infrastructures, matters for regional development (Martin, 1998). Communication technologies contribute to the composition of regional networks
14
overreaching physical geographical boundaries, thus allowing to exploit positive interregional externalities. In a world where communication technology is increasingly reducing the relevance of physical and face-to-face contact (Cairncross, 2001), it seems particularly reasonable that a substantial endowment of ICT infrastructure, as proxy by internet access, positively contribute to the composition of networks of knowledge based economies.
Econometric Results
The spatial distribution of outcomes, the model’s dependent variable, is presented in figure 2. Regions which have moved back in the income distribution are concentrated spatially in France, northern and central Italy and the UK to the greatest extent. Oppositely, regions moving up in the distribution localize in Spain, Ireland, Eastern Europe and northern countries.
<Figure 2 about here>
Concentrating on CP, a description of the amount of funds committed is provided in figure 3 by type of outcome. The amount of funds committed under the PE category exhibits low variation across outcomes. In general, regions that remained in the same class or moved by one class have received a larger amount of money, although the difference appears not substantial. Variation is, by the contrary, more pronounced in the case of commitments under the BI category. In that case there is evidence that the funds have been allocated to the greatest extent to regions that, in fact, moved on in the income distribution.
<Figure 3 about here>
The regression model is estimated first including structural characteristics only among explanatory variables (a) and, after, including funds by expenditure category (b). The two models are presented jointly in table 4. An additional model was estimated using the total amount of funds but the variable turned to be insignificant and hence results were appropriately omitted.
<Table 4 about here>
The coefficient on initial income tests the validity of neo-classical convergence hypothesis. There is evidence that the lower the initial income in a region, the higher the probability for that region to move on in the income distribution and the lower the probability to move back6. The evidence is supported by negative coefficients associated to positive outcomes and to positive coefficients
6 In order to simplify explanation of results, hereinafter the change in probability will be referred to as a change with
respect to the probability to stay in the origin class (which is the correct interpretation of MLR coefficients), without this being further specified.
15
associated to negative outcomes respectively. In all cases but in outcome [2] the coefficient is also statistically significant. With the inclusion of funds in the econometric model, the coefficient associated to outcome [1] turns insignificant. Consequently there is evidence that lagging regions failed to catch-up based on simple capital accumulation, after controlling for the impact of CP. Both coefficients associated to negative outcomes are instead significant after the introduction of funds also.
With the few exception of the accessibility variable and internet access variable, none of selected variables used as controls exhibit a significant effect on regional transition. The contribution of the accessibility variable is negative in the case of transitions to higher relative income levels, although that evidence is weakened by the inclusion of funds in the econometric model. It is, by opposite, rather insignificant in the case of backward transitions. It is indicated, accordingly, that a greater probability of transition to higher income levels characterizes peripheral regions in Europe more than central ones. The coefficient on internet access is negative for backward transitions and almost insignificant for transitions to higher income, pointing to a greater probability to move back for regions in which ICT network is less developed. Results are, in this specific case, robust to the inclusion of funds in the regression. The evidence of a positive effect in regions moving on in the distribution is substantially insignificant from the statistical point of view, as the only significant coefficient is related to outcome [1] and only in the regression including funds.
The evidence related to the structure of the economy is uncertain. Only two coefficients, those associated to outcomes [-1; 1] are significant (the latter is actually insignificant at the 5% level but could be considered significant at 10%) and in both a positive sign is exhibited. Interpretation is different based on outcome. In the case of negative transition, it is suggested that developed regions whose economy is based more in industrial manufacturing have undergone a major economic decline as a consequence of increased global competition, and hence had greater probabilities to move back. On the opposite side, in the case of positive transitions, it is evidenced that regions whose economy has shifted from agriculture to industry exhibited higher probabilities to move on. Overall, that evidence is consistent with the delocalization of economic activities (primarily in low-tech industries) from developed to developing regions as a result of wage differentials. Such delocalization has in fact produced losses in terms of employment and productivity in the former regions alongside increases in the latter regions. Altogether, this conclusion is an ambitious attempt to interpret an evidence which is, by and large, weakly significant and that turns even not significant when funds are introduced in the regression.
16
The effect of CP on regional transition is described by estimates of coefficients related to PE, HR and BI. Higher amounts of money has been committed under PE category to regions with larger probabilities to move backward in the income distribution and, oppositely, low amounts have been granted to regions with larger probabilities to move forward of one class or more. There is evidence that funds committed under HR and BI categories had the opposite impact on transition. More specifically, result indicates that a lower probability of moving backward is associated to a larger amount of funds committed under the HR category and that s higher probability of moving forward is associated to larger amounts received under the BI category.
In order to quantify more precisely the impact of CP on regional transition, relatively to model (b) only, marginal effects have been computed and reported in table 5. Looking at the effect of initial income, there is evidence in support of the convergence hypothesis. Nevertheless, the effect of income on the probability to move backward is estimated larger, in absolute value, than that on the probability to move forward. Consistently with the evidence of transition, convergence has occurred in EU regions mostly because of the relative competitive loss in mostly developed region, and only to a lower extent because of the catch-up of lagging regions. The evidence associated to the accessibility indicator is here confirmed as more accessible regions faced larger probabilities to move backward during the transition period and the opposite is also true, although the magnitude of this effect is large in the sooner case. The estimated effect of access to internet related the variable positively to the probability to move forward and negatively to the probability to move backward. In that case also the effect is larger in relation to the probability to move backward.
<Table 5 about here>
All previous results associated with cp are confirmed. More substantial amounts of funds committed under the PE category translate into larger probabilities to move backward and lower probabilities to move forward. The effect is larger in the sooner case. Contrarily, more substantial amounts committed under the BI category turn out to affect positively the probability to move forward and, to a lower extent, negatively the probability to move backward. Finally, more resources committed under the HR category have a negative incidence on the probability to move backward. Concerning the magnitude of such effects, the largest effect of CP expenditure is associated to the PE category. In summary, MLR evidenced three main aspect of regional transition in EU regions in the period 1999-2007. The first, convergence occurred as a consequence of the relatively less satisfactory performance of developed regions. While some regions continue to drive growth in Europe, a number of other core regions is experiencing the effect of increased global competition and, as a
17
result, are performing poorly in income ranking. The second, there is a relative good performance of more peripheral regions. This translates into a foster catch-up at the aggregate EU level. The third, the diffusion of ICT infrastructures enormously contributed to foster regional convergence. In addition to this, CP did have an effect on transition and convergence7. A substantial amount of funds has been committed to BI projects and in less developed regions and there is evidence that these funds worked properly in boosting transition and catch-up. In opposite, a lower amount of funds has been committed to PE projects. These funds have been ineffective at best as they have failed, on the one hand, to boost transition in lagging regions and to prevent backward transition of leading regions experiencing a loss in competitiveness on the other hand.
Conclusion and Discussion
The effectiveness of CP in previous programming periods has been questioned, placing at the centre of an academic and policy debate the necessity to re-design regional policies. Supporters of spatially-blinded regional intervention (Deichmann et al., 2011; World Bank, 2009) argue that it is agglomeration, more specifically in the form of urbanization economies in large cities and of localisation economies in middle-size cities) that promotes growth. Spatially blind institutions and spatially connective infrastructures are therefore needed to ensure that growth benefits spread to all people in the economy. In contrast, advocates of place-based regional intervention (Barca et al., 2012; Barca, 2009) debate that agglomeration is neither necessary nor sufficient for growth and that growth based on agglomeration is not sustainable in the long run. Place-specific policy actions can better address heterogeneous instances of territories and help unveiling the unexploited growth potential.
It is a known fact that regional policy in the period 2000-2006 has been concerned with filling the infrastructural gap of less advantaged and more peripheral regions to the greatest extent. A second objective has been the promotion of regional competitiveness in developed and leading regions. One of the main outcomes of this paper is that policies for infrastructures have effectively contributed to regional catch-up and convergence while it is evidenced the lack of impact and effectiveness of the funds for competitiveness. On the one hand, the positive impact of the EU funds for basic infrastructure on regional growth of the lagging regions supports the idea of spatially connecting infrastructure proposed by the World Bank 3D model. On the other hand, the failure and inadequacy of EU funds to exploit the development potential of every territory confirm the need for a restructuring of the EU regional policy, as stressed by the Barca Report (Barca, 2009). The
7 A Wald test on joint significance of coefficients associated to CP has rejected the null hypothesis
18
based paradigm could represent a viable alternative to increase the effectiveness and efficiency of CP in promoting growth in all regions. In addition the Smart Specialization argument provides some potential benefits related to the investments of EU funds in the areas in which a region can have a context-specific competitive advantage identified by the regional authority through a rigorous process of self-assessment (McCann and Ortega-Argilés, forthcoming). As regions in Europe differ with respect to preconditions for innovation, networking and innovation barriers (Tödtling and Trippl, 2005), differentiated policies for regional innovation can better accommodate differentiated regional innovation strategies.
References
ACS, J. Z., ANSELIN, L., AND VARGA, A. (2002), Patents and innovation counts as measure of
regional production of new knowledge. Research Policy 31, pp. 1069–85.
AGHION, P., AND HOWITT, P. (1992), A Model of Growth Through Creative Destruction.
Econometrica 60, pp. 323–51.
ALBA-RAMIREZ, A. (1993), Mismatch in the Spanish labor market: overeducation? Journal of
Human Resources 28, pp. 259–78.
BARCA, F. (2009), An agenda for a reformed Cohesion Policy. Independent Report to the EU
Commission.
BARCA,F., MCCANN, P., AND RODRÍGUEZ-POSE, A. (2012), The Case for Regional Development
Intervention: Place-Based versus Place-Neutral Approaches. Journal of Regional Science 52, pp. 134–52.
BARRO,R.J. (1991), Economic Growth in a Cross Section of Countries. The Quarterly Journal of
Economics 106, pp. 407–43.
BARRO,R.J.,SALA-I-MARTIN,X.,BLANCHARD,O.J., AND HALL,R.E. (1991), Convergence Across
States and Regions. Brookings Papers on Economic Activity 1991, pp. 107–82.
BASILE,R.,DE NARDIS,S., AND GIRARDI,A. (2001), Regional Inequalities and Cohesion Policies in
the European Union. ISAE WP 23.
BECKER, S. O., EGGER, P. H., AND VON EHRLICH, M. (2010), Going NUTS: The effect of EU
Structural Funds on regional performance. Journal of Public Economics 94, pp. 578–90.
BEUGELSDIJK,M., AND EIJFFINGER,S. C. W. (2005), The Effectiveness of Structural Policy in the
European Union: An Empirical Analysis for the EU-15 in 1995–2001. Journal of Common
Market Studies 43, pp. 37–51.
BIANCHI,M. (1997), Testing for convergence: evidence from non-parametric multimodality tests.
Journal of Applied Econometrics 12, pp. 393–409.
BICKENBACH,F., AND BODE,E. (2001), Markov or Not Markov? This Should Be a Question. Kiel
19
BOLDRIN, M., AND CANOVA, F. (2001), Inequality and convergence in Europe’s regions:
reconsidering European regional policies. Economic Policy 16, pp. 205–53.
BOUVET, F. (2005), European Union regional policy: Allocation determinants and effects on
regional economic growth. Mimeo.
BRADLEY, J., UNTIEDT, G., AND MINTZE, T. (2007), Analysis of the impact of cohesion policy.
Independent Report.
BULLI, S. (2001), Distribution Dynamics and Cross-Country Convergence: A New Approach.
Scottish Journal of Political Economy 48, pp. 226–43.
CAF. (2010), Desarrollo local: hacia un nuevo protagonismo de las ciudades y regiones. Corporación Andina de Fomento.
CAIRNCROSS,F. (2001), The death of distance : how the communications revolution is changing our
lives. Boston: Harvard Business School Press.
CAMERON, A. C., AND TRIVEDI, P. K. (2005), Microeconometrics : methods and applications.
Cambridge; New York: Cambridge University Press.
CAPPELEN,A., CASTELLACCI, F., FAGERBERG,J., AND VERSPAGEN, B. (2003), The Impact of EU
Regional Support on Growth and Convergence in the European Union. JCMS: Journal of
Common Market Studies 41, pp. 621–44.
CASELLI, F., AND WILBUR, J. C. I. (2001), The U.S. Structural Transformation and Regional
Convergence: A Reinterpretation. The Journal of Political Economy 109, pp. 584–616.
CROZET, M. (2004), Do migrants follow market potentials? An estimation of a new economic
geography model. Journal of Economic Geography 4, pp. 439–58.
DALL’ERBA,S. (2005), Distribution of regional income and regional funds in Europe 1989–1999:
An exploratory spatial data analysis. The Annals of Regional Science 39, pp. 121–48.
DALL’ERBA, S., AND LE GALLO, J. (2008), Regional convergence and the impact of European
structural funds over 1989–1999: A spatial econometric analysis. Papers in Regional
Science 87, pp. 219–44.
DEICHMANN,U.,GILL,I., AND GOH,C.-C. (2011), Texture and tractability: the framework for spatial
policy analysis in the World Development Report 2009. Cambridge Journal of Regions,
Economy and Society 4, pp. 163–74.
DESDOIGTS,A. (1999), Patterns of Economic Development and the Formation of Clubs. Journal of
Economic Growth 4, pp. 305–30.
EDERVEEN, S., GORTER, J., MOOIJ, R. DE, AND NAHUIS, R. (2003), Funds and Games: The
Economics of European Cohesion Policy. European Network of Economic Policy Research
Institutes.
EDERVEEN, S., DE GROOT, H. L. F., AND NAHUIS, R. (2006), Fertile Soil for Structural Funds?A
Panel Data Analysis of the Conditional Effectiveness of European Cohesion Policy. Kyklos 59, pp. 17–42.
20
EGGER,P.,PFAFFERMAYR,M., AND WEBER,A. (2007), Sectoral adjustment of employment to shifts
in outsourcing and trade: evidence from a dynamic fixed effects multinomial logit model.
Journal of Applied Econometrics 22, pp. 559–80.
EGGERT, W., VON EHRLICH, M., FENGE, R., AND KÖNIG, G. (2007), Konvergenz- und
Wachstumseffekte der europäischen Regionalpolitik in Deutschland. Perspektiven der
Wirtschaftspolitik 8, pp. 130–46.
ESPOSTI, R., AND BUSSOLETTI, S. (2008), Impact of Objective 1 Funds on Regional Growth
Convergence in the European Union: A Panel-data Approach. Regional Studies 42, pp. 159– 73.
EU. (2004), A new partnership for cohesion - Third report on economic and social cohesion. Brussels: European Commission.
EU. (2007), Study on the economic impacts of convergence interventions (2007-2013). Brussels: European Commission.
EU. (2010), Evaluation network delivering policy analysis on the performance of cohesion policy. Brussels: European Commission.
FALK,M., AND SINABELL,F. (2008), The effectiveness of objective 1 structural funds in the EU 15:
New empirical evidence from NUTS 3 regions. WIFO WP 310.
FINGLETON, B. (1997), Specification and Testing of Markov Chain Models: An Application to
Convergence in the European Union. Oxford Bulletin of Economics and Statistics 59, pp. 385–403.
FINGLETON,B. (1999), Estimates of Time to Economic Convergence: An Analysis of Regions of
the European Union. International Regional Science Review 22, pp. 5–34.
DE FREITAS,M.L.,PEREIRA,F., AND TORRES,F. (2003), Convergence among EU regions, 1990–
2001. Intereconomics 38, pp. 270–5.
LE GALLO, J. (2004), Space-Time Analysis of GDP Disparities among European Regions: A
Markov Chains Approach. International Regional Science Review 27, pp. 138–63.
GARCIA-MILÀ,T., AND MCGUIRE,T. J. (2001), Do Interregional Transfers Improve the Economic
Performance of Poor Regions? The Case of Spain. International Tax and Public Finance 8, pp. 281–96.
GUASTELLA,G., AND TIMPANO,F. (2010), Spillovers diffusion and regional convergence: a gravity
approach. Regional Science Inquiry 2, pp. 71–82.
GURRÍA,A. (2013), Improved multi-level governance key to tackling widening regional inequalities
and ensuring inclusive recovery. Retrieved from http://www.oecd.org/newsroom/improved-
multi-level-governance-key-to-tackling-widening-regional-inequalities-and-ensuring-inclusive-recovery.htm
HAGEN,T., AND MOHL,P. (2008), Which is the Right Dose of EU Cohesion Policy for Economic
21
ISLAM, N. (2003), What have We Learnt from the Convergence Debate? Journal of Economic
Surveys 17, pp. 309–62.
KRUGMAN, P. (1991), Increasing Returns and Economic Geography. The Journal of Political
Economy 99, pp. 483–99.
KRUGMAN,P., AND VENABLES,A.J. (1995), The Seamless World: A Spatial Model of International
Specialization. NBER Working Paper series, W5220.
LUCAS,R.E. (1988), On the mechanics of economic development. Journal of Monetary Economics
22, pp. 3–42.
MACRAE, E. C. (1977), Estimation of time-varying Markov processes with aggregate data.
Econometrica 45, pp. 183–98.
MAGRINI,S. (1999), The evolution of income disparities among the regions of the European Union.
Regional Science and Urban Economics 29, pp. 257–81.
MAGRINI,S. (2004), Regional (di)convergence, in: J. V. Henderson & J.-F. Thisse (Eds.), Cities and
Geography, pp. 2741–96. Elsevier.
MANKIW,N.G.,ROMER,D., AND WEIL,D.N. (1992), A Contribution to the Empirics of Economic
Growth. The Quarterly Journal of Economics 107, pp. 407–37.
MARTIN, P. (1998), Can Regional Policies Affect Growth and Geography in Europe? World
Economy 21, pp. 757–74.
MCCANN,P., AND ORTEGA-ARGILÉS,R. (forthcoming), Smart Specialization, Regional Growth and
Applications to European Union Cohesion Policy. Regional Studies.
MCFADDEN,D. (1974), Conditional logit analysis of qualitative choice behavior, in: P. Zarembka
(Ed.), Frontiers in Econometrics, pp. 105–42. New York: Academic press.
MOHL,P., AND HAGEN,T. (2010), Do EU structural funds promote regional growth? New evidence
from various panel data approaches. Regional Science and Urban Economics 40, pp. 353– 65.
OECD. (2009a), How regions grow: trends and analysis. Paris: Organisation for Economic Co-operation and Development.
OECD. (2009b), Regions matter: economic recovery, innovation and sustainable growth. Paris: Organisation for Economic Co-operation and Development.
OECD. (2009c), OECD Regions at a Glance 2009. Paris: Organisation for Economic Co-operation and Development.
OECD. (2011), OECD regional outlook 2011: building resilient regions for stronger economies. Paris: Organisation for Economic Co-operation and Development.
OTTAVIANO,G.I.P., AND PUGA,D. (1998), Agglomeration in the Global Economy: A Survey of the
22
PERCOCO,M. (2005), The impact of structural funds on the Italian Mezzogiorno, 1994-1999. Région
et Développement 21, pp. 141–53.
PIKE, A., RODRÍGUEZ-POSE, A., AND TOMANEY, J. (2011), Handbook of local and regional
development. London ; New York: Routledge.
POTERBA,J.M., AND SUMMERS,L.H. (1995), Unemployment benefits and labor market transitions:
A multinomial logit model with errors in classification. The Review of Economics and
Statistics 77, pp. 207–16.
PUIGCERVER-PENALVER, M. C. (2007), The Impact of Structural Funds Policy on European
Regions’ Growth : A Theoretical and Empirical Approach. The European Journal of
Comparative Economics 4, pp. 179–208.
QUAH,D.T. (1993a), Empirical cross-section dynamics in economic growth. European Economic
Review 37, pp. 426–34.
QUAH,D.T. (1993b), Galton’s Fallacy and Tests of the Convergence Hypothesis. The Scandinavian
Journal of Economics 95, pp. 427–43.
QUAH,D.T. (1996a), Empirics for economic growth and convergence. European Economic Review
40, pp. 1353–75.
QUAH,D. T. (1996b), Regional convergence clusters across Europe. European Economic Review
40, pp. 951–8.
QUAH,D.T. (1996c), Twin Peaks: Growth and Convergence in Models of Distribution Dynamics.
The Economic Journal 106, pp. 1045–55.
RAMAJO,J.,MÁRQUEZ,M.A.,HEWINGS,G.J.D., AND SALINAS,M.M. (2008), Spatial heterogeneity
and interregional spillovers in the European Union: Do cohesion policies encourage convergence across regions? European Economic Review 52, pp. 551–67.
RODRÍGUEZ-POSE, A., AND FRATESI, U. (2004), Between Development and Social Policies: The
Impact of European Structural Funds in Objective 1 Regions. Regional Studies 38, pp. 97– 113.
ROMER,P. (1986), Increasing Returns and Long-Run Growth. The Journal of Political Economy 94,
pp. 1002–37.
SOLOW,R.M. (1956), A Contribution to the Theory of Economic Growth. The quarterly journal of
economics 70, pp. 65–94.
SOUKIAZIS,E., AND ANTUNES,M. (2006), Two Speed Regional Convergence In Portugal And the
Importance of Structural Funds on Growth. Ekonomia 9, pp. 222–41.
SPIEKERMANN,K., AND WEGENER,M. (2007), Update on Accessibility Maps. ESPON project 1.2.1
final report.
SWECO. (2008), ERDF and CF Regional Expenditure - Final Report. Retrieved from www.sweco.se
23
TÖDTLING, F., AND TRIPPL, M. (2005), One size fits all?: Towards a differentiated regional
innovation policy approach. Research Policy 34, pp. 1203–19.
VELD, J. IN’T. (2007), The potential impact of fiscal transfers under the EU cohesion policy
programmes. European Economy 283.
WORLD BANK. (2009), Reshaping economic geography. Washington, D.C: World Bank.
Appendix
24
Tables
Table 1 - Transition matrix and probabilities
Transition matrix
upper limit 0.512 0.741 0.834 0.922 1 1.07 1.13 1.22 1.38 inf
0.512 16 9 0.741 20 3 1 0.834 5 11 5 3 1 0.922 8 8 2 2 1 1 14 9 3 1 1.07 9 11 2 1 1 1.13 1 3 9 7 5 1 1.22 4 6 9 3 1.38 1 6 15 2 inf 8 17 Probabilities
upper limit 0.512 0.741 0.834 0.922 1 1.07 1.13 1.22 1.38 inf
0.512 0.640 0.360 0.741 0.833 0.125 0.042 0.834 0.200 0.440 0.200 0.120 0.040 0.922 0.381 0.381 0.095 0.095 0.048 1 0.519 0.333 0.111 0.037 1.07 0.375 0.458 0.083 0.042 0.042 1.13 0.038 0.115 0.346 0.269 0.192 0.038 1.22 0.182 0.273 0.409 0.136 1.38 0.042 0.250 0.625 0.083 inf 0.320 0.680
25 Table 2 - Distribution of funds across income quintiles
upper limit 0.512 0.741 0.834 0.922 1 1.07 1.13 1.22 1.38 inf
PE Mil 85871 492565 396058 276556 146866 111908 138379 122018 77519 39035 pct 0.046 0.261 0.210 0.147 0.078 0.059 0.073 0.065 0.041 0.021 cum sum 0.046 0.307 0.516 0.663 0.741 0.800 0.874 0.938 0.979 1.000 HR Mil 3574 21263 29615 24098 18554 7032 7996 4107 6348 3376 pct 0.028 0.169 0.235 0.191 0.147 0.056 0.063 0.033 0.050 0.027 cum sum 0.028 0.197 0.432 0.624 0.771 0.827 0.890 0.923 0.973 1.000 BI Mil 441194 1306957 790096 683121 211295 63545 174424 230867 218265 33426 pct 0.106 0.315 0.190 0.164 0.051 0.015 0.042 0.056 0.053 0.008 cum sum 0.106 0.421 0.611 0.776 0.827 0.842 0.884 0.939 0.992 1.000 TOT Mil 530639 1820785 1215769 983776 376715 182485 320799 356991 302133 75837 pct 0.086 0.295 0.197 0.160 0.061 0.030 0.052 0.058 0.049 0.012 cum sum 0.086 0.381 0.579 0.738 0.799 0.829 0.881 0.939 0.988 1.000
26 Table 3 - Distribution of funds across categories
upper limit 0.512 0.741 0.834 0.922 1 1.07 1.13 1.22 1.38 inf
PE 0.162 0.271 0.326 0.281 0.390 0.613 0.431 0.342 0.257 0.515 HR 0.007 0.012 0.024 0.024 0.049 0.039 0.025 0.012 0.021 0.045 BI 0.831 0.718 0.650 0.694 0.561 0.348 0.544 0.647 0.722 0.441
27
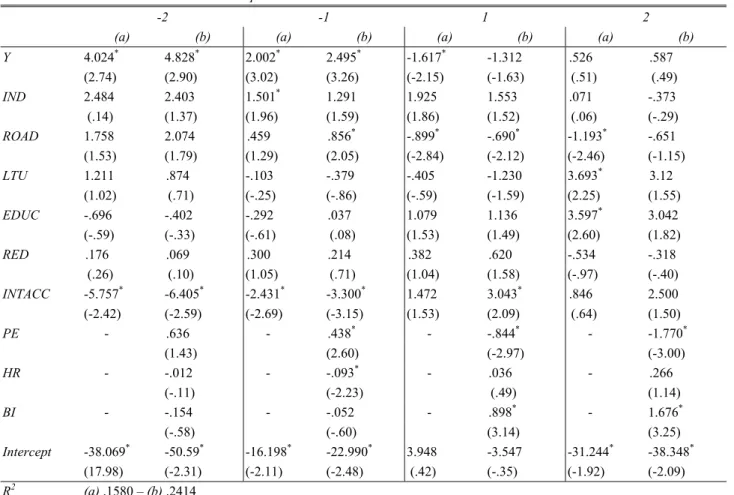
Table 4 - Estimation result of the multinomial logistic regression model ML estimates – multinomial outcome is the dependent variable
-2 -1 1 2
(a) (b) (a) (b) (a) (b) (a) (b) Y 4.024* 4.828* 2.002* 2.495* -1.617* -1.312 .526 .587 (2.74) (2.90) (3.02) (3.26) (-2.15) (-1.63) (.51) (.49) IND 2.484 2.403 1.501* 1.291 1.925 1.553 .071 -.373 (.14) (1.37) (1.96) (1.59) (1.86) (1.52) (.06) (-.29) ROAD 1.758 2.074 .459 .856* -.899* -.690* -1.193* -.651 (1.53) (1.79) (1.29) (2.05) (-2.84) (-2.12) (-2.46) (-1.15) LTU 1.211 .874 -.103 -.379 -.405 -1.230 3.693* 3.12 (1.02) (.71) (-.25) (-.86) (-.59) (-1.59) (2.25) (1.55) EDUC -.696 -.402 -.292 .037 1.079 1.136 3.597* 3.042 (-.59) (-.33) (-.61) (.08) (1.53) (1.49) (2.60) (1.82) RED .176 .069 .300 .214 .382 .620 -.534 -.318 (.26) (.10) (1.05) (.71) (1.04) (1.58) (-.97) (-.40) INTACC -5.757* -6.405* -2.431* -3.300* 1.472 3.043* .846 2.500 (-2.42) (-2.59) (-2.69) (-3.15) (1.53) (2.09) (.64) (1.50) PE - .636 - .438* - -.844* - -1.770* (1.43) (2.60) (-2.97) (-3.00) HR - -.012 - -.093* - .036 - .266 (-.11) (-2.23) (.49) (1.14) BI - -.154 - -.052 - .898* - 1.676* (-.58) (-.60) (3.14) (3.25) Intercept -38.069* -50.59* -16.198* -22.990* 3.948 -3.547 -31.244* -38.348* (17.98) (-2.31) (-2.11) (-2.48) (.42) (-.35) (-1.92) (-2.09) R2 (a) .1580 – (b) .2414
Note: t-statistic in parenthesis. * denotes significance at a 5% (or lower) confidence level. R2 refers to the (McFadden, 1974) measure
28 Table 5 - Marginal effects
ML estimates – multinomial outcome is the dependent variable
(-2) (-1) (1) (2) Y 0.044 (0.03) 0.468*** (0.13) -0.157* (0.06) 0.000 (0.00) IND 0.020 (0.02) 0.198 (0.14) 0.092 (0.08) -0.003 (0.01) ROAD 0.020 (0.01) 0.165 ** (0.07) -0.072 ** (0.03) -0.003 (0.00) LTU 0.011 (0.01) -0.049 (0.08) -0.089 (0.06) 0.011 (0.01) EDUC -0.005 (0.01) -0.018 (0.09) 0.087 (0.06) 0.010 (0.01) RED 0.000 (0.01) 0.026 (0.05) 0.044 (0.03) -0.001 (0.00) INTACC -0.060+ (0.04) -0.648 *** (0.17) 0.308 *** (0.11) 0.011 (0.01) PE 0.006 (0.01) 0.097*** (0.03) -0.074*** (0.02) -0.006 (0.01) HR 0.000 (0.00) -0.018** (0.01) 0.005 (0.01) 0.001 (0.00) BI -0.002 (0.00) -0.029 * (0.02) 0.070 *** (0.02) 0.006 (0.01) Note: SE in parenthesis. ***, ** and * denote significance at a 1%, 5% and 10% confidence levels.
29
Table A 1 - Structural Funds: Area of Intervention by category and sub-category
Digit level - Code Description
1 PRODUCTIVE ENVIRONMENT 11 Agriculture
12 Forestry
13 Promoting the adaptation and the development of rural areas 14 Fisheries
15 Assisting large business organizations 16 Assisting SME’s and the craft sector 17 Tourism
18 Research, technological development and innovation 2 HUMAN RESOURCES
21 Labor market policy 22 Social Inclusion
23 Developing Educational and Vocational Training not linked to a specific sector 24 Workforce flexibility, entrepreneurial activity, innovation, information and communication technologies 25 Positive labour market actions for women
3 BASIC INFRASTRUCTURE 31 Transport Infrastructure
32 Telecommunication infrastructure and information society 33 Energy infrastructures (production, delivery)
34 Environmental infrastructure (including water) 35 Planning and rehabilitation
36 Social and public health insurance 4 MISCCELLANEOUS
41 Technical assistance and innovative activities
List of Figures
Figure 1– Decile distribution of standardized income, 1999-2007 Figure 2 – Map of MLR dependent variable