Alma Mater Studiorum
Università di Bologna
Scuola di Dottorato di Ricerca
in Scienze Mediche e Chirurgiche
Dottorato di Ricerca in Scienze Biomediche
Progetto formativo in Neurofisiologia
XXV ciclo
Settore concorsuale di afferenza: 05/D1
Settore scientifico-disciplinare: BIO/09
Tesi di Dottorato
Coding of reaching in 3-D space
Dott. Federica Bertozzi
Coordinatore:
Tutor:
Prof. Claudio Galletti
Prof. Patrizia Fattori
Dipartimento di Fisiologia umana e generale
Esame finale anno 2013
CONTENTS
1. INTRODUCTION 4
1.1. Encoding of 3D space 4
1.2. Neural substrate of reaching in monkeys 6
1.3. The role of parietal area V6A in reaching 8
1.4. Effect of target depth in reaching 10
1.5. The role of frontal areas in reaching 14
1.6. The representation of depth and direction signals: studies in humans 15 1.7. Kinematic properties of reaching movements 17
1.8. Aim of the work 20
2. MATERIALS AND METHODS 22
2.1. Experimental and surgical procedures 22
2.2. Reaching task 25
2.3. Kinematic recording 28
2.4. Neural data Analysis 30
2.5. Kinematic data analysis 32
3. RESULTS 35
3.1. Tuning for depth and direction in the different task phases 38
3.2. Spatial tuning in different task phases 42
3.3. Cell Categories 47
3.4. Movement trajectories 53
3.6. Velocity Profiles 60
3.7. Mean peak velocity 61
3.8. Mean peak acceleration 63
3.9. Mean peak deceleration 65
3.10. Percentage of movement at the peak velocity 66
3.11. Percentage of movement accelerating 69
3.12. Percentage of movement decelerating 71
4. DISCUSSION 75
4.1. Depth and directional tuning 75
4.2. Caveats 80
4.3. Spatial tuning in the different task phases 81
4.4. Kinematic of reaching movements 83
4.5. Correlation between kinematic and neural data 85
5. REFERENCES 87
1. INTRODUCTION
In everyday life, we frequently execute reaching movements, for example to grasp a cup of tea or to reach the handle of the door. These actions are usually performed accurately, automatically and without thinking to the hand trajectory or to the muscles contraction. However, our brain performs complex computations integrating the visual and proprioceptive information to program appropriate reaching actions. To execute reaching movements, the information about the target location is necessary to process the hand trajectory and the corresponding motor command that guides the muscles. Multiple sensory systems generally provide spatial information, and the movement often involves the coordination of several body segments, as in orienting the eyes, head and arm together towards the target (Jeannerod, 1988; Lacquaniti, 1997). In the present thesis, I aimed to study the sensory-motor transformations in 3D space and in particular the neural encoding of arm movements when the reach targets are located at different depths and directions. I investigated the incidence and the temporal relationship of the effect of target spatial position on the neurons of macaque medial posterior parietal cortex.
1.1. Encoding of 3D space
The execution of goal-directed actions requires the accurate identification of target position in three-dimensional space. The localization of a visual target in 3D space depends on the combination of visual signals, as well as retinal disparity, binocular direction signals and fixation distance information (Pouget and Sejnowsky, 1994). The fixation distance signals are obtained from several information: the accomodation of the eyes, the vertical disparity and the binocular eye position, corresponding to the angle between the gaze projections during the binocular vision of a target, known as vergence angle. Vergence seems to be the most important one, in particular for the encoding of depth fixation. Most of the vergence range is used for fixation distance that are approximately equal to the arm length and to the peri-personal space (Viguier et al., 2001). Interestingly, in infants, reaching perfomance develops at the same time as
binocular control (von Hofsten, 1977). Another important variable is the version angle that measures the conjugated movements of the eyes towards a gaze target and it can represent the fixation direction. It is possible to represent the reach target location by processing the ocular vergence and version when the reach target corresponds to the gaze target, because in this case the target position coincides with the fixation position. This situation occurs very frequently, the goal-directed action is usually associated to an eye movement that ‘catches’ the reach target bringing its image on the fovea.
Depth and direction signals, represented with vergence and version parameters respectively, are significant variables in planning and execution of eye and reaching movements. It is generally assumed that target depth and direction are processed in functionally separated visuomotor circuits (Cumming and DeAngelis, 2001; Vindras et al., 2005). But in more complex conditions, direction and distance cannot be considered as independent variables in the neural computation of spatial encoding (Crawford et al., 2011). The distinct or common process of integration of the two different signals is still debated.
Another long-standing issue concerns the temporal evolution of direction and depth computation that has collected conflicting results. Many studies suggested that direction is processed before depth (Bhat and Sanes, 1998) in contrast with the hypothesis that the processing of direction happen after or at the same time of depth (Rosenbaum, 1980). Another prominent issue in physiology regards the computation of several multisensory information used to encode the spatial goal-directed actions. To program and perform a reach movement, the brain has to discriminate and update the spatial position of the target and the hand. Different systems (e.g. visual, oculomotor and proprioceptive) provide distinct spatial information and the heterogeneity of these spatial representations needs to be integrated across different networks and to be transformed into commands suitable for reach action toward the target, merging the several signals in a unitary 3D map (Lacquaniti, 1997). How these multisensory afferences are integrated using the same reference frame remains still unclear.
1.2. Neural substrate of reaching in monkeys
The neural substrate of reach target location in monkeys is formed by the circuit that involves visual, parietal and frontal areas. Visual information are projected from the occipital pole following two main pathways: a dorsal one directed to posterior parietal cortex that resulted to be involved in the localization and the interaction with the objects and a ventral one that reaches the cortex of the inferior temporal lobe and that is dedicated for the recognizing of the objects features (Ungerleider and Mishkin, 1982). The dorsal visual stream includes at least two separate networks: a medial one passing mainly through the visual areas of the superior parietal lobule (SPL), and a lateral one passing mainly through the visual areas of the inferior parietal lobule (IPL). The dorsomedial visual stream has been supposed to process the visuomotor transformations necessary for guiding the reaching movements of the arm, while the dorsolateral visual stream is involved in the encoding of the visuomotor transformations necessary for grasping (Sakata and Taira, 1994; Tannè et al., 1995). In contrast with this view, recent neurophysiological and anatomical data reported that the medial sector of the parieto-occipital cortex integrates and controls both reaching and grasping hand actions (Galletti et al., 2003). This cortical region includes a retinotopically organized visual area, called V6 (Galletti et al., 1999a) and, dorsally to V6, a not-retinotopically organized area, called V6A (Galletti et al., 1999b), as shown in Figure 1. About half of the cortical connections of V6 is with visual areas of the occipital lobe (V1, V2, V3, V3A), and the other half with the areas of the dorsal visual stream: 30% with the visual areas of the dorso-lateral visual stream (V4T, MT/V5, MST, LIP) and 22% with bimodal (visual and somatosensory) areas of the dorso-medial visual stream (V6A, MIP, VIP). Area V6 is not directly connected with the ventral visual stream neither with the frontal areas (Galletti et al., 2001). A different pattern of cortical connections was identified in the area V6A that contains neurons connected with area MIP, PEc, PG, PGm, F7 and F2 (Gamberini et al., 2009). V6A receives its major input from area MIP, cortical region responsive to passive somatosensory and visual stimulation and to active arm-reaching movements. The strong connections found between V6A and MIP support the view that the two areas form part of a circuit involving reciprocal interaction, in which visual/somatic/motor information is processed before and during the act of reaching. Minor connections of V6A were found with area AIP, known to be involved in coding object features and hand movements for grasping objects, and with area F2, containing both reaching- and grasping-related
neurons. This supports the view that V6A is involved in the control of both reaching and grasping movements (Galletti and Fattori, 2003; Gamberini et al., 2009).
Figure 1. Medial Posterior Parietal Cortex of macaque brain
Posterolateral view of a partially dissected macaque brain (Gamberini et al., 2009). The inferior parietal lobule of the right hemisphere has been cut away at the level of the fundus of the intraparietal sulcus to show the cortex of the medial bank of this sulcus. The occipital lobe of the same hemisphere has been cut away at the level of the fundus of the occipital and lunate sulci to show the cortex of the anterior bank of the parieto-occipital sulcus. The mesial surface of the left emisphere is drawn, with the main sulci and the posterior parietal areas reported. POs, parieto-occipital sulcus; Cal, calcarine sulcus; Cin, cingulate sulcus; IOs, inferior-occipital sulcus; OTs, occipito-temporal sulcus; STs, superior temporal sulcus; Cs, central sulcus; Ars, superior arcuate sulcus; Ari inferior arcuate sulcus; Ps, principal sulcus; areas V6, V6Ad, V6Av, PEc, PE, MIP, PEip, VIP, PGm are also indicated.
1.3. The role of parietal area V6A in reaching
Many cells in area V6A are sensitive to reach movements towards targets located in the peri-personal space (Fattori et al., 2001; Galletti et al., 1997a). The V6A somatic representation supports the hypothesis that reaching responses could be related to the update of somatosensory input coming from the moving arm. The sensitivity for passive somatosensory stimuli in V6A (Breveglieri et al., 2002) actually is in line with this view. However, the observation that reach-related activity in V6A is generally stronger during active than passive arm movements suggested that skeletomotor information could be partially responsible for the reach signals reported in literature. There are evidences demonstrating that visual and somatosensory signals cannot fully explain reaching responses. In Galletti et al. (1997), neurons modulated by reaching movements showed an increased firing rate 200 ms before the beginning of the motor action. This phenomenon must be due to other information that became available before the muscle activation. It is possible an involvement of a preparatory motor activity, as well as the computation of an efferent copy of motor signal delivered by the dorsal premotor areas F2 and F7, which are reciprocally connected with V6A (Matelli et al., 1991; Matelli et al., 1998; Gamberini et al., 2009).
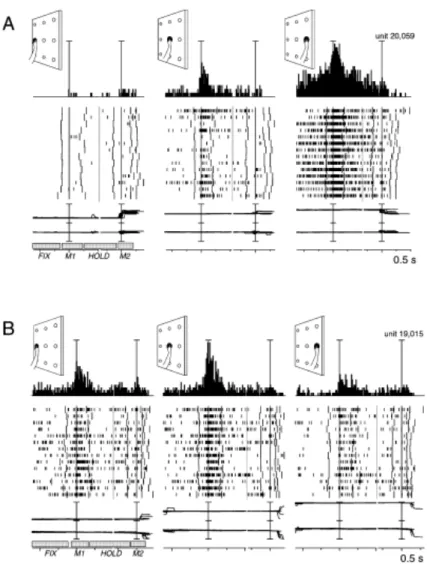
Neurons of area V6A were found to be very sensitive to reaching movements towards different directions: Fattori and collaborators (2005) studied neural activity while monkeys were involved in a body-out reaching task on foveated targets placed on a frontal plane. The presence of significant reach-related discharges when the targets were reached in darkness demonstrates that the sensitivity of V6A cells on the goal-directed actions was independent of visual feedback of the moving arm. It has also been reported that about 40% of neurons modulated by reaching movements showed strong direction tuning (Figure 2A-B). These data suggest that V6A reach-related neurons are able to encode the movement direction and the arm spatial position. These findings are in line with the results found in area V6A while the monkeys performed several reaching tasks towards different directions where retinal, eye and arm related signals were separated (Marzocchi et al., 2008). This study focused on the early stage of movement direction programming and suggested the involvement of area V6A in the mechanisms underlying the early combination of eyes and arm signals for the composition of motor commands to perform reaching actions towards different directions.
Figure 2A-B. Examples of reach-related neurons modulated by movement direction (Fattori et al., 2005)
Each inset contains the peri-event time histogram, raster plots and eye position signals. It is positioned in the same relative position as the target on the panel, as sketched in the top left corner of each inset. Neural activity and eye traces show two alignments in each inset: the first one indicates the onset of outward movements and the second one the onset of inward movements. The mean duration of fixation (FIX), movement (M1), hold (HOLD) and return (M2) is showed in the bottom left inset. Scalebar in peri-event time histograms corresponds to 70 spikes/s in the first neuron and 100 spikes/s in the second neuron.
A, Neuron sensitive to the spatial position of the target during reaching movement
preferring rightward goal-directed actions.
B, Neuron spatially modulated during reach movements with a preference for reaches
1.4. Effect of target depth in reaching
Compared to direction tuning, fewer studies analyzed how the depth sensitivity, the other important variable to execute reaching movements, is represented in monkey brain. Genovesio and Ferraina (2004) reported that LIP neurons are involved in the processing of target distance integrating visual disparity signals with vergence signals in a manner that can be used to encode the distance of a target in 3D space. Gaze signals are transformed in egocentric reference frame to process the depth of the reach target. In another study, Ferraina et al. (2009) analyzed in area PE the vergence modulation of reach-related activities for target located at different distances. The authors reported that PE reach-related neurons combined binocular eye position signals about fixation depth with hand position signals to encode reach movement amplitude. The main goal of that work was to investigate the influence of hand position on reach distance tuning in order to clarify which coordinate system was used to encode target spatial location but the interaction and the temporal evolution of both depth and direction signals were not described.
A more recent study (Breveglieri et al., 2012) investigated how vergence but also version signals are processed in area V6A while monkeys maintained steady fixation. These results revealed that the majority of V6A neurons were modulated by both variables suggesting that the integration of vergence and version signals is already present in this early node of the dorsal visual stream (Figure 3A-B). It is interesting to note that during fixation the version selectivity decayed more rapidly than the vergence one supporting the hypothesis that direction signals were processed before distance information.
Figure 3A-B. Example of two V6A neurons tuned for both vergence and version signals during fixation (Breveglieri et al., 2012)
Neural responses to the nine fixation targets located at three different depths (lines) and three different directions (columns). Rasters are arranged from near (bottom) to far (top) and from contralateral (left) to ipsilateral (right) and are aligned twice: at the fixation onset and at the stop signal for gaze fixation. Dashed lines indicate the point at which trials were cut for the double alignment.
A, Neuron showing a clear preference for the near contralateral space.
The data previously described regard only fixation targets and skip to investigate the effect of vergence and version signals during the execution of goal-directed movements. Only Lacquaniti et al. (1995) evaluated the effect of both direction and depth signals on the neural responses in area 5 during reaching actions. The monkeys were trained to perform goal-directed movements towards targets located at similar directions within 3 different workspaces, starting from 3 initial hand positions. Each starting location was located in the middle of an imaginary cube where at each corner of the cube a reach target was placed (Figure 4A-C).
This experimental setup allowed maintaining equal movement direction across space, varying the pattern of muscular and joint activity required for these reaching actions. The majority of area 5 neurons was influenced by the spatial location of the hand within a shoulder-centered spherical reference frame with neurons encoding azimuth or elevation or reach amplitude individually. The activity of another population of neurons was not related to the final hand position, but rather to the vectorial difference between initial and final hand position, defined as movement vector.
Figure 4A-C. Experimental apparatus used to study reaches occurring at different depths and directions (Lacquaniti et al., 1995)
A, Experimental setup with the empty circles representing the reach targets and x, y, z
representing the spatial Cartesian coordinates.
B, Black filled circles represent the initial positions of the hand. The monkeys perform
movement starting from one of the three possible initial positions towards one of eight reach directions (arrows).
C, Shoulder-centered reference frame. Wrist coordinates are elevation Ψ, azimuth χ and
1.5. The role of frontal areas in reaching
Electrophysiological recordings in primary motor cortex (M1) and in dorsal premotor cortex (PMd) revealed the presence of neurons involved in the process of encoding reach target location, integrating direction and depth signals. Fu et al. (1993) described neurons modulated by movement direction, distance and by the interaction of the two parameters in both M1 and PMd. Successive analysis of the reported data indicated a temporal separation: movement direction was encoded first, followed by target position and then by movement depth (Fu et al., 1995). According to these studies, Messier and Kalaska (2000) found a strong and prevalent modulation for the interaction of depth and direction signals in reach-related activities of PMd neurons and an increased tuning to movement amplitude during the motor execution. Another important finding revealed by the studies previously described was that most of PMd cells were found to be sensitive to both movement direction and distance but only very few neurons were tuned only for target distance signal. These results are in contrast with the data found in PPC (Lacquaniti et al., 1995) and with the hypothesis that depth and direction information are processed independently (Bagesteiro et al., 2006; Gordon et al., 1994; Sainburg et al., 2003; Vindras et al., 2005; Van Pelt and Medendorp, 2008; Crawford et al., 2011) but suggest that these reach movement variables converge at single-cell level in PMd.
The mentioned studies demonstrate that the process of goal-directed actions involved many areas in the integration of depth and direction information. Movement depth and direction signals are both critical and strictly correlated, even if their computation seems to be temporally separated.
1.6. The representation of depth and direction signals: studies in humans
In humans, the involvement of posterior parietal areas encoding reach target position in 3D space is supported by data collected on patients suffering from optic ataxia. After lesions in the superior parietal lobule and parieto-occipital junction, ataxic patients misreached the target showing error of trajectory, finger pre-shaping and movement end-point. These difficulties occurred more frequently in the peripheral vision but happened also towards foveated targets when the visual feedback was absent (Perenin and Vighetto, 1988; see Battaglia-Mayer et al., 2006 for review). These findings were in accordance with the data reported by Prado et al. (2005) about the critical role of medial intra-parietal sulcus (IPS), PMd and medial occipito-parietal junction (mPOJ) in the execution of visually-guided actions. These results were also confirmed analyzing the effects of a reversible inhibition of posterior parietal cortex (PPC) activity using transcranical magnetic stimulation (TMS): after this manipulation the subjects showed deficits in the accuracy of hand movement trajectory (Desmuget et al., 1999). The aforementioned studies confirmed the role of parietal cortex processing goal-directed action towards targets located in a certain spatial location. Parietal and frontal areas were also found to be sensitive to the laterality of reaching movements and the magnitude of these direction responses increased moving from posterior to anterior areas (Fabbri et al., 2010). However, less is known about the sensitivity of these human regions to movement extent. Fabbri et al. (2012) investigated the role of directionally tuned neuronal population encoding movement amplitude in frontal and parietal regions and found differences between the two areas in the integration of movement depth and direction. These results revealed that parietal areas encode combinations of movement depth and direction and that in the frontal pole the neural responses could be correlated to reach depth where the cerebral activity grew with the increase of movement extent. The role of parietal areas encoding reach depth variable was found initially by Baylis and Baylis (2001) that described deficits in visually-guided reaching movements towards targets located at different depth, as effect of disease involving posterior parietal regions. In agreement with these data, Danckert et al. (2009) demonstrated that patients with lesions in parietal cortex show more deficits in pointing to objects placed at different depth than at different directions (Figure 5) and this findings support the important role of PPC encoding the location of reach targets especially in the depth dimension.
Figure 5. Experimental setup for movement towards different directions (left) and
for movement in depth (right) (Dankert et al., 2009)
The subjects and the patient perform pointing movements towards one of the three targets for each trial. The patient had more deficits in movements in the sagittal axis than in the frontoparallel plane, as a consequence of a lesion in the right superior parietal cortex.
1.7. Kinematic properties of reaching movements
Reach movement in three-dimensional space can be studied analyzing different motor properties: dynamic, kinematic or other aspects of motor behavior. It is possible that cortical areas involved in the process of one or more movement kinematic parameters exist and that this encoding occurs following an extrinsic Cartesian coordinates system within the peri-personal space. The kinematic motor parameters used to describe the movement vectors are velocity and acceleration. It is possible to calculate the relative averages (mean velocity, mean acceleration), the maximum (peak velocity, peak acceleration), the minimum values (peak deceleration) and the percentage of motion that occurs when the peaks are reached (time of peak velocity, time of peak acceleration, time of peak deceleration). Kinematic properties characterizing reaching actions have been widely studied in humans. It has been described that velocity profiles are single-peaked and bell-shaped (Morasso, 1981), peak velocity and peak acceleration are correlated with movement amplitude (Gordon et al., 1994b) and an increase in the target distance relative to the hand causes an increase of both movement duration and wrist peak velocity (Gentilucci et al., 1991; Kudoh et al., 1997). Furthermore, there is also a wide literature that focused on movement trajectory features and shapes. Different hypotheses in the execution of goal-directed actions have been formulated: a simple view is that the human movement trajectories are roughly straight in the workspace (Morasso, 1981; Georgopoulos and Massey, 1988; Gordon et al., 1994b) and an alternative strategy provides straight trajectories in joint space which may result a curved hand path in workspace (Atkeson and Hollerbach, 1985). Atkeson and Hollerbach (1985) found curved paths for movements in the sagittal plane. Cruse and Brüwer (1987) suggested that the shapes of human reaching trajectories reflect a compromise between the subject trend to reproduce simultaneously a straight line in both workspace and joint space. Another explanation of the movement curvature found by Atkeson and Hollerbach (1985) was related to the unconstrained nature of the selected tasks, as monkeys also have been reported to use more curved paths during unconstrained similar reaches (Wenger et al., 1999; Jindrich et al., 2011). In addition, monkeys also showed curvature during more constrained center-out tasks (Scott et al., 1997).
Messier and Kalaska (1999) had also demonstrated that, in humans, the kinematic parameters describing the beginning of the movement are not completely predetermined and cannot predict depth and distance of a reaching target in a simple ballistic manner.
Compensatory adjustments are necessary during the execution of the movement to correct the initial variability of movement direction and to scale velocity and acceleration relative to action amplitude. This study revealed some differences between depth and direction dimensions (i.e. variability in movement amplitude was higher than in direction), supporting the hypothesis that the two components were processed independently (see also Gordon et al., 1994a-b). The finding that the variability of peak velocity, peak acceleration and end-point distribution in movement direction and amplitude were differently influenced during the execution of the goal-directed action suggested that depth and direction are not specified and controlled simultaneously but in different moments. In contrast to these results, this study also reported evidences for the correlation of movement velocity, acceleration and duration with target distance. Subjects varied movement duration as well as velocity and acceleration as a function of reaching extent. In contrast with psychophysical data in humans, as the work previously described, less is known about the kinematic properties of monkey reaching movements towards targets located at different depths and directions. Some comparative kinematic studies on reaching and grasping behavior in humans and monkeys have been carried out to investigate the similarities and differences existing across the two species (Fogassi et al., 1991; Christel and Billard, 2002; Roy et al., 2000, 2002, 2006; Jindrich et al., 2011; Sartori et al., 2012). Although these studies seem to support the hypothesis that monkeys and humans share a number of kinematic features, important differences have been reported and the debate continues to unfold.
Roy et al. (2000) investigated kinematic characteristics of macaque hand movement involved in pointing, reaching and grasping under unperturbed and perturbed conditions. The main finding reported by this study was that monkey kinematics showed a high similarity with human kinematics, in particular for the pointing towards different directions, the perturbation effect and the reaching and grasping temporal pattern. Indeed, in accordance with human evidences, monkeys reaching movements showed a bell-shaped wrist velocity profile. These similarities suggested that the macaque monkey could be a suitable model for studying human motor system. The only disagreement between monkey and human data was that monkeys pointing movement displayed a double, instead a single velocity peak, as Georgopoulos et al (1981) found for re-directed movements. This observation probably reflected the variation of experimental conditions rather than a real difference between human and monkey (Roy et al., 2000).
Another relevant similarity between the two species involved the comparison of ipsilateral and contralateral movements. Human and monkey studies investigating reaching movements revealed asymmetry comparing different directions respect to the hand used: reaching durations towards contralateral target were significantly longer than towards ipsilateral or central ones and this effect is truly due to movement direction and not to different wrist distances (Roy et al., 2002). All these kinematic results revealed that the study of monkey’s reaching movements is a useful step to the understanding of visuo-motor control in human but few studies investigated kinematic visuo-motor properties of monkey’s reaching actions. Furthermore, most studies mentioned above involved planar, i.e. two-dimensional, reaching movements but the depth component of the three-dimensional reaching movements was less considered with the exception of few psychophysical works in humans.
1.8. Aim of the work
As previously reported, in humans, the role of the superior parietal lobule (SPL) in encoding depth and direction signals was demonstrated by studies describing patients with lesions in SPL that showed larger visuomotor deficits in depth than in direction (Baylis and Baylis, 2001; Danckert et al., 2009). The direction component has also been studied through electrophysiological analysis of macaque monkey parietal neurons, but the depth dimension and the interaction of the two variables were less considered. Most single-unit studies used center-out reaching tasks, with initial hand and target positions located on the same frontal plane (Andersen and Cui, 2009; Batista et al., 1999; Battaglia-Mayer et al., 2001; Buneo et al., 2002; Chang et al., 2009; Snyder et al., 1997). Fewer works employed body-out reaching movements, with the arm moving from a position near the trunk to targets located on a single plane (Fattori et al., 2001, 2005; Bosco et al., 2010), or at different depths (Bhattacharyya et al., 2009; Ferraina et al., 2009). However, these studies did not compare the effect of direction and depth signals on neural responses. This has been only reported by Lacquaniti et al. (1995) in area PE, where separate populations of neurons were found to encode the depth and the direction of reaching targets, as described in the previous paragraph. These results were in accordance with several psychophysical studies (Bagesteiro et al., 2006; Gordon et al., 1994; Sainburg et al., 2003; Vindras et al., 2005; Van Pelt and Medendorp, 2008), supporting that these two spatial variables are processed in separate networks (Crawford et al., 2011). To clarify how these variables are integrated, we want to investigate whether there is an encoding of both depth and direction information in single parietal neurons, and to compare depth and direction tuning during fixation, planning and reaching epochs.
We studied the above issues in the medial posterior parietal area V6A of macaques (Galletti, et al., 1999), where several types of neurons are involved in various phases of visually guided reaches (Fattori et al., 2005; Fattori et al., 2001). V6A contains neurons that encode the spatial location of visual targets (Galletti et al., 1993, 1995), neurons sensitive to the version and vergence angle of the eyes during fixation and saccades (Breveglieri et al., 2012; Galletti et al., 1995; Hadjidimitrakis et al., 2011), and cells whose activity is modulated by the arm reaching movement (Fattori et al., 2004; Fattori et al., 2001; Fattori et al., 2005) and arm spatial position (Breveglieri et al., 2002; Fattori et al., 2005).
Single cells were recorded while two Macaca fascicularis monkeys performed a fixation-to-reach task to foveated targets located at different depths and directions in three-dimensional (3D) space. We found that in a substantial percentage of V6A neurons depth and direction signals jointly influenced fixation, planning and arm movement-related activity in 3D space. While target depth and direction were equally encoded during fixation, depth tuning became stronger during arm movement planning, execution and target holding. The spatial tuning of fixation activity was often maintained across epochs, and the depth tuning was more maintained across the epochs. These findings support for the first time the existence of a common neural substrate for the encoding of target depth and direction during reaching movements in the posterior parietal cortex. Present results also highlight the presence in V6A of several subpopulations of cells that are recruited during the progress of a fixate-to-reach task in 3D space and process independently or jointly eye position and arm movement planning and execution signals in order to control reaches in 3D space.
To further investigate whether target depth and direction are processed commonly or independently and to study the spatial and temporal properties of monkey’s reaches, we collected and analyze the kinematic recordings of monkey arm movements.
The task employed in this study was aimed at moving the hand towards visual target located at different depths and directions but at the same elevation (at eye level). For the neural data, it has been demonstrated that depth and direction influence V6A neural responses during movement execution. It is possible that depth and direction influence also the metrics of the reach action and that this effect on the reach kinematic variables can account for the spatial tuning we found in V6A neural activity. For this reason, we recorded and analyzed behavioral data when the monkey performed reaching movements in 3-D space. We evaluated how the target spatial position, in particular target depth and target direction, affected the kinematic parameters and trajectories describing the motor action properties.
2. MATERIALS AND METHODS
The electrophysiological recordings and the neural data reported in this thesis have been the subject of a recent publication in which I am coauthor: Hadjidimitrakis et al., 2013. Experiments were performed following the national laws on care and use of laboratory animals and with the European Communities Council Directive of November 24, 1986 (86/609/EEC) and that of 22th September 2010 (2010/63/EU). All the experimental protocols were approved by the Bioethical Committee of the University of Bologna. During training and recording sessions, particular care was taken to avoid any behavioral and clinical sign of pain or distress.
2.1. Experimental and surgical procedures
The experiment was performed on two male macaque monkeys (Macaca fascicularis) weighing 4.4 Kg (Monkey A) and 3.8 Kg (Monkey B). Before recordings, monkeys were habituated to sit in a primate chair and to interact with the experimenters. Then, they were trained to perform the motor task described below using either hand (recordings were performed while the monkey used the hand contralateral to the recorded hemisphere). When the training was completed, a head-restraint system and the recording chamber were surgically implanted under general anesthesia (sodium thiopenthal, 8mg/kg*h, i.v.) following the procedures reported by Galletti et al. (1995). A full program of postoperative analgesia (ketorolac trometazyn, 1mg/kg i.m. immediately after surgery, and 1,6 mg/kg i.m. on the following days) and antibiotic care (Ritardomicina, benzatinic benzylpenicillin + dihydrostreptomycin + streptomycin, 1-1.4 ml/10kg every 5-6 days) followed surgery.
Extracellular recording techniques and procedures to reconstruct microelectrode penetrations were similar to those described in other reports (e.g. Galletti et al., 1996). Single cell activity was extracellularly recorded from the anterior bank of the parieto-occipital sulcus. Area V6A was initially recognized on functional grounds following the criteria described in Galletti et al. (1999), and later confirmed following the cytoarchitectonic criteria according to Luppino et al. (2005). We performed multiple electrode penetrations using a five-channel multielectrode recording system (5-channel MiniMatrix, Thomas Recording). The electrode signals were amplified (at a gain of
10,000) and filtered (bandpass between 0.5 and 5 kHz). Action potentials in each channel were isolated with a waveform discriminator (Multi Spike Detector; Alpha Omega Engineering) and were sampled at 100 kHz. The behavioural task and the stimulus presentation were controlled by custom-made software implemented in a Labview Realtime environment. Eye position was monitored through an infrared oculometer system (ISCAN) and was recorded at 500 Hz. Gaze direction was controlled by an electronic window (5 x 5 degrees) centred on the fixation target: this value conforms to other reaching studies (Batista and Andresen, 2001; Battaglia-Mayer et al., 2001, 2005; Marzocchi et al., 2008; Scherberger et al., 2003; Snyder et al., 2006). If the monkey fixated outside this window, the trial was aborted immediately.
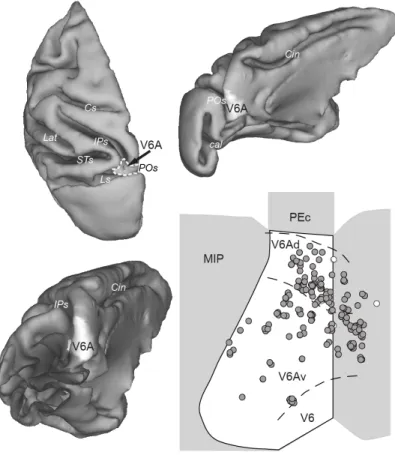
Histological reconstructions have been performed following the procedures detailed in a recent publication from our lab (Gamberini et al., 2011). Briefly, electrode tracks and the approximate location of each recording site were reconstructed on histological sections of the brain on the basis of electrolytic lesions and several other cues, such as the coordinates of penetrations within recording chamber, the kind of cortical areas passed through before reaching the region of interest, the depths of passage points between grey and white matter. All neurons of the present work were assigned to area V6A (Figure 6).
Figure 6.Anatomical location of V6A and of recording sites.
Top: The location of area V6A in the parieto-occipital sulcus (POs) is shown in dorsal (left) and medial (right) view of a hemisphere reconstructed in 3D using Caret software. Dashed contours (left) and white area (right) represent the borders and mesial extent, respectively, of V6A. Bottom-left: Posterior view of a reconstructed hemisphere with the occipital lobe removed to show the extent of V6A (white area). Bottom-right: Flattened map of area V6A showing the recording sites. Each circle represents a single site. White and grey circles represent sites where no modulated and at least one modulated neuron, respectively, was found. Cs, central sulcus; Cin, cinguate sulcus; Lat, lateral sulcus; STs, superior temporal sulcus; IPs, intraparietal sulcus; Ls, lunate sulcus; POs, parieto-occipital sulcus; Cal, calcarine sulcus; V6: area V6; V6Ad: dorsalV6A; V6Av:ventral V6A; MIP:medial intraparietal area; PEc: caudal area PE .
2.2. Reaching task
Electrophysiological signals were collected while monkeys were performing a body-out fixation-to-reach task specifically designed to study reach-related neural responses. The animals performed arm movement with the contralateral limb, with the head restrained, in darkness, while maintaining steady fixation of the target. Before starting the movement, the monkey had their arm on a button (home-button (HB), 2.5 cm in diameter) located outside the monkey’s visual field and next to its trunk (Figure 7A). Reaches were performed to one of nine Light Emitting Diodes (LED, 6 mm in diameter) positioned at eye level. The LEDs, mounted on the panel at different distances and directions with respect to the eyes always at eye level, were used as fixation targets and they were also mounted on microswitches embedded in the panel, so to be used as reaching buttons. As shown in the Figure 7B, target LEDs were arranged in three rows: one central, along the sagittal midline and two lateral, at version angles of -15° and +15°, respectively. Along each row, three LEDs were located at vergence angles of 17.1°, 11.4° and 6.9°. Given that the interocular distance for both animals was 30 mm, the nearest targets were located at 10 cm from the eyes, whereas the LEDs placed at intermediate and far positions were at a distance of 15 cm and 25 cm, respectively. The range of vergence angles was selected in order to include most of the peripersonal space in front of the animal, from the very near space (10 cm) up to the farthest distances reachable by the monkeys (25 cm). The monkeys were easily able to reach all the LEDs of the panel. The vectors between the starting position of the hand and the targets measure 24 centimeters for the nearest, 26 centimeters for the intermediate and 32 centimeters for the farthest positions.
The time sequence of the task with LED and arm status and the vergence and version angles of the eyes are shown in Figure 7C. A trial began when the monkey pressed the button near its chest (HB press). After pressing the button, the animal was waiting for instructions in complete darkness. It was free to look around and was not required to perform any eye or arm movement. After 1000 ms, one of the nine LEDs was switched on (LEDon). The monkey had to fixate the LED while keeping the HB button pressed. Then, the monkey had to wait for 1000–1500 ms for a change in the color of the LED (green to red) without performing any eye or arm movement. The color change was the go signal (GO) for the animal to release the HB and start an arm movement towards the target (M). Then, the monkey reached the target (H) and held its hand on the target for 800-1200 ms. The switching off of the target (Redoff) cued the monkey to release the LED and to return
to the HB (HB press), which ended the trial and allowed the monkey to receive its reward. Fixation had to remain stable on the target throughout the trial till the LED switched off, otherwise the trial was aborted and a new trial began without any reward. The correctness of reaching performance was evaluated by a software supervisor system (see Kutz et al., 2005), which checked the status of microswitches (monopolar microswitches, RS components, UK) mounted under the home-button and the LEDs-button presses/releases were checked with 1 ms resolution. The retinotopic coordinates of reaching targets remained constant throughout the task, whereas the direction of movement changed trial by trial according to target position. The task was performed in darkness, in blocks of ninety randomized trials, ten for each LED target. The luminance of LEDs was adjusted in order to compensate for difference in retinal size between LEDs located at different distances. The background light was switched on briefly between blocks to avoid dark adaptation.
At the beginning of each recording session, the monkeys were required to perform a calibration task where they fixated ten LEDs mounted on a frontal panel at a distance of 15 cm from the eyes. For each eye, signals to be used for calibration were extracted during fixation of five LEDs, one central aligned with the eye’s straight ahead position and four peripheral placed at an angle of +/- 15° (distance: 4 cm) both in the horizontal and vertical axes. From the two individual calibrated eye position signals we derived the mean of the two eyes (the conjugate or version signal), and the difference between the two eyes (the disconjugate or vergence signal) using the equations: version = (R+L)/2 and vergence = R-L, where R and L was the position of the right and left eye, respectively.
Figure 7. Experimental setup and task sequence
A, Scheme of the set up used for the reaching in depth task. Eye and hand movements
were performed in darkness towards one of the 9 LEDs located at eye level at different depths and directions.
B, Top view of the reaching in depth set up task indicating the vergence and version angle
of the targets with respect to the eyes.
C, Time sequence of task events with LED and arm status, the eye’s vergence and version
traces and the spike train of neural activity during a single trial. From left to right vertical continuous lines indicate: trial start (HB press), target appearance (LEDon), go signal (GO), start of the arm movement period (M), beginning of the holding the target period (H), switching off of the LED (Redoff), and trial end (HB press). Long vertical dashed line indicates the end of the saccade (left) and the start of the inward arm movement (right).
2.3. Kinematic recording
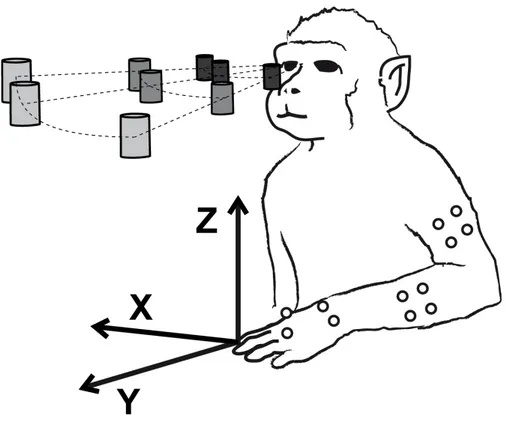
One monkey was employed in this study. The monkey performed the same task previously described. Arm movements were recorded with a Vicon three-dimensional motion analysis system with six infrared high-resolution cameras (Vicon Motion System Ltd., Oxford, UK) at a frequency of 60 Hz. Twelve infrared reflective markers were applied on several marker on the monkey’s limb: 4 in the upper part of the arm (UPPA 1-4), 4 in the forearm (FORA 1-1-4), 2 on the wrist (WIR 1 and 2), one in the back of the hand (HAND) and the last one in the thumb (THU), as shown in Figure 8. We recorded instantaneous 3-D spatial location in Cartesian coordinates x, y, z of each marker during the reaching movements toward the nine target positions. The orientations of the axes with respect to the animal are shown in Figure 9. The monkey used the right arm for half of the recordings and the left arm for the other half of recordings. Recording of movement trajectories and neural recordings were performed in separate sessions.
Figure 8. Schematic representation of the monkey’s right arm with the relative infrared reflective markers applied on the skin.
In this schematic view we indicated the marker code and numeration. The marker code is arbitrary defined and it is useful for the analysis that followed the recording sessions.
Figure 9. Cartesian coordinates x, y and z
X, y, z spatial coordinates relative to animal’s body indicating kinematic workspace. The origin of the three dimensions corresponds to the home button that the animal had to press.
2.4. Neural data analysis
The effect of different target positions on neural activity was analysed in different time periods during the task. The task epochs taken into account for the analysis are indicated in the bottom part of Figure 7C. They were: a) the early fixation epoch (FIX) from 50 ms after the end of the fixation-saccade till 450 ms after it, b) the preparation epoch (PLAN) was the last 500 ms of fixation before the GO signal, c) the reach epoch (REACH) from 200 ms before the start of the arm movement (M) till the end of it signalled by the pressing of the LED target (H) and d) the hold epoch (HOLD), from the pressing of the LED target (H) till the switching off of the target (Redoff) that was the Go signal for the monkey to start a return movement to press the HB. The HOLD epoch lasted either 800 or 1200 ms, depending on the trial. Rasters of spiking activity were aligned on specific events of the task sequence, depending on the epoch analyzed. Because the monkey was not required to gaze at the fixation point after the LED switch-off, the eye position was not necessary maintained still during backward reaching movement from the panel to the home-button. Therefore, we decided not to investigate the vergence and the version effect on the reaching activity during backward arm movements. The effect of target depth and direction on activity was analyzed only in those units with a mean firing rate higher than 3 spikes/s and in those neurons that were tested in at least seven trials for each spatial position. The reasons for this conservative choice are connected to the implicit high variability of biological responses and are explained in detail in Kutz et al. (2003).
Significant modulation of neural activity relative to different target locations was studied using a two-way Analysis of Variance (ANOVA) test performed separately for each epoch with factors being target’s depth and direction. The neural modulation relative to ANOVA’s factors was assessed when factor 1 and/or factor 2 and/or the interaction factor 1 x 2 were significant (p<0.05). Target depth was defined as the distance of the target from the animal (near, intermediate, far) and target direction was its position with respect to the recording hemisphere (contralateral, central, ipsilateral). To find whether the incidence of each of the main effects differed significantly between two epochs a two-proportion z test (Zar, 1999) was applied, as detailed in Fluet et al. (2010). To quantify the selectivity of neuronal activity in each epoch for depth and/or direction signals, we calculated an index termed eta squared (η2, (Zar, 1999)) using values obtained from the ANOVA test, and by applying the following formula: η2 = SSeffect/SStotal, where SSeffect is
each of the two main effects (i.e., depth and direction) and for each of the four epochs of interest. To compare the index of the same cell in different epochs, confidence intervals on the η2 indices were estimated using a bootstrap test. Synthetic response profiles were created by drawing N firing rates (with replacement) from the N repetitions of experimentally determined firing rates. The η2 was recomputed using these N firing rates.
Ten thousand iterations were performed, and confidence intervals were estimated as the range that delimited 95% of the computed indices (Batista et al., 2007).
To analyze the spatial tuning of activity, a stepwise multilinear regression model was applied in each epoch considered. Regression methods quantify relationship between dependent (neural activity) and independent (target depth and direction) variables. Given that the target was foveated in all epochs of interest, its depth and direction in space were represented in head-centered coordinates and were equal to the vergence and version angles of the eyes, respectively. We are aware that our experimental configuration cannot distinguish between eye- and head/body-centered frames of reference of target encoding. That being said, in the rest of the thesis, when we refer to spatial tuning analysis and data the terms depth and vergence, as well as direction and version are interchangeable.
In the multiple linear regression model relating the neural activity in the epochs of interest to the different target positions we used this equation for the firing rate:
A (Xi, Yi) = b0+b1Xi+b2Yi
where A was the neural activity in spikes per second for the ith trials; Xi, and Yi the
positions of the target defined as vergence and version angles, respectively, of the eyes during target fixation; b1 and b2 were regression coefficients and b0 the intercept. After
being tested for their significance, the vergence and version coefficients were normalized with the standard deviation of vergence and version, correspondingly. The standardized coefficients allow a comparison among the independent variables and provide information about its relative influence in the regression equation. In our study this allowed to compare the vergence and version coefficients and to account for the fact that angle range was different for vergence and version. The regression coefficients were selected using a backward stepwise algorithm (Matlab function stepwise) that determined whether the coefficients were significantly different from zero. At the conclusion of the stepwise algorithm, only the coefficients that were statistically significant from zero to p < 0.05
remained. These coefficients were then used to determine the spatial preference only in the cells with a significant main effect (ANOVA p<0.05) in a certain epoch. In modulated neurons without significant linear coefficients a Bonferroni post-hoc test (p<0.05) was applied to define the preferred position.
Population averaged spike density functions (SDF) were generated for the cells modulated by target depth/direction in the epochs of interest. In every cell, a SDF was calculated for each trial (Gaussian kernel, half width at half maximum 40 ms) and averaged across all the trials of the preferred and the opposite depths and directions as defined by the linear regression analysis. The peak discharge of the preferred condition was used to normalize the SDF. Population SDF curves representing the activity of the preferred and opposite condition were constructed by averaging the individual SDFs of the cells, aligned at the behavioral event of interest. In the cells with linear spatial tuning of movement activity (REACH) we calculated the response latency to movement execution for the preferred condition. The cell’s response latency was defined as the mean latency of the three target positions of the preferred condition (near/far, ipsi/contra). For each position, we quantified the firing activity in the epoch PLAN. To find the onset of the reach-related response, a sliding window (width=20 ms, shifted of 2 ms) was used to measure the activity starting from 200 ms before the movement start. The distributions of activities in the two windows across trials were compared with a Student’s t-test (p<0.05). The onset of the response was determined as the time of the first of five consecutive bins (10 ms) where comparisons were statistically significant (p<0.05). The above procedure, also used in a recent paper on V6A (Breveglieri et al., 2012), was adapted from an earlier work (Nakamura and Colby, 2000).
All analyses were performed using custom scripts written in MATLAB (Mathworks, Natick, MA, USA).
2.5. Kinematic data analysis
Data were analyzed off-line with a second-order Butterworth dual pass filter (low-pass cut-off frequency of 15Hz). In all the photograms of the recording video, each marker was classified with the relative label to allow the trajectory reconstruction and the calculation of the kinematic variables. Off-line analyses have been run by a Matlab program developed in our laboratory. For each marker, instantaneous velocity has been determined using a five-point central finite difference algorithm. Movement velocity has been used to determine the beginning (velocity above 30 mm/s) and the end (velocity below 30 mm/s) of each trial (Figure 10). The path curvature was calculated as the percentage increment of the length of the real trajectory traced by the wrist, between the onset and the termination times, with respect to the ideal straight path (Casadio et al., 2007). The ideal trajectory was represented by the distance between the initial and the final points of the real trajectory. We compared the movement curvatures performed with the right limb with those performed with the left limb using a t-test (p<0.05).
The kinematic parameters taken into account were: movement time (MT), mean velocity (MV), mean acceleration (MA), peak velocity (PV), peak acceleration (PA), peak deceleration (PD), mean percentage of the movement at the peak velocity (TPV), mean percentage of movement accelerating (TPA), mean percentage of the movement decelerating (TPD) (Figure 10). To highlight the similar and different timing modulation of proximal and distal arm segments, we grouped the markers in categories based on the temporal trend they showed reaching velocity, acceleration and deceleration peaks and their proximity to the body. All these variables were assessed for each individual movement, for each marker, as well as for each target position. In fewer cases, however, one or more markers were imperfect or not visible for a portion of movement (e.g. for light reflection) and the corresponding parameters were excluded from the following statistical analysis. Mean values for each dependent measure were calculated for the trial blocks and were analyzed performing two separate analysis of variance (one way ANOVA, p<0.05) using as independent variables the movement depth (near, intermediate or far) for the first ANOVA and the movement direction relative to the arm used (ipsilateral, central or contralateral) for the second ANOVA.
Figure 10. Kinematic parameters profiles
For each marker, velocity (red line) and acceleration (blue line) were calculated in order to determine the peak of velocity (PV), acceleration (PA) and deceleration (PD), as well as the relative times (TPV, TPA, TPD). Movement time (MT) corresponds to the time from movement onset (velocity above 30 mm/s) until the velocity dropped below 30 mm/s.
3. RESULTS
We recorded neuronal activity in V6A and identified 288 well isolated and stable cells in two monkeys (Monkey A: 192, Monkey B: 96). Animals were required to execute reaches to foveated targets located at different directions and depths. Targets’ elevation was kept constant at eye level. Figure 11 illustrates four examples of modulated neurons. All cells were tuned in several time epochs, both in depth and direction. The first neuron (Figure 11A) was modulated by target depth in all epochs and preferred intermediate to far positions. The cell was also tuned for target direction during both fixation and arm-movement planning, showing higher activity for contralateral positions. The second neuron (Figure 11B) responded strongly during all the epochs for targets located in the near space. In PLAN and REACH epochs, an additional preference for targets located in the contralateral space emerged. The third neuron (Figure 11C) was modulated by target direction in all epochs and preferred ipsilateral positions. In addition, it showed a preference for near space only during PLAN and REACH. Finally, the fourth cell (Figure 11D) was modulated by both depth and direction in the first two epochs, before arm movement execution, responding strongly for far positions and showed a small -though significant- preference for contralateral space. In REACH and HOLD epochs the effect of direction disappeared, while a strong depth tuning with a preference for targets located in near space emerged.
The examples in Figure 11 highlight the main characteristics of V6A cells during reaches in 3D space, i.e. the coexistence in single cells of modulations by both target direction and depth, and the fact that direction and depth can affect all epochs or be present only early or late in the task.
Figure 11. Example neurons with depth and direction tuning in several epochs.
A-D, Spike histograms and version and vergence eye traces for the nine target positions,
arranged at three directions (columns) and three depths (rows). Vertical bars indicate the alignment of activity and eye traces at the start of fixation and at the start of arm movement. Realignment is evidenced with a gap in histograms and eye traces.
A,B,D, Neurons showing depth tuning starting from fixation till the holding the target
period. Modulations by direction in A and D occurred quite early before- and disappeared during arm movement, whereas in B it occurred shortly before and was preserved during arm movement.
C, Neuron modulated by target direction from fixation till the holding of the target period
and by depth shortly before and during the arm movement: in both A and B, the neurons showed the same depth preference before and after the arm movement, whereas in D the preference was inverted.
3.1. Tuning for depth and direction in the different task phases
To quantify the effect of depth and direction a two way ANOVA was performed in each epoch. In total, 98% of the cells were modulated (p<0.05) by at least one of the two factors in at least one epoch (94% for depth and 86% for direction). As shown in Figure 12, during FIX similar numbers of cells were modulated by depth only, direction only and both signals. In the subsequent epochs, the percentage of cells modulated by depth only and by both signals slightly increased, whereas the incidence of tuning by direction only significantly decreased (two-proportion z-test, p<0.05). As shown in Table 1, in epochs PLAN, REACH, and HOLD the overall effect of target depth and direction were not equally represented, with the effect of depth being 10-20% more frequent than the effect of direction. In all epochs, a good percentage of neurons were jointly sensitive to both depth and direction signals, with more and more cells of this kind as the task progressed.
Figure 12. Incidence of depth and direction tuning in the population (N=288) of V6A neurons.
Percentage of neurons with tuning for depth only (pink), direction only (light blue), or both signals (violet) during several task epochs (fixation, planning, movement and holding, ANOVA, p<0.05).
EPOCH DEPTH DEPTH DIRECTION DIRECTION ANOVA ANOVA Regression ANOVA ANOVA Regression Linear Regression FIX 155/288 (53,8%) 133/155 (85,8%) 143/288 (49,6%) 110/143 (76,9%) PLAN 170/288 (59%) 141/170 (82,9%) 124/288 (43%) 100/124 (80,6%) REACH 182/288 (63,2%) 154/182 (84,6%) 146/288(50,7%) 115/146%(78,8%) HOLD 189/288 (65,6%) 159/189 (84,1%) 140/288(48,6%) 101/140 (72,1%)
To evaluate the time course of depth/direction selectivity in the different task epochs, we calculated the eta square index (η2) as detailed in the METHODS. The η2 index was used to measure the strength of the effect of the two factors on the firing rate. Figure 13A plots the average values of η2 for depth and direction in the neurons with a significant main effect of these variables in each epoch. The depth and direction selectivity were not significantly different during FIX (Student’s t-test p>0.05), whereas depth selectivity was significantly higher than direction selectivity in all the other epochs (Student’s t-test p<0.05).
Figure 13B illustrates the selectivity of depth and direction factors in single cells modulated in pairs of temporally adjacent epochs (FIX-PLAN, PLAN-REACH, REACH-HOLD). The η2 indices found in each epoch for depth (Figure 13B, top) and direction
(Figure 13B, bottom) were used to plot single points, which represent single cells. Filled circles represent neurons with a significantly different index between two adjacent epochs (bootstrap test, 10.000 iterations, p<0.05); empty circles indicate cells with similar selectivity (bootstrap test, 10.000 iterations, p>0.05). Figure 13B confirmed, at the single cell level, the results shown for the population of V6A neurons in Figure 13A, in that neurons were significantly more affected by depth as the task progressed, i.e. in PLAN versus FIX, in REACH versus PLAN, and in REACH versus HOLD, while direction selectivity did not significantly change in the different epochs.
Figure 13. Comparison of depth and direction selectivity across epochs in the population (N=288) of V6A neurons.
A, Time course of depth (pink) and direction (light blue) selectivity calculated as
mean±S.E. of the eta squared (η2) index for the population of neurons modulated in each epoch. Depth selectivity increased after the fixation epoch and reached a maximum at the movement epoch. Direction selectivity remained constant during task progress. Asterisks indicate a significant (Student’s t- test, p<0.05) difference between the average values of indices.
B, Scatter plots of η2 index in neurons modulated by depth (upper panels) and direction (lower panels) in pairs of adjacent epochs. Each point represents one neuron. Filled and empty circles indicate cells with η2 index that was significantly different (bootstrap test, 10.000 iterations, p<0.05) or not, respectively, between two adjacent epochs. In single neurons depth selectivity was enhanced during the REACH epoch.
3.2. Spatial tuning in different task phases
To quantify the spatial tuning of the neurons a linear regression analysis was performed with target depth and direction as independent variables. Since the target to be reached out was always foveated, the depth and direction in space of the target could be defined in head/body-centered coordinates, i.e. with the vergence and version angles, respectively, of the eyes. The linear regression model was used because we observed that few neurons displayed their maximal firing rates for intermediate and central positions and these positions were the least preferred in our population (10% of cells, Bonferroni post-hoc). As shown in Table 1, most of the neurons that were significantly modulated by target depth and direction (ANOVA, p<0.05) had discharges that were linearly correlated (p<0.05) with vergence and version angles, respectively. In each neuron, the sign of the linear correlation coefficients (standarized) were used to determine the spatial preference in a certain epoch. Neurons with significant linear vergence tuning were classified as near or far, whereas cells linearly tuned by version angle were classified as contralateral or ipsilateral, depending on the sign of the linear version coefficient and the recording hemisphere.
The percentage of cells falling into the above groups in each epoch is illustrated in Figure 14. Neurons tuned for “far” reachable space were found to be more than those tuned for “near” reachable space (Figure 14, top). The difference was statistically significant in all epochs apart from REACH (χ2, p<0.05 in FIX, PLAN and HOLD). Regarding the directional tuning (Figure 14, middle), contralateral neurons were more numerous than ipsilateral ones in all epochs, but the difference was never statistically significant (χ2, p>0.05). The bottom part of Figure 14 shows that near and far cells were similarly tuned for contralateral and ipsilateral space (two-way χ2, p>0.05). In summary, the analysis of the spatial tuning showed that the distributions of spatial preference within the reachable space tested were quite similar across epochs.
Figure 14. Spatial tuning in single epochs
Top: Percentage of neurons linearly modulated by depth that preferred far (dark pink) and near (light pink) space in each epoch. Middle: Percentage of the neurons linearly modulated by direction that preferred contralateral (medium blue) and ipsilateral (light blue) space in each epoch. Bottom: Percentage of the neurons belonging to combination of classes in cells linearly modulated by both depth and direction. Asterisks indicate a statistically significant (χ2, p<0.05) spatial preference.