Journal of the European Economic Association
Copy of e-mail Notification zwu000236
Your article (# 000236) from "Journal of the European Economic Association" is available for download
=====
Dear Author,
Your article page proofs for Journal of the European Economic Association are ready for review. The MIT
Press Journals has made this article available to you online for faster, more efficient editing. Please follow
the instructions below and you will be able to access a PDF version of your article as well as relevant
accompanying paperwork.
First, make sure you have a copy of Adobe Acrobat Reader software to read these files. This is free
software and is available for user downloading at
http://www.adobe.com/products/acrobat/readstep.html.
Open your web browser, and enter the following web address:
http://rapidproof.cadmus.com/RapidProof/retrieval/index.jsp
You will be prompted to log in, and asked for a password. Your login name will be your email address, and
your password will be
----Example:
Login: your email address
Password:
----The site contains one file, containing:
- Author Instructions Letter
- Offprint Order Form
- A copy of your page proofs for your article
Please print out these page proofs and mark on the hard copy any changes that need to be made for
accuracy and consistency. Changes must be limited to those necessary to correct errors. Please mark any
corrections in colored pen or pencil. Changes resulting in re-pagination of the issue cannot be accepted.
Please do not send a revision of your article. To save time and moeny, you may email changes to
[email protected].
In order for your changes to be incorporated it is essential that your corrected proofs are received by the
MIT Press NO LATER THAN 3 DAYS from the day you received them.
Please mail your page proofs via an overnight mail service to:
Karie Kirkpatrick
Journals Production Coordinator
MIT Press Journals
5 Cambridge Center
Cambridge, MA 02142
Lead authors will receive 25 free offprints. Prior to publication of the issue, you may purchase additional offprints in increments of 50 or 100, at the prices listed below. All orders must be prepaid, and payment may be made only in the following forms: a check drawn on a U.S. bank, an international money order, VISA, MasterCard, or American Express (no other credit cards can
be accepted). The MIT Press cannot guarantee that late orders will be placed; to ensure production of your offprints, this form and
payment must be returned within 5 days of receipt to:
MIT Press Journals
Attn: Billing Department, Dorota Rola
5 Cambridge Center, Fourth Floor Cambridge, MA 02142-1493
FAX: 617-258-5028
Please print or type, and fill out all items completely.
1) Your name _________________________________________________________________
Article name ________________________________________________________________
2) How many copies do you want? (Number must be a multiple of 50 or 100.) _______________ 3) Total number of pages in article: _________ .
4) Please refer to the price chart below to calculate the cost of your order. The prices in the columns "50 offprints" and "100
offprints" include startup costs, so use only one of them. For example, 200 offprints of a 22-page article would cost $210.00 ($152.00 for the first 100, plus $58.00 for an additional 100). 150 offprints of the same article would cost $181.00 ($123.00 for 50, plus $58.00 for an additional 100).
For articles over 32 pages, please add the page price to the price for the number of pages over 32 (i.e., for 38 pages, add the 32-page price and the 6-32-page price).
(use only one of these) pages in article 50 offprints 100 offprints add'l 100s 1-4 $ 54.00 $ 60.00 $ 12.00 5-8 $ 68.00 $ 79.00 $ 21.00 9-12 $ 83.00 $ 99.00 $ 33.00 13-16 $ 96.00 $116.00 $ 40.00 17-20 $110.00 $135.00 $ 50.00 21-24 $123.00 $152.00 $ 58.00 25-28 $138.00 $173.00 $ 70.00
29-32 $151.00 $190.00 $ 77.00 Total cost of offprint pages: $________ Canadian orders please add 7% GST: $________
TOTAL: $________ PAYMENT (please print or type):
Amount of check enclosed: _____________ made payable to The MIT Press. VISA # ___________________________________________________ MasterCard # ______________________________________________ American Express # _________________________________________
Expiration date: ________________________ Signature: _________________________________________________________
. . . . . . . . . . . . . . . . . . . . . . . . . . . . . . . . . . . . . . . . . .
THE LENGTH OF WORKING LIVES IN
EUROPE
Agar Brugiavini
University of Venice
Franco Peracchi
Tor Vergata University
Abstract
In this paper we ask what is the length of working life in Europe, whether it differs by gender, birth cohort, and schooling level, and what are the main differences across countries. We also ask whether there is a trend towards shorter working lives, and to what extent it is due to the delayed entry into the labor force or earlier withdrawal from the labor force. (JEL: I21, J11, J22, J26)
Several studies have documented the trend towards a declining age of exit from the labor force in developed countries, and particularly in Europe, during the last few decades (see, for example, the studies in Gruber and Wise 1999, 2004). Less attention has been paid to the trend towards a delayed entry into the labor market. Together, these two trends imply a sharp decline in the length of working life.
Shorter working lives may have several consequences. First, they may imply lower pension benefits at retirement. This is most clearly seen in pension systems based on defined benefits formulae, where the pension that people receive at retirement is typically proportional to the length of their contributive period. Although the latter need not coincide with the length of a working life, there is a close relationship between the two concepts. Second, shorter working lives may imply insufficient assent accumulation relative to the anticipated length of time spent in retirement. Third, people (and society) may not get the full benefits of schooling and other human capital investments (such as health improvements). Fourth, people spend more years in retirement as a result of both the increase in longevity and the trend towards earlier retirement. Further, most of these years appear to be years of healthy life (Lee 2003).
Despite it intuitive appeal, due to its apparent similarity to the concept of life length, the length of working life is in fact an elusive concept. Further, its empirical analysis is complicated by the lack of representative samples of life histories.
Acknowledgments: We thank Richard Blundell, Graziella Caselli, Luigi Guiso, Ron Lee, and Paolo Sestito for helpful comments. Lorenzo Agnoletto provided valuable research assistance.
E-mail addresses: Brugiavini: [email protected]; Peracchi: [email protected]
Journal of the European Economic Association April–May 2005 3(2–3):1–10 © 2005 by the European Economic Association
. . . . . . . . . . . . . . . . . . . . . . . . . . . . . . . . . . . . . . . . . .
Given the difficulties of building working-life tables from cross-sectional data (see Wolfbein 1949), in this paper we follow the alternative approach of measuring the length of working life from retrospective survey information. Available microlevel data enables us to look at trends in the length of working lives in Europe for the cohorts born between 1915 and 1935. We use these data to address two issues:
1. What is the length of working life in Europe? How does it differ by gen-der, birth cohort, and schooling level? What are the main differences across countries?
2. Is there a trend towards shorter working lives? If there is such a trend, to what extent is it due to the following sources: (i) delayed entry into the labor force, and (ii) earlier withdrawal from the labor force?
An important question that we do not address here is whether there are also differences across countries and birth cohorts in hours worked over the life cycle. The remainder of the paper is organized as follows. Section 1 presents the data that we use. Section 2 describes trends in life expectancy. Section 3 describes trends in labor force participation. Section 4 exploits the retrospective information in the ECHP to construct measures of the length to working life. Finally, Section 5 offers some conclusions.
1. The Data
We use two sources of data: life expectancy data from Eurostat’s Demographic Statistics, and microlevel data from the European Community Household Panel (ECHP).
Life expectancy data are based on cross-sectional age profiles of mortality rates. Because of this, they do not represent a forecast of life length of people currently of a given age. They would forecast a person’s residual life length only if mortality rates would remain fixed at their current level.
The ECHP is an annual longitudinal household survey, carried out between 1994 and 2001 in all 15 countries of the European Union (EU) under the close coordination of Eurostat. The survey provides extensive socio-demographic and economic information, at both the household and the personal level (see Peracchi 2002), and ensures a good level of comparability across countries and over time. The size of the national samples ranges from a minimum of about 7,000 individ-uals in Denmark to a maximum of about 21,000 individindivid-uals in Italy and Spain. We use the 2003 User Data Base (2003 UDB), corresponding to the years from 1994 to 2000. To maximize comparability over time, for Germany, Luxembourg, and the UK we disregard the original three waves of the ECHP, and use instead the ECHP comparable data derived from the existing national panels.
. . . . . . . . . . . . . . . . . . . . . . . . . . . . . . . . . . . . . . . . . .
Brugiavini and Peracchi Length of European Working Lives 3
A A B B DK DK E E EU15 EU15 F F FIN FIN GR GR I I IRL IRL L L NL NL P P S S UK UK 4 6 8 0 1 2 1 4 1 i Df fe r n ec e 9 10 6-0 0 21 60 65 70 75
Life expectancy at birth in 1960
Men Women
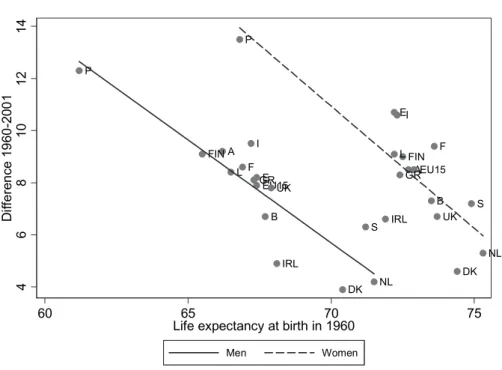
Figure1. Life expectancy at birth in 1960 and changes in life expectancy at birth between 1960 and 2001.
2. Life Expectancy
Figure 1 Figure 1 plots life expectancy at birth in 1960 against changes in life expectancy
at birth between 1960 and 2001. For both men and women, life expectancy at birth increased by 5 to 10 years in most countries, and by more than 12 years in Portugal. There is clear evidence of cross-country convergence, as life expectancy increased more in countries where it was initially lower, and less in countries where it was initially higher. As for life expectancy at age 60, the picture is qualitatively very similar. Life expectancy increased in all countries, in most of them by 2 to 4 years, again with clear evidence of convergence.
The increase in life expectancy over the last 40 years mainly reflects a drop in mortality for working age and elderly people. For people of working age, the drop in mortality is largely due to reductions in chronic and degenerative diseases, such as heart disease and cancer (see, e.g., Riley 2001). Dupré et al. (2004) present a detailed analysis of mortality profiles in the European regions (at the NUTS-2 level) by age group during the period 1994–1996. They show that deaths before the age of 65 account for one-third of overall mortality, with death rates twice as high among men. Violent deaths (mainly traffic accidents, acci-dental falls, and suicide) and deaths related to alcohol consumption and smoking
. . . . . . . . . . . . . . . . . . . . . . . . . . . . . . . . . . . . . . . . . .
(bronchopulmonary cancers, diseases of the respiratory tract, alcohol-induced cirrhoses, etc.) dominate premature mortality, especially among men.
On average across the EU, life expectancy at birth in 1999 is 75 years for men and 81 years for women, whereas residual life expectancy at age 60 is 19 years for men and 24 years for women. Despite the convergence process during the past 40 years, cross-country variation remain large. For example, there is a difference of nearly 5 years between Sweden and Portugal in male life expectancy at birth, and of 3.5 years between France and Ireland in female life expectancy at age 60.
3. Labor Force Participation
A key aspect in measuring the length of working life in Europe is the fact that mortality rates for people of working age have become so small that, to a first approximation, they can be neglected. As a result, changes in working life length are almost entirely driven changes in the life-cycle profile of labor force partici-pation.
In a standard life-cycle model, an increase in longevity at older ages should lead to postponing retirement, an effect akin to a change in the rate of impatience. On the basis of this argument, we should observe longer working lives (although this conclusion may not hold if changes in longevity are unexpected). In fact, what we observe in most European countries is a trend towards lower labor force participation at the beginning and at the end of a working life for both men and women, partly offset by a trend towards increasing female labor force participation in the central age groups.
Increases in educational attainments are one of the main reasons for delayed entry into the labor force. Despite the difficulties arising when comparing educa-tional levels, both across countries and over time, the long-run trends are fairly clear. Educational attainments have risen through time in all European countries, more rapidly for women than for men, and there is clear evidence of convergence of schooling attainments of men and women.
We do not analyze in detail the economic forces that lie behind these trends. The increase in income levels is clearly relevant, as well as the increase in longevity, which makes it possible to reap the benefits of human capital invest-ments for a longer period and with less uncertainty. For the most recent cohorts, an additional explanation may be the rise of educational wage premia, documented for most European countries over the last two decades (see Harmon, Walker, and Westergaard-Nielsen 2001). Less clear is the effect of prohibition on child labor, increases in mandatory schooling, and various education policies (literacy campaigns, educational radio, etc.).
Exit from the labor force is affected, among other things, by the rules govern-ing disability and old-age pensions. Eligibility, benefit calculation, and indexation
. . . . . . . . . . . . . . . . . . . . . . . . . . . . . . . . . . . . . . . . . .
Brugiavini and Peracchi Length of European Working Lives 5
of benefits play a key role in explaining differences across countries. In the Nordic countries, a large percentage of women declare to be retired or unemployed at relatively young ages. Austria, Italy, and Portugal have a high percentage of early retired women, while in the Netherlands many women report themselves as unem-ployed. In all countries, a large fraction of women report to be out of the labor force for other reasons (such as looking after family). For men, the retirement route out of the labor force is predominant in Greece, Italy, and Portugal. In Spain and the Netherlands, a striking number of men ages 50–59 report them-selves as inactive (a broad category that also includes invalidity and disability), while in the Nordic countries there is a nonnegligible fraction of unemployed or inactive men. Overall, the available evidence points to a variety of pathways to retirement in the different countries. Particularly for the 50–59 age group, unemployment/disability programs may in fact be regarded as a form of early retirement. This evidence suggests that institutional features might be shaping retirement decisions in terms of both the timing of retirement and the pathways followed in collecting benefits.
4. Exploiting the Retrospective Information in the ECHP
An interesting feature of the ECPH is that it contains retrospective information on past labor force behavior. We use the information contained in the following ECHP variables to compute the age of entry into and exit from the labor force: (a) PE039: “How old were you when you began your working life, that is, started
your first job or business?”
(b) PJ001: Person has worked (15+ hours per week) before. (c) PJ002: Year stopped working in last job
In general, this retrospective information appears to be consistent across waves and with the longitudinal information on changes in self-reported activity status. Unfortunately, no retrospective information is available for Sweden, whereas for Luxembourg only the information on PE039 is available.
For those who are currently retired from the labor force but worked before, we define the length of the working life as the difference between the age when they stopped working in their last job and the age when they began their working life. For those who are currently in the labor force (either employed or unemployed), working lives are not yet completed and we can only measure their elapsed length as the difference between their current age and the age when they began their working life. In other words, for those currently in the labor force, the length of the working life is unobservable and all we have available is a right censored version of it. To limit the impact of censoring, we study the length of working life of the cohorts born between 1915 and 1935. By 2000, the last available year in our data, all their members were 65+ and most of them had already left the
. . . . . . . . . . . . . . . . . . . . . . . . . . . . . . . . . . . . . . . . . . 5 1 0 2 5 2 5 1 0 2 5 2 5 1 0 2 5 2 5 1 0 2 5 2 20 40 60 20 40 60
Austria Belgium Denmark Finland
France Germany Greece Ireland
Italy Luxembourg Netherlands Portugal
Spain UK Men Women Me i dn aa g e Birth year
Figure2. Median age of entry into the labor force by sex and birth cohort.
labor force. To further reduce the risk of biases, we focus on median rather than mean values.
Figure 2
Figure 2 shows the median age of entry into the labor force of the cohorts born between 1915 and 1970, separately by country (Sweden excluded) and sex. For both men and women, there is a long-run trend towards delayed entry into the labor force. The rise of schooling levels, however, is not the fully story. For example, the sharp increase in the age of entry for German men born between 1920 and 1930 reflects the labor market consequences of World War II. More importantly, the available data reveal an increase in the median age of entry for each schooling level (detailed tabulations are available upon request). This effect appears to be particularly strong for the post-1950 cohorts, as a result of the youth unemployment problems experienced by these cohorts.
Figure 3
Figure 3 shows instead the median age of exit from the labor force for the cohorts born between 1915 and 1935, separately by country (Luxembourg and Sweden excluded) and sex. For both men and women, the median age of exit dropped from over 65 years of age to about 60 years in all countries. Remarkably, the cross-country variance in the age of exit is lower for the later cohorts. Figure 4
Figure 4 shows the median length of a working life, defined as the median difference between the age of exit and the age of entry into the labor force, for the cohorts born between 1915 and 1935, separately by country (Luxembourg
. . . . . . . . . . . . . . . . . . . . . . . . . . . . . . . . . . . . . . . . . .
Brugiavini and Peracchi Length of European Working Lives 7
0 5 0 6 0 7 0 5 0 6 0 7 0 5 0 6 0 7 0 5 0 6 0 7 15 25 35
Austria Belgium Denmark Finland
France Germany Greece Ireland
Italy Netherlands Portugal Spain
UK Men Women Me i dn aa ge Birth year
Figure3. Median age of exit from the labor force by sex and birth cohort.
0 4 0 5 0 6 0 4 0 5 0 6 0 4 0 5 0 6 0 4 0 5 0 6 15 25 35
Austria Belgium Denmark Finland
France Germany Greece Ireland
Italy Netherlands Portugal Spain
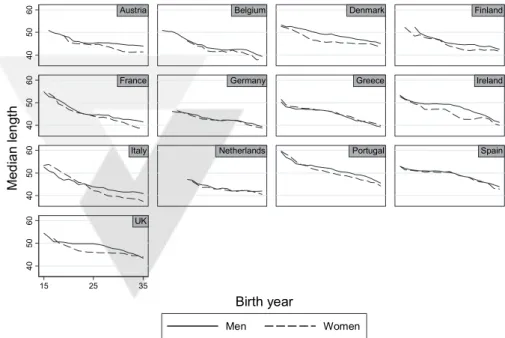
UK Men Women Me i dn al e g nh t Birth year
. . . . . . . . . . . . . . . . . . . . . . . . . . . . . . . . . . . . . . . . . .
and Sweden excluded) and sex. For both men and women, the median length of a working life dropped from over 50 years to less than 45 in all countries.
We summarize the empirical evidence on cross-country differences and trends by estimating linear median regression models for the age of entry into the labor force, the age of exit from the labor force, and the length of working life. The predictors in each model include a constant, a linear cohort trend (byr), dummies for tertiary and secondary education completed and not having a spouse, and a set of country dummies fully interacted with the linear cohort trend. We allow for different cohort trends across countries but, for parsimony, we force the effects of education and marital status to be the same across countries. The models for the age of entry into the labor force are estimated from the sample people born between 1915 and 1970, whereas the models for the age of exit from the labor force and the length of working life are estimated from the sample of people born between 1915 and 1935. For each model, the intercept corresponds to an Italian, born in 1935, married, with secondary education not completed. Table 1 reports Table 1
the estimated coefficients.
Our estimates show that there are only minor differences between men and women in the median age of entry into the labor force. On the other hand, people with completed secondary education tend to enter the labor force about two years later than people with less schooling. The delay increases to about five years for people with tertiary education. The baseline median age of entry varies consid-erably across countries and bears no clear relationship with the country-specific upper age limited of compulsory education for the cohort born in 1935. This sug-gests that cross-sectional differences partly reflect differences in what is meant by “starting your first job or business.” In all countries except Austria, however, there is a clear trend towards delayed entry, stronger in France, Netherlands, Portugal, and Spain.
Turning to the age of exit from the labor force, the median is usually lower for women than for men. Our estimates show that educational effects are not very strong: people with completed secondary education tend to leave at about the same age as those with less schooling, while those with tertiary education tend to leave only about one year later. Cross-country variation in the age of exit is not as large as in the age of entry. Relative to the Italian baseline, the median age of exit is about two years lower for Belgian and French men, and more than two years higher for Portuguese men. For women, the median age of exit is lowest in Austria, France, and Italy (about 55 years for the baseline case), and highest in Greece and Spain (about 60 years). All countries show a trend towards early exit. The trend is roughly similar in most countries, especially among men, the main exceptions being Austria, Denmark, Netherlands, and the UK where the trend is significantly weaker.
The median length of working life is always shorter for women than for men (by more than three years in Italy!). It is less than two years shorter for people with completed secondary education relative to those with less schooling. This
. . . . . . . . . . . . . . . . . . . . . . . . . . . . . . . . . . . . . . . . . .
Brugiavini and Peracchi Length of European Working Lives 9
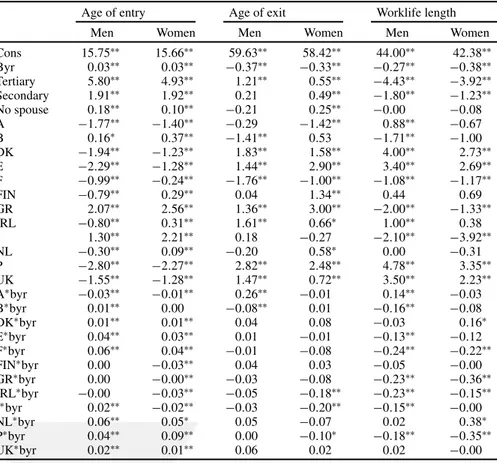
Table1. Estimated coefficients of linear median regression models for age of entry and exit
into the labor force and worklife length (∗∗and∗, respectively, denote an observed
significance level below 5% and between 5 and 10%).
Age of entry Age of exit Worklife length Men Women Men Women Men Women Cons 15.75∗∗ 15.66∗∗ 59.63∗∗ 58.42∗∗ 44.00∗∗ 42.38∗∗ Byr 0.03∗∗ 0.03∗∗ −0.37∗∗ −0.33∗∗ −0.27∗∗ −0.38∗∗ Tertiary 5.80∗∗ 4.93∗∗ 1.21∗∗ 0.55∗∗ −4.43∗∗ −3.92∗∗ Secondary 1.91∗∗ 1.92∗∗ 0.21 0.49∗∗ −1.80∗∗ −1.23∗∗ No spouse 0.18∗∗ 0.10∗∗ −0.21 0.25∗∗ −0.00 −0.08 A −1.77∗∗ −1.40∗∗ −0.29 −1.42∗∗ 0.88∗∗ −0.67 B 0.16∗ 0.37∗∗ −1.41∗∗ 0.53 −1.71∗∗ −1.00 DK −1.94∗∗ −1.23∗∗ 1.83∗∗ 1.58∗∗ 4.00∗∗ 2.73∗∗ E −2.29∗∗ −1.28∗∗ 1.44∗∗ 2.90∗∗ 3.40∗∗ 2.69∗∗ F −0.99∗∗ −0.24∗∗ −1.76∗∗ −1.00∗∗ −1.08∗∗ −1.17∗∗ FIN −0.79∗∗ 0.29∗∗ 0.04 1.34∗∗ 0.44 0.69 GR 2.07∗∗ 2.56∗∗ 1.36∗∗ 3.00∗∗ −2.00∗∗ −1.33∗∗ IRL −0.80∗∗ 0.31∗∗ 1.61∗∗ 0.66∗ 1.00∗∗ 0.38 I 1.30∗∗ 2.21∗∗ 0.18 −0.27 −2.10∗∗ −3.92∗∗ NL −0.30∗∗ 0.09∗∗ −0.20 0.58∗ 0.00 −0.31 P −2.80∗∗ −2.27∗∗ 2.82∗∗ 2.48∗∗ 4.78∗∗ 3.35∗∗ UK −1.55∗∗ −1.28∗∗ 1.47∗∗ 0.72∗∗ 3.50∗∗ 2.23∗∗ A∗byr −0.03∗∗ −0.01∗∗ 0.26∗∗ −0.01 0.14∗∗ −0.03 B∗byr 0.01∗∗ 0.00 −0.08∗∗ 0.01 −0.16∗∗ −0.08 DK∗byr 0.01∗∗ 0.01∗∗ 0.04 0.08 −0.03 0.16∗ E∗byr 0.04∗∗ 0.03∗∗ 0.01 −0.01 −0.13∗∗ −0.12 F∗byr 0.06∗∗ 0.04∗∗ −0.01 −0.08 −0.24∗∗ −0.22∗∗ FIN∗byr 0.00 −0.03∗∗ 0.04 0.03 −0.05 −0.00 GR∗byr 0.00 −0.00∗∗ −0.03 −0.08 −0.23∗∗ −0.36∗∗ IRL∗byr −0.00 −0.03∗∗ −0.05 −0.18∗∗ −0.23∗∗ −0.15∗∗ I∗byr 0.02∗∗ −0.02∗∗ −0.03 −0.20∗∗ −0.15∗∗ −0.00 NL∗byr 0.06∗∗ 0.05∗ 0.05 −0.07 0.02 0.38∗ P∗byr 0.04∗∗ 0.09∗∗ 0.00 −0.10∗ −0.18∗∗ −0.35∗∗ UK∗byr 0.02∗∗ 0.01∗∗ 0.06 0.02 0.02 −0.00
difference increases to about four years for people with tertiary education. The median length of working life varies significantly across countries. For men, it is shortest in Belgium, France, Greece, and Italy (about 40 years for the baseline case) and longest in Denmark, Portugal, and the UK (about 46 years). For women, the outliers are Italy (36 years) and Denmark (nearly 44 years), which are also the countries were gender-related differences in the pension system are, respectively, largest and smallest. Finally, in all countries except the Netherlands, there is a clear trend towards shorter work lives, the trend being stronger in France, Greece, and Portugal.
5. Conclusions
Working lives in Europe tend to be shorter for women and for people with higher education. They have also become shorter and shorter in all European countries,
. . . . . . . . . . . . . . . . . . . . . . . . . . . . . . . . . . . . . . . . . .
both in absolute and in relative terms (i.e., relative to life expectancy at birth). Delayed entry into the labor force (because of increased schooling attainments and youth unemployment) and earlier withdrawal from the labor force contributed to the trend. The relative importance of the two factors differs across countries.
Although we do not provide details on the role played by the institutional features of each country, our results throw some light on the importance of policies affecting the timing and the modes of schooling, in addition to the timing and the modes of retirement. Cohort differences in the age of entry into the labor market are clearly related to the completion of compulsory education and, more recently, to the attainment of higher schooling levels. In turn, higher schooling levels imply higher levels of human capital, higher earnings and, possibly, higher growth rates of aggregate income. Unfortunately, most public pension systems in Europe combine benefit calculations based on the length of a working life with rules that discourage work after age 65. In addition, incentives to retire early remain widespread in Europe, either directly through the rules governing old-age retirement or indirectly through the existence of alternative exit routes (disability and unemployment). All this tends to lower the returns (for an individual and the society) of human capital investments.
This conclusion adds a further argument in favor of reducing incentives to early retirement and eliminating rules that discourage people from working past the age of 65.
References
Dupré, Didier, Elodia Niederlaender, Eric Jougla, and Gérard Salem (2004). “Mortality in the EU 1997–1999.” Statistics in Focus. Theme 3 (Population and Social Conditions), 2A/2004, Eurostat.
Gruber, Jonathan and David Wise (1999). Social Security and Retirement Around the World. University of Chicago Press.
Gruber, Jonathan and David Wise (2004). Social Security Programs and Retirement around the World: Micro-Estimation. University of Chicago Press.
Harmon, Colm, Ian Walker, and Niels Westergaard-Nielsen (2001). Education and Earnings in Europe. A Cross-Country Analysis of the Returns to Education. Elgar, Cheltenham, UK. Lee, Ronald (2003). “The Demographic Transition: Three Centuries of Fundamental Change.”
Journal of Economic Perspectives, 17, 167–190.
Peracchi, Franco (2002). “The European Community Household Panel: A Review.” Empirical Economics, 27, 63–90.
Riley, James (2001). Rising Life Expectancy: A Global History. Cambridge University Press. Wolfbein, Seymour (1949). “The Length of Working Life.” Population Studies, 3, 286–294.