Scuola Dottorale in Ingegneria /
Ph.D. School of Engineering
Sezione di Scienze dell’Ingegneria Civile /
Section of Civil Engineering
XXIII Ciclo / XXIII Cycle
Tesi di Dottorato / Doctoral Thesis
Load-carrying capability and seismic
assessment of masonry bridges
Dottorando / Ph.D. Student: Stefano De Santis
Docente guida / Tutor: Prof. Gianmarco de Felice
Coordinatore del dottorato / Ph.D. Coordinator: Prof. Leopoldo Franco
Collana delle tesi di Dottorato di Ricerca in Scienze dell’Ingegneria Civile
Università degli Studi Roma Tre Tesi n° 27
Abstract
The present work contributes to the knowledge of the structural behaviour of masonry bridges and proposes a modelling approach for their assessment under exercise loads and seismic actions. As a first step, an experimental investigation on brickwork specimens is carried out to define the material properties; the tests are performed under cyclic centred and eccentric compression with displacement control. Secondly, a fiber beam model is used to simulate eccentric compression experiments: the fiber constitutive relation is determined and calibrated according to centred tests and the feasibility in predicting the cross-section response of brick arches and piers under axial load and bending moment is demonstrated. The simplicity of a 1-D model, combined with its accuracy in taking into account the mechanical properties of the material, makes it suitable for the structural analysis of masonry bridges. Then, a representative sample of existing large-span rail viaducts is considered, for which the load-carrying capability under travelling load is estimated. Numerical simulations highlight the effect of the constitutive assumptions on the overall resistance estimate and the reliability of yield design-based approaches; the safety level and expected damage under exercise load are also provided. Finally, the dynamic behaviour of masonry bridges is examined starting from the response of a single arch to base impulse acceleration and earthquake motion, considering the influence of arch geometry and material properties. The safety of a multi-span viaduct towards different earthquake scenarios is then assessed by means of push-over analyses and non-linear dynamic simulations under sets of suitable natural accelerograms. The reliability of earthquake engineering conventional procedures, based on non-linear static methods, is evaluated when applied to masonry bridges and a framework for performance-based seismic assessment is outlined.
Keywords: Experimental investigation; Historic brickwork; Masonry bridges; Load-carrying capability; Seismic assessment.
Sommario
Il lavoro fornisce un contributo alla conoscenza dei ponti in muratura, per i quali viene sviluppato un approccio per la valutazione della sicurezza rispetto ai carichi di esercizio e all’azione sismica. In prima battuta vengono determinate le caratteristiche della muratura attraverso una campagna sperimentale con prove cicliche di compressione, condotte con carico centrato ed eccentrico in controllo di spostamento. Le prove di pressoflessione sono poi simulate utilizzando un modello di trave con sezione a fibre, da adottare per la rappresentazione del comportamento di archi e pile, in cui la relazione costitutiva della fibra è calibrata sulla base delle prove centrate. Il confronto con la sperimentazione dimostra l’attendibilità dell’approccio proposto e, d’altra parte, la semplicità di un modello monodimensionale, unita alla sua accuratezza nel tenere conto delle proprietà meccaniche del materiale, lo rende adatto per l’analisi strutturale dei ponti in muratura. Successivamente, viene preso in esame un insieme di dodici viadotti ferroviari esistenti di grande luce, per i quali si valuta la capacità portante al variare delle ipotesi costitutive adottate, verificando l’attendibilità di approcci basati sull’analisi limite e stimando il livello di sicurezza e di sollecitazione in condizioni di esercizio. Infine, viene analizzato il comportamento dinamico dei ponti in muratura studiando innanzitutto la risposta di un singolo arco ad azioni impulsive e sismiche e valutando successivamente il comportaemento sismico di ponti a più arcate attraverso analisi di push-over e analisi dinamiche non lineari con accelerogrammi naturali. Il confronto tra le diverse simulazioni per un caso di studio consente di mettere a fuoco alcune problematiche legate all’applicazione ai ponti in muratura delle metodologie attualmente impiegate per la verifica delle costruzioni in zona sismica basate su metodi statici non lineari e di evidenziare i criteri di base per l’impostazione di una procedura di valutazione della sicurezza nei confronti del terremoto su base prestazionale. Parole chiave: Indagine sperimentale; Muratura storica; Ponti in muratura;
Contents
List of Figures... xi
List of Tables ... xxi
List of Symbols ... xxiii
1. Introduction ... 27
1.1. Motivation and aims ... 27
1.2. Organization of the Thesis ... 29
2. Experimental investigation on historic brickwork ... 32
2.1. State-of-the-art... 32
2.2. Experimental set-up ... 35
2.3. Masonry components ... 36
2.3.1. Bricks ... 37
2.3.2. Mortar ... 42
2.4. Experimental plan for brickwork ... 48
2.5. Brickwork under uniform compression ... 49
2.5.1. Head-joint effect ... 55
2.5.2. Strength and stiffness estimate through simple analytical models ... 56
2.6. Brickwork under compression and bending ... 58
2.6.1. Testing set-up for eccentric axial load tests ... 59
2.6.2. Experimental results ... 63
2.6.3. Crack pattern evolution ... 70
2.6.4. Maximum load estimate ... 74
2.6.5. Behaviour after several load cycles ... 75
2.6.6. Cross-section behaviour ... 79
3. Modelling brickwork elements through fiber beams ... 83
3.1.1. Beam element formulation ... 83
3.1.2. State determination process ... 86
3.2. Macroscopic constitutive relations ... 99
3.2.1. Monotonic behaviour... 99
3.2.2. Proposed cyclic constitutive relation without strength degradation ... 101
3.2.3. Proposed cyclic constitutive relation with strength degradation ... 104
3.3. Simulation of eccentric compression tests ... 107
3.3.1. Failure criterion ... 109
3.3.2. Overall monotonic response curve ... 110
3.3.3. Cyclic behaviour ... 115
4. Load-carrying capability of masonry bridges... 116
4.1. State-of-the-art ... 116
4.2. Modelling masonry bridges by means of fiber beam elements ... 122
4.3. Comparison with experimental results ... 126
4.4. Load-carrying capability of Ronciglione Viaduct ... 132
4.4.1. Description of the bridge ... 132
4.4.2. Fiber beam-based modelling and comparison with limit analysis ... 137
4.4.3. Load-carrying capability ... 139
4.5. Load-carrying capability of Cervo River Bridge... 148
4.5.1. Description of the bridge ... 148
4.5.2. Load-carrying capability ... 152
4.5.3. Safety assessment under rail traffic loads ... 157
4.6. Safety assessment of different typologies of Italian large-span rail bridges ... 161
5. Seismic assessment of masonry bridges ... 173
5.1. State-of-the-art ... 173
5.2. Collapse of masonry arches under pulse base acceleration ... 175
5.2.1. Displacement and velocity analyses on four-bar linkage mechanisms... 176
5.2.2. Solution provided by the mechanism method ... 179
5.2.3. Numerical simulation through fiber beams ... 185
5.2.4. Effect of material properties ... 190
5.3. Behaviour of masonry arches under earthquake motion ... 192
5.4. Seismic analysis of masonry bridges ... 200
5.4.1. Damages induced by seismic events... 200
5.4.2. Limit states and seismic analysis methods ... 202
5.5. Seismic response of masonry bridges: a case study ... 212
5.5.1. Dynamic characterization ... 212
5.5.2. Push-over analyses ... 220
5.5.3. Non-linear incremental dynamic analyses (IDA) under natural accelerograms... 223
5.5.4. Seismic assessment by means of N2 Method ... 235
5.6. Towards a performance-based seismic assessment ... 240
6. Conclusions and future developments ... 243
6.1. Conclusions ... 243
6.2. Future developments ... 245
List of Figures
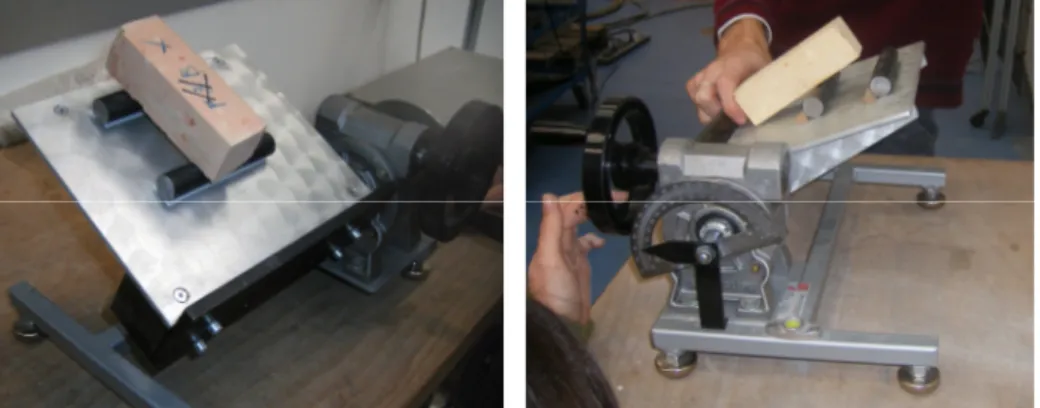
Figure 2.1. MTS testing machine (left) and detail of the oil control device (right, up) and of the data acquisition device (right, bottom). ... 36 Figure 2.2. Cutting machine (right) and grinding machine (left). ... 37 Figure 2.3. Experimental stress-strain curves of monotonic (left) and cyclic
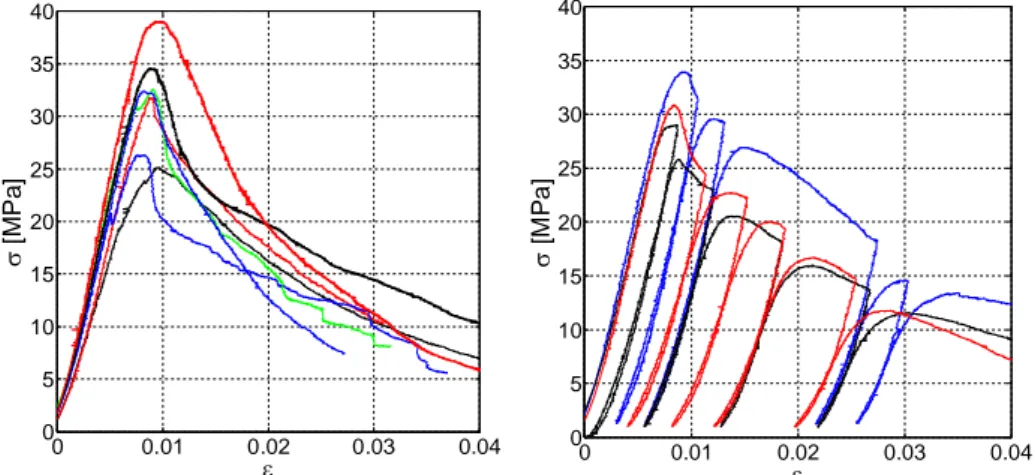
(right) compression tests on original brick cubic samples belonging to the masonry arch bridges of Rome-Viterbo rail line. ... 38 Figure 2.4. Experimental stress-strain curves of monotonic (left) and cyclic
(right) compression tests on historic brick cubic samples (bricks manifactured in Monterotondo clink)... 38 Figure 2.5. Failure pattern of an cubic brick sample during a compression
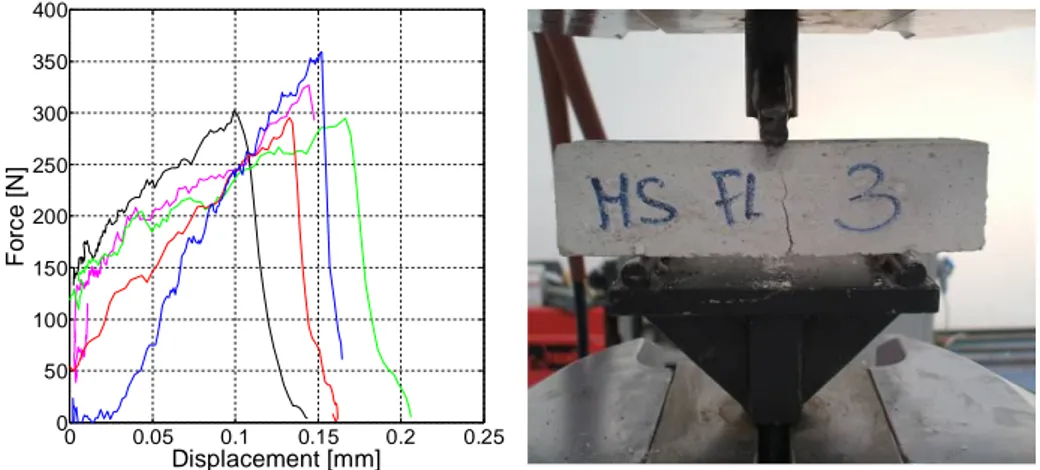
test... 39 Figure 2.6. Testing device for three-point bending test. ... 40 Figure 2.7. Three-point bending test on brick specimens: force-displacement
response curves (left) and sample after the end of the test (right). ... 40 Figure 2.8. Elastic FE analysis of a brick sample under a three-point bending
test: horizontal stresses indentifying the strut&tie mechanism. ... 41 Figure 2.9. Additional bending moment due to specimen-steel bar friction in
three-point bending test. ... 41 Figure 2.10. Experimental tests on reclining table, before (left) and after
(right) the sliding onset. ... 42 Figure 2.11. Extracted mortar sample (up, left) and enlargements of its bright
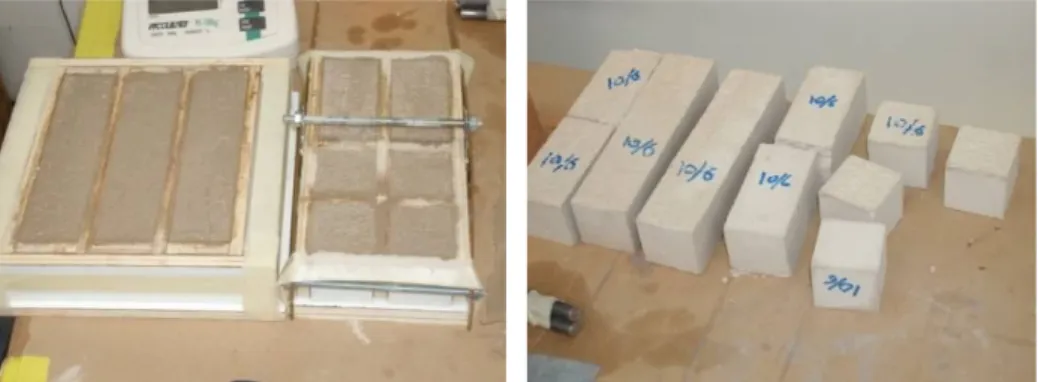
section: 40× (up, right) and 100× (bottom). ... 43 Figure 2.12. Cubic and prismatic mortar specimens before and after the
extraction from the formworks. ... 44 Figure 2.13. Experimental stress-strain curves of compression tests on cubic
(left) and prismatic (right) mortar specimens (blue curves: slenderness ratio H/L=2; red curves: H/L=4). ... 45 Figure 2.14. Crack pattern in a compression test on a cubic sample. ... 45 Figure 2.15. Crack pattern in a compression test on prismatic sample
(slenderness ratio H/L=2). ... 46 Figure 2.16. Crack pattern in a compression tests on a prismatic sample
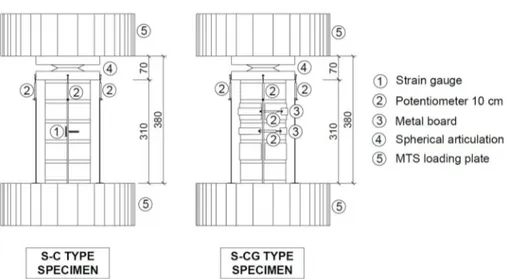
Figure 2.17. Three-point bending test on mortar specimens: force-displacement response curves (left) and a sample immediatelty before the collapse (right). ... 47 Figure 2.18. Schematic illustration of masonry specimen types and
experimental set-up for centered and eccentric compression tests. ... 48 Figure 2.19. Schematic illustration of the equipment for centered
compression tests on brickwork. ... 50 Figure 2.20. Equipment for centered compression tests on brickwork:
strain-gauges and spherical articulation (left) and position transducers (right). ... 50 Figure 2.21. Experimental response curves of cyclic axial compression tests
on S-C (left) and SC-G (right) type specimens. ... 51 Figure 2.22. Brick stress-strain curve obtained from data acquired by the
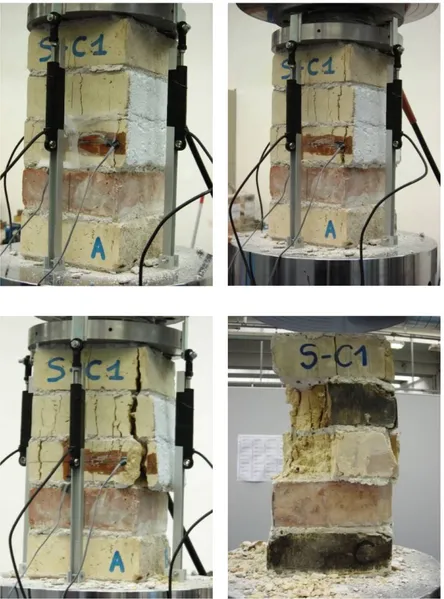
vertical strain-gauge during centered axial load test on S-C1 specimen. ... 52 Figure 2.23. Failure pattern of historic brick masonry under centered
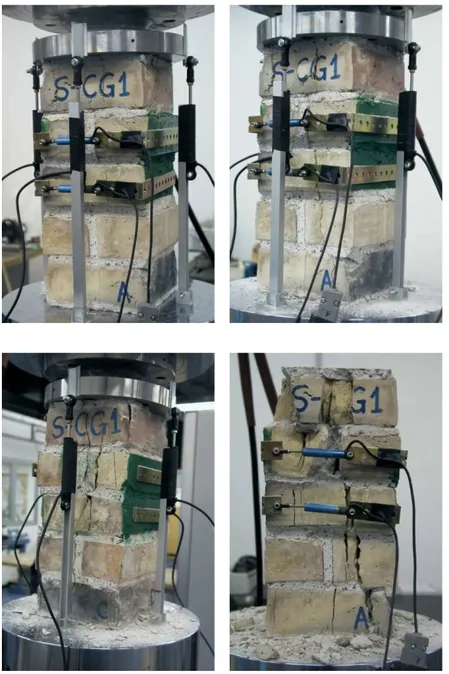
compression: S-C specimens. ... 53 Figure 2.24. Failure pattern of historic brick masonry under centered
compression: S-CG specimens. ... 54 Figure 2.25. FE analysis results: contour plot of horizontal tensile stresses at
failure in S-C (left, resultant load 142 kN) and S-CG (right, resultant load 76kN) specimens. ... 56 Figure 2.26. Identification of the equivalent mortar joint height in S-CG
specimen for the analytical estimate of the ultimate load. ... 57 Figure 2.27. Brick arrangement of the vault of a masonry arch bridge (left)
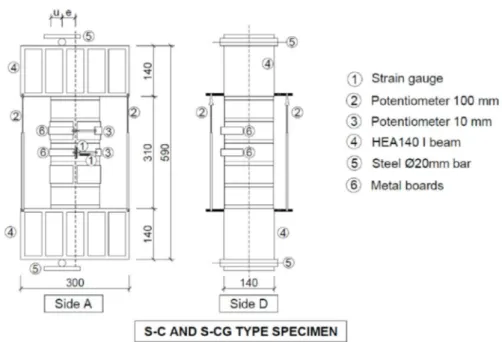
and schematic illustration of the texture (right). ... 59 Figure 2.28. Schematic illustration of the equipment for eccentric axial load
tests on S-C and S-CG brickwork specimens. ... 60 Figure 2.29. Schematic illustration of the equipment for eccentric axial load
tests on S-E5 brickwork specimens. ... 60 Figure 2.30. Schematic illustration of the equipment for eccentric axial load
tests on S-E9 brickwork specimens. ... 61 Figure 2.31. Specimen preparation: detail of the =4mm threaded steel bars
(left) and positioning in the drill holes through bi-component resin. ... 62 Figure 2.32. HEA-140 I-beam steel bar (left) and 20 steel bar (right) used
for eccentric axial load tests on SE-9 brickwork specimens. ... 62 Figure 2.33. Test set-up for monitoring the cross-section deformation during
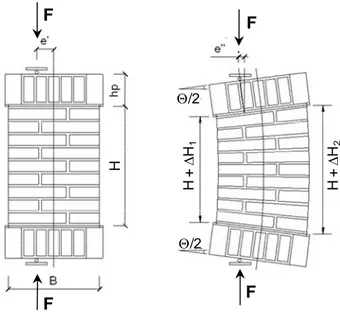
eccentric axial load tests on S-E9 specimens. ... 63 Figure 2.34. Schematic illustration of brickwork specimen in its initial and
deformed configurations. ... 65 Figure 2.35. Experimental results of eccentric (e=30mm) axial load tests on
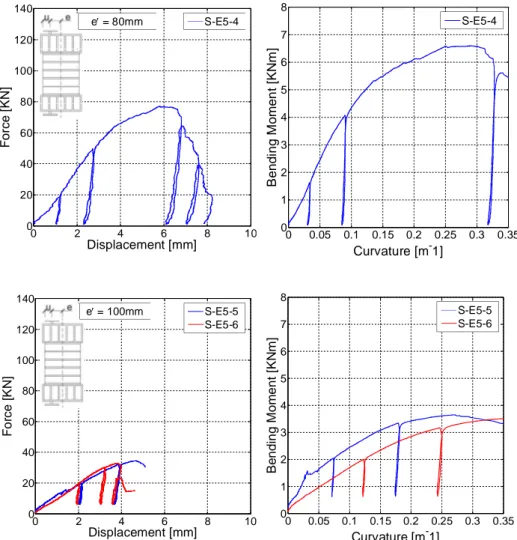
S-C (up) and S-CG (down) masonry specimens. ... 66 Figure 2.36. Experimental results of eccentric axial load tests on S-E5
Figure 2.38. Experimental results of eccentric axial load tests on S-E9
masonry specimens for different eccentricities (e=70mm, 110mm). ... 69
Figure 2.39. Crack pattern evolution of eccentric axial load test on S-C2 brickwork specimen: deformed configuration (up) and detail of the cracks in the compressed edge (down, left side) and of the opening of the bed joint (down, right side). ... 71
Figure 2.40. Crack pattern evolution of eccentric axial load test on S-E5-4 brickwork specimen. ... 72
Figure 2.41. Crack pattern evolution of eccentric axial load test on S-E9-4 brickwork specimen. ... 73
Figure 2.42. Maximum load (F0) vs. distance to the compressive edge (u). ... 74
Figure 2.43. Stress block depth (y*) vs. neutral axis depth (yc). ... 75
Figure 2.44. Detail of the experimental F- response curve of S-E9 type specimens for the eccentricity values e=70mm (specimen S-E9-4, left) and e=110mm (specimen S-E9-3, right)... 76
Figure 2.45. Interpolation through damage function of experimental force values at the beginning of unloading phases for specimen S-E9-4 (e=70mm). ... 77
Figure 2.46. Interpolation through damage function of experimental force values at the beginning of unloading phases for specimen S-E9-3 (e=110mm). ... 78
Figure 2.47. Stability curves for S-E9 specimens, for different eccentricity values: e=70mm (Specimen S-E9-4, left) and e=110mm (S-E3-4, right). ... 79
Figure 2.48. Cross-section local (left) and intermediate (right) deformation of a brickwork specimen under eccentric loading at different displacement steps: =0.25125 (F0); e=70mm. ... 80
Figure 2.49. Cross-section local (left) and intermediate (right) deformation of a brickwork specimen under eccentric loading at different displacement steps: =0.25125 (F0); e=110mm. ... 81
Figure 3.1. Graph of the element state determination. ... 88
Figure 3.2. Flow chart of the structure state determination. ... 92
Figure 3.3. Flow chart of the element state determination. ... 93
Figure 3.4. Flow chart of the section state determination. ... 95
Figure 3.5. Graph of the section state determination. ... 96
Figure 3.6. Equilibrium of frame element in the deformed configuration and its projection on the undeformed configuration (plane case). ... 97
Figure 3.7. Modified Kent and Park model (1982) for monotonic compression. ... 100
Figure 3.8. Experimental stress-strain curves for S-C (left) and S-CG (right) type specimens under centered compression and Kent and Park relations. ... 101
Figure 3.9. Unloading-reloading branches in Masonry01 constitutive model. ... 102 Figure 3.10. Experimental stress-strain curve of S-C specimen under cyclic
centered compression, Masonry01 and Concrete02 constitutive models. ... 103 Figure 3.11. Unloading-reloading branches in Masonry02 constitutive model. ... 106 Figure 3.12. Masonry02 constitutive relation: unloading-reloading branches
for different values of b2 (left) and dh (right). ... 106
Figure 3.13. Experimental stress-strain curve of S-C specimen under cyclic centered compression and Masonry02 constitutive model... 107 Figure 3.14. Schematic illustration of brickwork specimen and of the fiber
beam model in the initial and deformed configurations... 108 Figure 3.15. Strength domains of brickwork under eccentric loading
according to the numerical model and corresponding experimental data. ... 109 Figure 3.16. Experimental results (solid blue lines) and fiber beam model
simulation (dotted red line) of eccentric (e'=30mm) axial load tests on S-C (left) and S-S-CG (right) masonry specimens. ... 111 Figure 3.17. Experimental results (solid blue lines) and fiber beam model
simulation (dotted red line) of eccentric axial load tests on S-E5 masonry specimens: e'=40mm (left) and e'=60mm (right)... 112 Figure 3.18. Experimental results (solid blue lines) and fiber beam model
simulation (dotted red line) of eccentric axial load tests on S-E5 masonry specimens: e'=80mm (left) and e'=100mm (right). ... 113 Figure 3.19. Experimental results (solid blue lines) and fiber beam model
simulation (dotted red line) of eccentric axial load tests on S-E9 masonry specimens: e'=70mm (left) and e'=110mm (right). ... 114 Figure 3.20. Experimental result (solid blue line) and fiber beam model
simulation (dotted red line) of a cyclic eccentric axial load tests on a masonry specimen (e'=60mm; specimen type: S-E5). ... 115 Figure 4.1. Mery’s Method for the design of an arch (From Jorini, 1918). ... 120 Figure 4.2. Empirical relations for the dimensioning of the structural
elements of a bridge (From Ferrovie dello Stato, 1907). ... 121 Figure 4.3. Structural elements of a masonry bridge modelled through 1-D
finite elements. ... 123 Figure 4.4. Sensitivity analyses on a beam under uniform bending moment
(up) and on a single arch under vertical load concentrated in the crown section (down), for the identification of the adequate number of beam elements (left side graphs) and of fibers in the cross-section (right side graphs), considering an elastic-no tensile resistant material (ENT, blue curves) and Masonry01 constitutive law (red curves). ... 125 Figure 4.5. Diffusion of the load from the trampling level to the arch extrados
and identification of the loaded nodes. ... 126 Figure 4.6. Bolton Institute experimental model. ... 127 Figure 4.7. Geometry of the bridge (distances in millimeters). ... 128
Figure 4.9. Comparison between numerical and experimental results: load vs. crown displacement curve (left) and load vs. pier displacement curves
(right). ... 130
Figure 4.10. Failure mode: comparison between experimental (up) and numerical (down) models. Roman numbers represent the sequence of developing of plastic hinges; force values indicate the corresponding applied load. ... 130
Figure 4.11. Undeformed and deformed beam element. ... 131
Figure 4.12. Curvature of the beam elements in the numerical model for the identification of the plastic hinges and comparison with the experimental failure mode... 131
Figure 4.13. Position of Ronciglione Viaduct in the Italian Rail Network. ... 132
Figure 4.14. Ronciglione Viaduct. ... 133
Figure 4.15. Ronciglione viaduct: longitudinal view (distances in meters). ... 133
Figure 4.16. Vaults and spandrel walls (left) and detail of brick arrangement in the arches (right). ... 134
Figure 4.17. Ordinary piers and piers with buttresses... 135
Figure 4.18. Original drawings from (Società italiana per le strade ferrate del Mediterraneo, 1894): transversal sections at the first (left) and at the central (right) span of Ronciglione Viaduct. ... 136
Figure 4.19. Original drawing from (Società italiana per le strade ferrate del Mediterraneo, 1894): bridge under construction. ... 137
Figure 4.20. Constitutive relations adopted for load-carrying capability analyses on Ronciglione Viaduct: ENT (a), EP (b), Masonry01 (c). ... 138
Figure 4.21. Load-carrying capability: comparison between fiber beam model and limit analysis. ... 138
Figure 4.22. Collapse mechanism: comparison between fiber beam model and limit analysis. ... 139
Figure 4.23. Collapse mechanism: curvature of the fiber beam elements and identification of the plastic hinges. ... 139
Figure 4.24. Load-carrying capability of Ronciglione Viaduct under concentrated travelling load for different material constitutive laws. ... 140
Figure 4.25. Effect of post peak behaviour; load-carrying capability curves of the central span (left) and ultimate resistance vs. =cu/c0 (right)... 141
Figure 4.26. Load-displacement response for different material behaviour. ... 142
Figure 4.27. Load-carrying capability of Ronciglione Viaduct under concentrated travelling load and rail traffic load. ... 143
Figure 4.28. Collapse configuration under rail traffic load and monitored cross-sections... 143
Figure 4.29. Stress field in the cross-section at the crown (up) and at the springers (down) of the central span, under self-weight only, rail load and ultimate load. ... 144 Figure 4.30. Stress field in the cross-section at the top (up) and base (down)
of the third (left) and fourth (right) piers, under self-weight only, rail load and ultimate load. ... 145 Figure 4.31. Stress field in the cross-section at the springer (up) and crown
(down) of the third (left) and fifth (right) spans under self-weight only, rail load and ultimate load. ... 146 Figure 4.32. Position of Cervo River Bridge in the Italian Rail Network. ... 148 Figure 4.33. Altimetric outline of the first part of Santhià-Arona rail line,
with the identification of Cervo River Bridge at km 12+500, from (Società italiana per le strade ferrate del Mediterraneo, 1906). ... 149 Figure 4.34. Original drawing from (Società italiana per le strade ferrate del
Mediterraneo, 1906): longitudinal and upper view of Cervo River Bridge. ... 149 Figure 4.35. Original drawing from (Società italiana per le strade ferrate del
Mediterraneo, 1906): Cervo River Bridge under construction. ... 150 Figure 4.36. Longitudinal view of Cervo River Bridge (distances in meters). ... 151 Figure 4.37. Original drawing from (Società italiana per le strade ferrate del
Mediterraneo, 1906): transversal section in correspondence of the crown of the first span. ... 151 Figure 4.38. Original drawing from (Società italiana per le strade ferrate del
Mediterraneo, 1906): transversal section in correspondence of the crown of the central span. ... 152 Figure 4.39. Load-carrying capability of Cervo River Bridge under
concentrated travelling load for different material constitutive laws. ... 153 Figure 4.40. Load-carrying capability of Cervo River Bridge under
concentrated travelling load (dotted line) and rail traffic load (solid line). ... 154 Figure 4.41. Figure 4.28. Collapse configuration under rail traffic load and
monitored cross-sections. ... 155 Figure 4.42. Stress field in the cross-section at the crown (up) and at the
springers (down) of the central span, under self-weight only, rail load and ultimate load. ... 155 Figure 4.43. Stress field in the cross-section at the top (up) and base (down)
of the first (left) and second (right) piers, under self-weight only, rail load and ultimate load. ... 156 Figure 4.44. Stress field in the cross-section at the springing (up) and crown
(down) of the first (left) and third (right) spans, under self-weight only, rail load and ultimate load. ... 157 Figure 4.45. LM71 rail traffic load as it is defined by the Italian Code. ... 158 Figure 4.46. Rail traffic load: loading conditions. ... 159
#2: blue lines: loading condition #3). ... 160
Figure 4.48. Collapse configurations corresponding to different loading conditions. ... 160
Figure 4.49. Longitudinal view, cross-section and upper view of Agira River Bridge. ... 162
Figure 4.50. Longitudinal and upper views of Avella Bridge. ... 162
Figure 4.51. Longitudinal view of Cairasca Bridge... 162
Figure 4.52. Longitudinal and upper views of Calore River Viaduct. ... 163
Figure 4.53. Longitudinal and upper views of Chiaravagna Bridge. ... 163
Figure 4.54. Longitudinal view of Diveria Bridge. ... 163
Figure 4.55. Longitudinal view of Goriano Sicoli Viaduct. ... 164
Figure 4.56. Longitudinal view of Mergozzo Bridge. ... 164
Figure 4.57. Longitudinal view of Rovisondoli Viaduct. ... 164
Figure 4.58. San Polo Bridge: details of the arch and of the foundations. ... 165
Figure 4.59. Position of the surveyed bridges on the Italian territory. ... 166
Figure 4.60. Comparison between empirical rules (single relations and envelope) and survey data in terms of span (S) vs. crown thickness-to-span ratio (s/S) for deep arches (left) and shallow arches (right). ... 167
Figure 4.61. Comparison between empirical rules (single relations and envelope) and survey data in terms of span (S) (left) and vault thickness (s) (right) vs. pier top thickness (P). ... 167
Figure 4.62. Ultimate load (QU): comparison between fiber beam model and limit analysis approach with EP constitutive law (left) and comparison between different material relations: ENT, EP, Masonry01 (right). ... 169
Figure 4.63. Safety factor with EP and Masonry01 constitutive laws: dependence on span (a), vault thickness (b), rise-to-span ratio (c) and thickness-to-span ratio (d). ... 170
Figure 4.64. Safety factor: comparison Masonry 01 and ENT and EP constitutive laws in dependence on rise-to-span ratio (left) and thickness-to-span ratio (right). ... 171
Figure 4.65. Safety factor for EP and Masonry01 constitutive laws and failure modes: dependence on number of spans (left) and maximum pier height (right). ... 171
Figure 5.1. The four-bar linkage. ... 176
Figure 5.2. The circular arch as a four-bar linkage mechanism in its initial and deformed configurations. ... 179
Figure 5.3. Potential energy variation for a circular arch having =157.5° R=10m and s/R=0.15. ... 180
Figure 5.4. Failure domain under impulse base motion for a circular arch having =157.5° R=10m and s/R=0.15. ... 184
Figure 5.5. Fiber beam model results for an arch having R=10m, s/R=0.15, =157.5° under impulse base motion with =0.60 sec: collapse configuration (a), driver link rotation (b) and horizontal displacement of the key node (d) for different values of base acceleration, elements
curvature identifying the position of the plastic hinges (c). ... 186
Figure 5.6. Fiber beam model results for an arch having R=10m, s/R=0.15, =157.5° under impulse base motion with a=0.75g and =0.60 sec: stress field in the hinge sections. ... 187
Figure 5.7. Failure domain under impulse base motion different size (R) for arches having s/R=0.15and =157.5°: comparison between mechanism method (MM) and fiber beam model (FBM). ... 188
Figure 5.8. Failure domain under impulse base motion different aspect ratios s/R ratios for arches having R=10m and =157.5°: comparison between mechanism method (MM) and fiber beam model (FBM). ... 189
Figure 5.9. Position of the plastic hinges and non-recovery rotations for different s/R ratios. ... 189
Figure 5.10. Potential energy for arches having =157.5° and different aspect ratios s/R. ... 190
Figure 5.11. Failure domain under impulse base motion of and arch with R=10m, s/R=0.15, =157.5°, considering different materials: Elastic-no tensile resistant (ENT), Elastic perfectly plastic (EP), Masonry01. ... 191
Figure 5.12. Modal analysis: first ten modal shapes. ... 192
Figure 5.13. Load distributions for push-over analyses. ... 194
Figure 5.14. Push-over curves for different load distributions. ... 195
Figure 5.15. Signals used for non-linear dynamic analyses on the single masonry arch. ... 196
Figure 5.16. Comparison between push-over and non-linear dynamic analyses under accelerogram #1: response curves of two dynamic simulations with different scaling factors (up) and maximum conditions for all the adopted scaling factor (down). ... 197
Figure 5.17. Comparison between push-over and non-linear dynamic analyses under accelerogram #1: response curves of two dynamic simulations with different scaling factors (up) and maximum conditions for all the adopted scaling factor (down). ... 198
Figure 5.18. Maximum displacement in non-linear dynamic analyses: sensitivity to the radius R. ... 199
Figure 5.19. Maximum displacement in non-linear dynamic analyses: sensitivity to the aspect (span-to-radius) ratio s/R. ... 200
Figure 5.20. Model of Ronciglione Viaduct with brick elements. ... 213
Figure 5.21. Modal shape #1: comparison between models with brick elements and fiber beams... 214
Figure 5.22. Modal shape #2: comparison between models with brick elements and fiber beams... 214
Figure 5.24. Modal shape #4: comparison between models with brick elements and fiber beams. ... 215 Figure 5.25. Modal shape #5: comparison between models with brick
elements and fiber beams. ... 216 Figure 5.26. Modal shape #6: comparison between models with brick
elements and fiber beams. ... 216 Figure 5.27. Modal shape #7: comparison between models with brick
elements and fiber beams. ... 217 Figure 5.28. Modal shape #8: comparison between models with brick
elements and fiber beams. ... 217 Figure 5.29. Modal shape #9: comparison between models with brick
elements and fiber beams. ... 217 Figure 5.30. Modal shape #10: comparison between models with brick
elements and fiber beams. ... 218 Figure 5.31. Fiber beam model: detail of the representation of fill soil. ... 219 Figure 5.32. Fiber beam model: detail of the representation of backfill and
spandrel walls by means of non-linear truss elements... 219 Figure 5.33. Capacity curves corresponding to different load distributions for
in-plane push-over analyses... 221 Figure 5.34. Capacity curves corresponding to different load distributions for
out-of-plane push-over analyses. ... 222 Figure 5.35. Sensitivity analyses in the transversal plane under load
distribution #2: dependence of the capacity curve on the compressive strength (left) and on the ductility (right) of the material. ... 223 Figure 5.36. Elastic response spectrum of the horizontal component of the
acceleration for ULS and DLS limit states provided by the code (Nuove norme tecniche per le costruzioni, 2008) for Ronciglione Viaduct site. ... 224 Figure 5.37. Scaled signals used for Incremental Dynamic Analysis on
Ronciglione Viaduct under Ultimate Limit State (ULS) conditions. ... 226 Figure 5.38. Scaled signals used for Incremental Dynamic Analysis on
Ronciglione Viaduct under Damage Limit State (DLS) conditions. ... 227 Figure 5.39. Acceleration response spectra of the selected signals, average
spectrum and target spectrum for Ultimate Limit State (ULS) conditions. ... 228 Figure 5.40. Acceleration response spectra of the selected signals, average
spectrum and target spectrum for Damage Limit State (DLS) conditions. ... 228 Figure 5.41. Rayleigh damping and Fourier spectrum of accelerogram #2, Y
component, ULS conditions, and of the structural response (horizontal acceleration of the control node under out-of-plane analysis). ... 229 Figure 5.42. IDA curve and capacity curves for in-plane analyses and ULS
Figure 5.43. IDA curve and capacity curves for in-plane analyses and DLS conditions. ... 231 Figure 5.44. IDA curve and capacity curves for out-of-plane analyses and
ULS conditions. ... 232 Figure 5.45. IDA curve and capacity curves for out-of-plane analyses and
DLS conditions. ... 232 Figure 5.46. Comparison between push-over and non-linear dynamic
analyses in longitudinal direction (accelerogram #3, X component). ... 233 Figure 5.47. Comparison between push-over and non-linear dynamic
analyses in transversal direction (accelerogram #1, X component). ... 233 Figure 5.48. Displacement vs. Rayleigh damping ratio (Out-of-plane analysis,
ULS limit state, accelerogram #1, Y component). ... 234 Figure 5.49. Time history of the control displacement for different damping
ratios (Out-of-plane analysis, ULS limit state, accelerogram #1, Y component). Duration of the signal: 24 sec. ... 235 Figure 5.50. Application of the N2 Method to Ronciglione Viaduct: in-plane
analyses for ULS (left) and DLS (right) limit states and comparison with IDA results... 236 Figure 5.51. Application of the N2 Method to Ronciglione Viaduct:
out-of-plane analyses for ULS (left) and DLS (right) limit states and comparison with IDA results. ... 236 Figure 5.52. Acceleration response spectra of the selected signals, average
spectrum and target spectrum. ... 237 Figure 5.53. Scaled signals used for the non-linear dynamic analysis on
Ronciglione Viaduct under severe ULS Limit State conditions. ... 238 Figure 5.54. Application of the N2 Method to Ronciglione Viaduct under
severe ULS limit state: in-plane (left) out-of-plane (right) analyses and comparison with non-linear dynamic analysis results. ... 239 Figure 5.55. Seismic performance design objectives. ... 242
List of Tables
Table 2.1. Experimental properties of original and historic bricks. ... 42
Table 2.2. Experimental results of mortar samples under compression tests. ... 47
Table 2.3. Experimental plan for tests on brickwork prisms. ... 49
Table 2.4. Experimental results of masonry prisms under cyclic axial load. ... 51
Table 2.5. Experimental results of masonry specimens under axial load and bending moment. ... 70
Table 3.1. Input and output data for each module of the state determination process. ... 87
Table 3.2. Parameters of the constitutive relation for the two specimen types... 101
Table 3.3. Parameters of Masonry01 constitutive relationship and values assigned on the base of experimental results on S-C specimens. ... 103
Table 3.4. Parameters of Masonry02 constitutive relation and values assigned on the base of experimental results on S-C specimens. ... 105
Table 3.5. Comparison between experimental and numerical results. ... 110
Table 4.1. Historical empirical rules for the crown arch thickness from different authors (brickwork arches only). ... 119
Table 4.2. Historic empirical rules for the top thickness of the pier from different authors. ... 120
Table 4.3. Geometric and mechanical characteristics of Bolton Institute (Melbourne et al., 1997) experimental model. ... 127
Table 4.4. Ronciglione Viaduct geometric and mechanical characteristics. ... 134
Table 4.5. Ronciglione Viaduct geometric characteristics: piers. ... 134
Table 4.6. Cervo River Bridge geometric characteristics. ... 149
Table 4.7. Cervo River Bridge geometric characteristics: piers. ... 150
Table 4.8. Surveyed sample of rail bridges: characteristics of the lines. ... 161
Table 4.9. Bridge sample: geometric characteristics. ... 166
Table 4.10. Bridge sample: ultimate load under LM71 rail load for different constitutive models and modelling approaches... 168
Table 5.1. Modal analysis: periods and frequencies, participating factors and masses of the first ten modes. ... 193
Table 5.2. Modal analysis: periods and frequencies, participating factors and masses of the first ten modes (fiber beam model). ... 218
Table 5.3. Selected signals for IDA on Ronciglione Viaduct under ULS limit state conditions. ... 225 Table 5.4. Selected signals for IDA on Ronciglione Viaduct under DLS limit
state conditions. ... 225 Table 5.5. Properties of the bi-linear equivalent systems and Performance
Point coordinates provided by non-linear dynamic analyses. ... 235 Table 5.6. Selected signals for non-linear dynamic analyses on Ronciglione
Viaduct under severe ULS conditions. ... 237 Table 5.7. Properties of the bi-linear equivalent systems and Performance
Point coordinates provided by non-linear dynamic analyses (severe ULS conditions). ... 239
List of Symbols
Roman symbols
a Impulse amplitude
A Diagonal matrix containing the areas of the fibers a(x) Deformation interpolation matrix
AB, BC, CD, DA
Length of the links of the four-bars linkage B Brickwork specimen width
B Reference transformation matrix b(x) Force interpolation matrix
b1 Strength degradation rate in “Masonry02” constitutive law
b2 Strength loss after infinite cycles in “Masonry02” constitutive law
C Rayleigh damping matrix
CU Functional type coefficient
d Brickwork specimen depth
d(x), di(x) Deformation field along the element and its increment at step i
D(x), Di(x) Force field along the element and its increment at step i
dh Amplitude of hysteretic cycles
dk Control displacement
DR(x) Section resisting forces
e Eccentricity in eccentric compression tests on masonry
e Initial imposed eccentricity in eccentric compression tests on masonry
e Second order rotation-dependent eccentricity in eccentric compression tests on masonry
E(x) Fiber section resisting stresses vector
e(x), ej(x) Fiber section strain vector and its increment at step j
E Elastic modulus in ENT and EP constitutive laws E Young modulus
Eb Brick elastic modulus
Ec0 Initial tangent stiffness in the constitutive law for brickwork
Em Mortar elastic modulus
EM,s Slope of the softening branch of the response curve for masonry
under uniform compression tests
EM,u-r Average slope of the unloading-reloading branches of the response
curve for masonry under uniform compression tests EM0 Masonry initial elastic stiffness
Erel Stiffness of the reloading branches in the constitutive law for
brickwork
Esoft Slope of the softening branch in the constitutive law for brickwork
Etan Diagonal matrix containing the elastic moduli of the fibers
F Element flexibility matrix
F Applied load
f Frequency
f(x) Section flexibility matrix
F0, F0exp Maximum axial load in eccentric compression tests
F0num Maximum axial load in numerical predictions
fbc Brick strength in compression
fbt Brick strength in tension
fcp Compressive strength in the constitutive law for brickwork
fcu Compressive residual strength in the constitutive law for brickwork
fM Experimental strength in compression of brickwork
fmc Mortar strength in compression
fmt Mortar strength in tension
g Gravity acceleration GAB, GBC,
GCD
Centers of mass of links AB, BC and CD H Brickwork specimen height
hp Height of the steel beam used in eccentric compression tests on
masonry specimens HP Pier height
i Imaginary unit
IAB, IBC, ICD Centroidal moments of inertia of links AB, BC and CD
IL Intensity level
K Element stiffness matrix
KS Structure stiffness matrix
l(x) Linear geometric matrix containing the position of the fibers
L0, L Length of the beam finite element in the undeformed and deformed
configuration
M Structure mass matrix
M Applied bending moment
m Modal participating mass of the structure
m* Modal participating mass of the equivalent SDOF system M0 Maximum bending moment in eccentric compression tests
M0num Maximum bending moment in numerical predictions
ME Magnitude
n Number of unloading-reloading cycles
p Probability of exceedence
P Thickness of the top section of the pier
p, pi Structure displacement vector and its increment at step i
P, Pi External load vector at the structure level and its increment at step i
PR Structure resisting forces
Q() Forcing function
q, qi Vector of element deformation and its increment at step i
R Radius
r(x) Residual section deformation vector
RAB, RBC,
RCD, RDA
Position of the second end of the links link with respect to the first one (polar form)
RE Distance from the source
R Reduction factor
s Thickness of the vault section at the crown S Span
Sa Spectral acceleration
Sae Elastic spectral acceleration
Sd Spectral displacement
Sde Elastic spectral displacement
SF Safety factor t Influence vector t Time T Period T(, ) Kinetic energy tb Brick thickness
TC Characteristic period of the ground motion
tm Mortar layer thickness in masonry specimens
TR Return period
u Distance between axial load and compressed edge of the specimen in eccentric compression tests on masonry
u Initial distance between axial load and compressed edge of the specimen in eccentric compression tests on masonry
V() Potential energy
vAB, vBC,
vCD, vDA
Absolute linear velocity of the second end of the links link with respect to the first one (polar form)
Vb Resultant base shear
VN Nominal life
VR Reference period
W Self weight
W Vector of element basic force
xi, xj,yi, yj Coordinates of the end nodes i and j of the beam in the deformed
configuration with respect to the global reference system y* Depth of the stress block
yc Distance of the neutral axis from the sample compressed edge
Greek symbols
Skewback angle Angle of embrace
Self weight
Modal participating factor
Displacement of the point of force application Axial strain
c0 Strain corresponding to compressive strength in the constitutive law
for brickwork
cu Strain correspondent to compressive residual strength in the
constitutive law for brickwork 1,2 Rayleigh damping constants
Ductility
Lagrange parameter of the four-bar linkage AB, BC,
CD, DA
Rotation of the links of the four-bar linkage
d Diffusion angle of stresses within the fill soil
Rotation of the steel plates in experimental tests on masonry specimens
ci, cj Rotation of the end nodes i and j of the beam with respect to the chord
i, j Absolute rotation of the end nodes i and j of the beam
Relative slope of the reloading branch in Masonry01 and Masonry02 constitutive laws
Ductility factor b Brick Poisson ratio
eq Equivalent Poisson ratio for layers provided with head joints
m Mortar Poisson ratio
Viscous damping ratio
1 Relative initial slope of the unloading branch in Masonry01
constitutive law
2 Relative final slope of the unloading branch in Masonry01
constitutive law Friction angle
Eigenvector
1 Ratio between brick and mortar layer thickness
2 Ratio between brick and mortar elastic moduli
Normal stress Impulse duration Curvature AB, BC,
CD
Angular offsets of links AB, BC and CD Pulsation
AB, BC,
CD, DA
Rotational velocity of the links of the four-bars linkage Quantity of the MODF system and of the equivalent SDOF one
1. Introduction
1.1. Motivation and aims
The infrastructural networks of several Countries all over the world present a rich heritage of masonry bridges, spacing from small single-span overpasses to large multi-span viaducts. Most of the thousands of Italian masonry bridges belonging to rail and road lines are almost coeval, being built in the second half of XIX Century and in the very first years of XX Century. They show comparable geometries, materials, building techniques and design criteria, diffused all over the national territory after the unification of Italy. Thus, analogous features and issues often recur.
Historic bridges constitute a precious cultural heritage and evidence of the past, and specialized analysis and intervention methodologies are needed to ensure their safety level. Indeed, the activities of knowledge and valorization, conservation and assessment, inspection and diagnosis, repair, strengthening and retrofitting of existing bridges have recently experienced a wider and wider interest.
The design rules adopted in the past for the construction of masonry arches and multi-span bridges were based on empirical criteria or graphical methods. The expected traffic loads were lower than the actual ones and the seismic action was not explicitly included in the calculations; moreover, material degradation processes, foundation settlements, structural damages, transformations or partial demolitions could have occurred with the passing of time. Anyway, masonry bridges generally show an extremely long life and, thanks to the large self-weight, high strength and stiffness under exercise conditions. At present time, an accurate assessment towards both traffic and earthquake loads is needed according to the safety standard requested by actual codes. Nevertheless, no detailed instructions are provided by guide-lines and technical regulations to professional engineers for the structural analysis and reliability evaluation.
Despite their importance, a deep awareness of the real safety level offered by existing masonry bridges is still lacking and a lot of work has still to be done by the scientific community to better understand their structural
behaviour; several issues, such as for example the seismic response, even seem to be almost unexplored. Researchers have now to face the challenge of developing tools and procedures to carry out analysis, perform reliability assessment and design interventions that offer a satisfactory compromise between accuracy and simplicity.
A well-founded structural model has to include, among the other things, an accurate description of the material properties and of the effect induced by the interaction between structural elements on the whole response. Moreover, an adequate representation of the external actions has to be provided. At the same time, computational sustainability and robustness, as well as clearness and simplicity in the determination of the parameters, have to be ensured, since the professional utilization asks for low modelling and calculus time, and comprehensible, verifiable and, of course, reliable results.
Several alternative approaches are available nowadays for the structural analysis of masonry bridges. Limit analysis-based methods start from the simplifying assumptions proposed by Heyman (1966; 1982) that brickwork in compression is infinitely resistant or has finite strength with unlimited ductility, that it has no tensile resistance, and, finally, that no sliding between voussoirs occurs. They are widely used (see, among others: Harvey, 1988; Harvey and Smith, 1991; Gilbert and Melbourne, 1994; Clemente et al., 1995; Boothby, 1997; Gilbert, 2007; Clemente, 2010) but may lead to an overestimate of the effective strength. Otherwise, applications of incremental finite element analysis have been proposed, making use of 1-D (Molins and Roca, 1998; Boothby, 2001; Brencich and De Francesco, 2004a; 2004b; Brencich et al., 2004; de Felice, 2009), 2-D elements (Cavicchi and Gambarotta, 2005; 2007; Gilbert et al., 2007a) and 3-D elements (Fanning and Boothby, 2001; Fanning et al., 2005; Harvey et al., 2005; Domède and Sellier, 2010). As an alternative, expeditious empirical methodologies have been developed providing a quick estimate of the safety level of a bridge, such as the MEXE Method (UK Department of Transport, 1997; Wang et al., 2010) and the SMART Method (Melbourne et al., 2007).
In dynamics, static equivalent analyses based on the mechanism method are typically performed (Oppenheim, 1992; Clemente, 1998; De Luca et al., 2004; De Lorenzis et al., 2007), but the effective reliability of these approaches has still to be wholly verified. On the other hand, 3-D elasto-plastic finite elements (Pelà et al., 2009) and 1-D non-linear macro-elements (Resemini and Lagomarsino, 2007) have also been used. Finally, reliable assessment criteria towards earthquakes are lacking and should be included in a general performance-based approach.
The research work presented in this Thesis aims at giving a contribution in the field of the structural analysis of existing masonry bridges, facing some of the most important features of this complex issue; in detail the main purposes are:
− deeply understand some issues of the response of historic brickwork, such as the characteristics of the components (mortar and bricks), the behaviour under cyclic centered and eccentric loading, the cross-section deformation;
− developing an approach for the structural modelling based on beam elements with fiber cross-section that offers a good compromise between accuracy (which results from an adequate description of the material properties experimentally derived) and simplicity, and is therefore suitable for a practical use;
− deepening some features of the evaluation of the safety level offered by existing masonry bridges under exercise conditions, such as the effect of the material characteristics on the whole load-carrying capability, the feasibility of yield design-based approaches, the load models to adopt, the response of different bridge typologies in terms of resistance, expected damage, collapse mechanisms;
− facing the issue of the seismic response, starting from the identification of advantages and limits of available methodologies, based on non-linear static analysis methods and conceived for the design of r.c. and steel buildings;
− discussing the criteria and the procedures needing wariness in modal, non-linear static, and incremental non-linear dynamic analyses, such as the interpretation of modal frequencies and shapes; the load distribution to adopt within push-over methods, and, finally, the definition of damping parameters and the selection and manipulation of accelerograms within time-step integration simulations;
− outlining a first proposal of a performance-based seismic assessment methodology.
1.2. Organization of the Thesis
The Thesis is organized as follows. In Chapter 2 the results of an experimental campaign carried out on brick, mortar and masonry specimens, representative of Italian rail bridges, is presented. Monotonic and cyclic displacement-controlled tests, as well as three-point bending tests, are carried out on cubic and prismatic samples to determine the main mechanical properties of brick and mortar, then used to build brickwork prisms. The
mechanical response of historic brick masonry (resistance, stiffness, cyclic and softening behaviour) in terms of Force-Displacement and Moment-Curvature relations are derived on the base of cyclic centered and eccentric compression tests. The results are reported and discussed, together with the observed damage evolution. The cross-section behaviour of a brickwork element under compression and bending is examined, and a criterion for the estimate of the maximum load and an analytical estimate of the response after several load cycles are proposed.
In Chapter 3 the fiber beam element is presented and the possibility of using it to represent vaults and piers of masonry bridges is investigated. Two constitutive relations are defined, implemented and calibrated on the base of experimental results with the purpose of representing the global effective behaviour of historic brickwork under cyclic eccentric compression. Tests under axial force and bending moment are then simulated and numerical predictions are compared with experimental data in terms of strength domain and peak values, as well as of whole response curve.
In Chapter 4 the modelling of masonry bridges is described and applied to some case studies. First of all, a laboratory test carried out on a three-span large scale specimen in Bolton Institute (Melbourne et al., 1997) is simulated to validate the proposed approach. Two Italian historic multi-span viaducts are modelled and their load-carrying capability is evaluated under travelling load. The agreement between the results provided by the fiber beam simulations and limit analysis under the same constitutive assumptions is checked. The effective material properties are then taken into account and the effect of the constitutive law on overall resistance and collapse mechanism are discussed to establish to what extent the results of a yield design-based approach are reliable. Finally, the safety level offered by a wider sample of Italian large-span rail bridges is assessed under exercise conditions.
In Chapter 5 the seismic assessment is treated. First of all, the problem of a single arch under impulse base motion is considered: numerical simulations are compared to the solution provided by the mechanism method to validate the fiber beam-based approach in dynamics; size and slenderness effects on the resistance, as well as the influence of the material properties, are also investigated. Then the response of the arch under earthquake motion is investigated, and modal, push-over and dynamic analyses are performed. The main features of the analysis methods for the seismic assessment are presented and discussed, underlining some issues related to their application to masonry bridges: push-over analyses (distribution of horizontal loads, cyclic response), non-linear dynamic simulations (viscous damping, selection and scaling of records, choice of the structural state variables), earthquake engineering conventional procedures (reliability of push-over analysis-based methods). An existing viaduct is then analyzed: its natural frequencies and modal shapes are compared to the ones provided by an elastic model built with 3-D finite elements and then push-over analyses and incremental
non-Finally, some basic concepts of a framework for the performance-based seismic assessment are proposed.
In Chapter 6 the conclusions of the Thesis and the basis for future developments are illustrated.
2. Experimental investigation on
historic brickwork
2.1. State-of-the-art
Masonry vaults, arches, pillars and walls may experiment similar load conditions characterized by a concentration of compressive stress due to the eccentricity of the axial load acting on the cross-section. The collapse of these structural elements may be induced by loss of equilibrium as well as by crushing failure of the material; anyway, the compressive strength is not the only significant parameter, since the structural response to a cyclic loading history (such as traffic loads or seismic actions) is strongly influenced by the stiffness, and the post-peak, cyclic and hysteretic behaviour. For this reason, the investigation of the material mechanical properties is a primary issue for the structural assessment of masonry constructions.
The behaviour of brick masonry subjected to centered and eccentric axial load has been widely investigated over a long period of time. The first works date back to the Seventies and the Eighties. In (Francis et al., 1971; Shrive, 1985; McNary and Abrams, 1985; Page, 1981; 1983; Shubert, 1988) the parameters influencing the compressive strength and the stiffness of brickwork (such as the lateral strength of the units, and the lateral deformation mismatch between units and mortar) were studied.
In the last twenty years several works have been devoted to the experimental testing on masonry. An extensive campaign carried out to characterize the mechanical response of brick masonry under compression along both material directions, as well as in tension along horizontal mortar joint direction, is presented in (Olivito and Stumpo, 2001). Similar experimental tests have been carried out to investigate the compressive strength and the failure mechanism of brickwork loaded parallel to the bed joints in (Hoffman and Schubert, 1994). The influence of test sample geometry, including the presence of mortar head joints, on the compressive strength has been investigated in (Mann and Betzler, 1994). The bond effect
Again speaking of monotonic axial loading, in (Ewing and Kowalsky, 2004) an experimental campaign on unconfined and confined clay brick masonry prisms leads to the identification of the parameters of one of the first constitutive models for masonry to predict the experimental response. In (Oliveira et al., 2006) an experimental campaign on masonry under pure compression is presented, in which tests are carried out on both stone and brickwork masonry specimens, as well as on their components (sandstone and clay bricks); the main properties (strength, stiffness, brittleness, energy dissipation, degradation) are achieved from displacement controlled monotonic and cyclic tests.
The cyclic behaviour of masonry under axial load has been investigated in (Roberts et al., 2006) and in (AlShebany and Sinha, 1999); in the latter paper an analytical macroscopic constitutive relation (named stability curve) is proposed to describe the response after several unloading-reloading cycles. In (Tomor and Wang, 2010) the deterioration process of masonry under fatigue loading is investigated with the help of acoustic emission technique, and the fatigue strength is assessed.
The condition of combined axial load and bending moment is investigated by several authors, starting from (Drysdale and Hamid, 1982) and (Ding, 1997). A wide experimental campaign is described in (Brencich and Gambarotta, 2005), (Brencich et al., 2002) and (Brencich et al., 2006) in which the tests are carried out on clay brick masonry specimens, as well as on their components; crack pattern evolution, acoustic emissions and cross-section deformation are monitored; moreover, experimental data are compared with the predictions of a 3-D finite element model. Finally, in (Cavalieri et al., 2005) an analytical law for masonry in compression is defined on the base of centered and eccentric tests and is used to predict experimental response curves and strength properties.
Having in mind the effective loads experimented by masonry elements, and aiming at reproducing in the laboratory similar stress conditions, other combined actions have been investigated in addition to the eccentric axial load. Among others, in (Mojsilović and Marti, 1997) brickwork walls have been subjected to in-plane and out-of-plane loads, in (Mojsilović, 2005) and in (Mojsilović and Marti, 2002) shear and normal forces have been considered, and, finally, in (Litewka and Szojda, 2006) the collapse under triaxial state of stress has been investigated.
Although several studies have been carried out to experimentally determine its mechanical response, most contributions deal with contemporary, rather than historic, masonry. Apart from some studies on the behaviour of old brickwork under compression (Venu Madhava Rao et al., 1997; Aprile et al., 2001, de Felice and Carbone, 2006), or under overload phenomena (Anziani et al., 2000), with a view towards strengthening
techniques, such as in (Valluzzi et al., 2005), only a few papers have been devoted to historic masonry, which, however, may behave completely differently from contemporary one, due to both brick and mortar properties (Brencich and de Felice, 2009), as well as to the material degradation. The latter paper presents three different experimental campaigns carried out on historic brickwork elements under centered and eccentric compression; the limit domains gathered from laboratory data are estimated by means of a 1-D model and its reliability is investigated with the change in the global constitutive law (perfectly brittle, elasto-plastic, Kent&Park relation) as well as of the available ductility.
Regarding the materials used in the construction of old masonry bridges, some data on the mechanical properties of bricks and mortar may be found in historic treatises, like (Rondelet, 1802; Curioni, 1874; Séjourné, 1913; Gay, 1924); more recent experimental results can be found in (Barbi et al., 2002), where the behaviour of historic bricks under compression is presented, in (Sala et al., 2008) where the mechanical properties of lime mortar enriched with natural pozzolana are derived from experimental tests, and, finally, in (Binda et al., 1988), where the influence of mortar types on the compressive strength of masonry is underlined. In some cases, laboratory tests are performed on extracted samples from historic constructions in order to characterize chemical, physical and mechanical characteristics of original materials (Baronio et al., 2003), as well as on new materials, to be adopted for the repair or reconstruction of damaged buildings, to investigate their compatibility with historic ones (Binda et al., 2003).
In this chapter, an experimental campaign on historic brick masonry is presented, directed to assess the mechanical properties of the brickwork used in rail arch bridges built in Italy at the end of XIX Century. The starting point is the consideration that the behaviour of masonry under compression plays a non-negligible role in the bridge load-carrying and seismic capacity. In fact, the structural response, when close to failure, may widely change depending on the effective material properties (Brencich and De Francesco, 2004a; 2004b); for instance, the classical four-hinge mechanism takes place only when masonry exhibits an adequate ductility capacity; otherwise, failure is reached with crushing within the critical cross-section (de Felice, 2007; 2009). Moreover, the post peak behaviour was quite recently discovered to play a crucial role in the inelastic response of masonry (Lourenço, 1998).
With this in mind, some viaducts built between 1890 and 1894 along the rail line between Rome and Viterbo have been surveyed and the masonry properties assessed, to reproduce in the laboratory specimens having characteristics similar to the brickwork used in the bridges.
The significance of this experimental campaign and the scientific contribute represented by its results arise from the consideration that most of the rail Italian masonry bridges were built in a relatively short period of time
2007). This is the reason why bridges with comparable overall dimension, material properties and structural details may be found, without distinction, in different regions. Their structural assessment has to start from the knowledge of the effective properties of the brickwork they are made of.
2.2. Experimental set-up
The whole experimental investigation presented in this work is carried out in the Experimental Laboratory of the Department of Structures of University Roma Tre. The tests are made using an MTS hydraulic load frame (Figure 2.1) with 500kN load rating; most of the experiments are displacement controlled, with a velocity of displacement of the load plates equal to 0.01mm/sec, while when the control is made on the load the rate of application of the force is equal to 50N/sec, as suggested by the European Standards (UNI EN 772-1). The acquisition frequency is always equal to 10Hz.
In the unloading branches of the displacement controlled cyclic tests, a testing procedure is implemented ad hoc, provided with a minimum load threshold to avoid the complete unloading of the specimen.
Except for the applied load data, directly acquired by the load cell integrated in the MTS testing machine, displacements and strains are acquired by linear potentiometers and resistive strain-gauges, and collected by a National Instruments NI PCI 6281 Multifunction Data Acquisition (DAQ) system. It is provided with 3 units NI SCXI 1520 Universal Strain-Gauge Input Module, with 8 Channels each; the acquisition software is developed in LabView environment.
Figure 2.1. MTS testing machine (left) and detail of the oil control device (right, up) and of the data acquisition device (right, bottom).
2.3. Masonry components
Before testing masonry specimens, the mechanical properties of bricks and mortar used for their construction are investigated; monotonic and cyclic compression tests and three-point bending tests are performed to determine the compressive and tensile strength of the materials together with the correspondent strain values, their stiffness, and, thanks to the displacement control, their whole response curve, including the post-peak softening phase and the unloading-reloading cycles.
This first part of the experimental campaign leads to a deeper knowledge of the mechanical behaviour of historic materials, whose response shows some important differences if compared with those in use nowadays, and to useful information for the interpretation of the response of brickwork specimens.
In the construction of the bridge vaults of the rail line built between 1890 and 1894 from Rome to Viterbo, clay bricks were used also called original bricks hereafter; they measure 270×130×55mm3. In order to determine their mechanical properties, 20 cubic samples with side 45÷50mm are extracted from 6 bricks and submitted to monotonic and cyclic compression tests. The experiments are performed in direction normal to the face of the bed joints, which are previously carefully leveled by means of a grinding machine (Figure 2.2) in order to guarantee the parallelism of the loaded surfaces and avoid initial stress concentrations. No devices are employed to reduce the friction between the specimen surface and the plates of the load frame.
For the purpose of reproducing masonry specimens to be tested in the laboratory, a stock of old clay bricks (also called historic bricks hereafter) with the same characteristics and dimensions as the original samples is found; the bricks were produced at the beginning of the XX Century in a clink situated in Monterotondo, not far from the bridge locations. Their mechanical properties are determined by testing 11 cubic specimens of approximately 48mm side, extracted from 6 bricks.
Figure 2.2. Cutting machine (right) and grinding machine (left).
The stress-strain curves are reported in Figures 2.3 and 2.4 for original and historic bricks, respectively: both brick stocks show very similar properties in terms of strength and post-peak behaviour, with a slightly higher stiffness of old bricks.
The maximum stress is approximately 30MPa, and the correspondent strain is in the order of 1%. Looking at the response curves, an apparent stiffness increase is observed in the first branch, resulting from the bedding effect induced by the asperities and the unavoidable non-perfect parallelism of the loaded surfaces; however, a linear branch can be clearly identified from the end of this bedding phase until about 70% of the maximum load; the elastic stiffness is estimated by a linear interpolation of this linear branch,
giving an average value of about 3100MPa and 3900MPa for original and historic bricks, respectively.
0 0.01 0.02 0.03 0.04 0 5 10 15 20 25 30 35 40 [ M P a ] 0 0.01 0.02 0.03 0.04 0 5 10 15 20 25 30 35 40 [ M P a ]
Figure 2.3. Experimental stress-strain curves of monotonic (left) and cyclic (right) compression tests on original brick cubic samples belonging to the
masonry arch bridges of Rome-Viterbo rail line.
0 0.01 0.02 0.03 0.04 0 5 10 15 20 25 30 35 40 [ M P a ] 0 0.01 0.02 0.03 0.04 0 5 10 15 20 25 30 35 40 [ M P a ]
Figure 2.4. Experimental stress-strain curves of monotonic (left) and cyclic (right) compression tests on historic brick cubic samples (bricks manifactured
in Monterotondo clink).
Both the stocks of bricks behave comparably under cyclic loading, showing a good capability in sustaining loading-unloading cycles even when they are performed in the softening branch, without appreciable stiffness degradation in spite of the high level of deformation and damage reached.