UNIVERSITÀ DEGLI STUDI DI SASSARI SCUOLA DI DOTTORATO DI RICERCA
Scienze e Biotecnologie dei Sistemi Agrari e Forestali e delle Produzioni Alimentari
Indirizzo:
Agrometeorologia ed Ecofisiologia dei Sistemi Agrari e Forestali
Ciclo XXVI
Anno Accademico 2012 - 2013
Assessment of the Climate Change Impact and Adaptation Strategies
on Italian Cereal Production using High Resolution Climate Data
Dr. Andrea Gallo
Direttore della Scuola Prof. Alba Pusino Referente di Indirizzo Prof. Donatella Spano Docente Guida
Tutor
Prof. Donatella Spano Dr. Valentina Mereu
II
Andrea Gallo - Assessment of the Climate Change Impact and Adaptation Strategies on Italian Cereal Production using High Resolution Climate Data - Tesi di Dottorato in Agrometeorologia ed Ecofisiologia dei Sistemi Agrari e Forestali - XXVI ciclo - Università degli Studi di Sassari
Nicholas Stern The two defining challenges of the 21st century are overcoming poverty and avoiding dangerous climate change. If we fail on one of them, we will fail on the other. Unmanaged climate change will irretrievably damage prospects for development during the course of the century, and action on climate change which hinders development over the next two decades can never build the global coalition on which action on climate change depends.
III
Andrea Gallo - Assessment of the Climate Change Impact and Adaptation Strategies on Italian Cereal Production using High Resolution Climate Data - Tesi di Dottorato in Agrometeorologia ed Ecofisiologia dei Sistemi Agrari e Forestali - XXVI ciclo - Università degli Studi di Sassari
CONTENTS
ABSTRACT 8
Structure of the thesis 9
1. INTRODUCTION 10
1.1 THE IMPORTANCE OF THE CEREALS FOR HUMAN 15
CONSUMPTION
1.1.1 World cereal production 15
1.1.2 Wheat production 17
Durum wheat 19
Durum wheat in Italy 22
Common wheat 24
Common wheat in Italy 25
1.1.3 Maize production 28
Maize in Italy 33
1.2 CLIMATE CHANGE SCENARIOS AND MODELS 37
1.2.1 Emissions scenarios 38
1.2.2 New climate change scenarios 42
Representative Concentration Pathways 46
Extended Concentration Pathways 51
1.2.3 General Circulation Models 52
1.2.4 Regional Climate Models 55
1.3 CROP SIMULATION MODELS 58
1.3.1 Classification of crop models 59
1.3.2 Main crop models 59
1.3.3 Decision Support System for Agrotechnology Transfer - Cropping 64 System Model (DSSAT-CSM)
1.3.4 CSM-CERES-Wheat and CSM-CERES-Maize models description 67
REFERENCES 74
IV
Andrea Gallo - Assessment of the Climate Change Impact and Adaptation Strategies on Italian Cereal Production using High Resolution Climate Data - Tesi di Dottorato in Agrometeorologia ed Ecofisiologia dei Sistemi Agrari e Forestali - XXVI ciclo - Università degli Studi di Sassari
3. 92
3.1 INTRODUCTION 92
3.2 OBJECTIVES 98
3.3 MATERIALS AND METHODS 99
3.3.1 Cultivar selection 100 Durum wheat 100 Common wheat 101 Maize 101 3.3.2 Data collection 102 Soil data 102 Weather data 103
Agronomic and crop management data 104
3.3.3 Selection of the experimental sites 104
Durum wheat 105
Common wheat 107
Maize 109
3.3.4 Loading data into DSSAT-CSM 111
3.3.5 Calibration and evaluation of crop models 111
CSM-CERES-Wheat model calibration 111
CSM-CERES-Maize model calibration 113
Crop models validation and evaluation 113
3.3.6 Statistical analysis 114
3.3.7 Sensitivity analysis 116
3.4 RESULTS 118
3.4.1 CSM-CERES-Wheat and CSM-CERES-Maize models calibration
and evaluation 118
3.4.2 Durum wheat 118
Calibration for Iride cultivar 118
Evaluation for Iride cultivar 121
3.4.3 Common wheat 124
Calibration for Bologna cultivar 125
PERFORMANCES OF WHEAT AND CSM-CERES-MAIZE MODELS TO PREDICT PHENOLOGY AND YIELD OF
TRITICUM DURUM DESF., TRITICUM AESTIVUM L. AND ZEA MAYS L. AT ITALIAN SCALE
V
Andrea Gallo - Assessment of the Climate Change Impact and Adaptation Strategies on Italian Cereal Production using High Resolution Climate Data - Tesi di Dottorato in Agrometeorologia ed Ecofisiologia dei Sistemi Agrari e Forestali - XXVI ciclo - Università degli Studi di Sassari
Evaluation for Bologna cultivar 127
3.4.4 Maize 130
Calibration for Eleonora cultivar 130
Evaluation for Eleonora cultivar 132
3.4.5 Sensitivity analysis 134 3.5 DISCUSSION 140 3.6 CONCLUSIONS 143 REFERENCES 145 4. 151 4.1 INTRODUCTION 151
4.1.1 The vulnerability of agriculture to climate change 152
4.1.2 Climate change and crop growth 154
Increase in the atmospheric concentration of carbon dioxide 154
Increase in air temperature 155
Changes in rainfall patterns 157
Increased frequency of extreme weather events 158 Changes in distribution of weed and plant diseases 159
Sea level rise and salinization 159
4.1.3 Climate change impacts on Italian agriculture 159
4.2 OBJECTIVES 164
4.3 MATERIALS AND METHODS 165
4.3.1 Data collection 166
Soil data 166
Climate data 166
Agronomic and crop management data 168
4.3.2 Climate change impact assessment 169
4.3.3 Statistical analysis 171
4.4 RESULTS 172
4.4.1 Durum wheat 172
Maturity date 172
ASSESSMENT OF CLIMATE CHANGE IMPACTS ON TRITICUM
DURUM DESF., TRITICUM AESTIVUM L. AND ZEA MAYS L. AT
THE ITALIAN SCALE USING A DIGITAL PLATFORM AND HIGH RESOLUTION CLIMATE DATA
VI
Andrea Gallo - Assessment of the Climate Change Impact and Adaptation Strategies on Italian Cereal Production using High Resolution Climate Data - Tesi di Dottorato in Agrometeorologia ed Ecofisiologia dei Sistemi Agrari e Forestali - XXVI ciclo - Università degli Studi di Sassari
Grain yield 175 4.4.2 Common wheat 181 Maturity date 181 Grain yield 184 4.4.3 Maize 189 Maturity date 189 Grain yield 190 Irrigation requirements 196 4.4.4 Statistical analysis 199 4.5 DISCUSSION 207 4.6 CONCLUSIONS 214 REFERENCES 215 5. 225 5.1 INTRODUCTION 225 5.1.1 Adaptation strategies 226
Adaptation strategies in the short term 230 Adaptation strategies in the medium-long term 232
5.1.2 Mitigation strategies 233
5.1.3 Interactions between adaptation and mitigation strategies 235
5.2 OBJECTIVES 239
5.3 MATERIALS AND METHODS 240
5.4 RESULTS 244
5.4.1 Durum wheat 244
Shifting of sowing date 244
Maturity date 244
Grain yield 248
Changes in fertilization regime 254
Grain yield 254
Application of the irrigation 258
Grain yield 258
COMPARISON OF SEVERAL ADAPTATION STRATEGIES TO REDUCE CLIMATE CHANGE IMPACTS ON TRITICUM DURUM DESF., TRITICUM AESTIVUM L. AND ZEA MAYS L. AT ITALIAN SCALE
VII
Andrea Gallo - Assessment of the Climate Change Impact and Adaptation Strategies on Italian Cereal Production using High Resolution Climate Data - Tesi di Dottorato in Agrometeorologia ed Ecofisiologia dei Sistemi Agrari e Forestali - XXVI ciclo - Università degli Studi di Sassari
Comparison between adaptation strategies for durum wheat 261
5.4.2 Common wheat 261
Shifting of sowing date 261
Maturity date 261
Grain yield 270
Changes in fertilization regime 276
Grain yield 276
Application of the irrigation 278
Grain yield 278
Comparison between adaptation strategies for common wheat 280
5.4.3 Maize 280
Shifting of sowing date 280
Maturity date 283
Grain yield 288
Changes in fertilization regime 293
Grain yield 294
Comparison between adaptation strategies for maize 298
5.5 DISCUSSION 301
5.6 CONCLUSIONS 306
REFERENCES 308
8
Andrea Gallo - Assessment of the Climate Change Impact and Adaptation Strategies on Italian Cereal Production using High Resolution Climate Data - Tesi di Dottorato in Agrometeorologia ed Ecofisiologia dei Sistemi Agrari e Forestali - XXVI ciclo - Università degli Studi di Sassari
ABSTRACT
The agricultural sector could suffer the impacts of climate changes projected for the coming decades with consequences varying from one region to another. Given the primary importance of wheat and maize for Italian agriculture, it is necessary to adopt the most effective adaptation strategies to climate change.
The objective of this study was to evaluate the effects of the increases in atmospheric CO2 concentration on the phenology and yield of the main Italian cultivars
of durum wheat, common wheat and maize at the national scale, considering the climate, soil and crop management features in each cultivation area, with and without adaptation.
The CSM-CERES-Wheat and CSM-CERES-Maize crop models were calibrated and evaluated at the Italian level. The assessments of climate change impacts and adaptation strategies were made using a digital platform and high resolution climate data of two climate change scenarios related to a single climate model. The uncertainty analysis of the yield outputs associated with the different resolution of the input data was also performed.
The results show increases of yield for wheat and a reduction of the maize productivity in Italy. Better results have been obtained using a fine resolution of input data. Irrigation and early sowing are the most effective adaptation strategies to climate change for wheat, while the incorporation of crop residues is an useful adaptation option for maize, especially before mid-century.
9
Andrea Gallo - Assessment of the Climate Change Impact and Adaptation Strategies on Italian Cereal Production using High Resolution Climate Data - Tesi di Dottorato in Agrometeorologia ed Ecofisiologia dei Sistemi Agrari e Forestali - XXVI ciclo - Università degli Studi di Sassari
Structure of the thesis
The thesis is divided into several sections that deal with different aspects of the work that has been undertaken. After the first two sections (introduction and objectives), the following sections are organized according to the scientific scheme (introduction, objectives, materials and methods, results, conclusions, references).
The first section serves as an introduction to the chapters that follow. The first part of the introduction describes the importance of cereals for various uses (especially for food), with a particular focus on wheat and maize, which are the most important cereals in the world. In the next part, the scenarios and models used for climate change studies are discussed, with particular attention to the new generation scenarios (Representative Concentration Pathways) that were used in this work. The introduction of the thesis concludes with an overview of crop simulation models and their utility in research on climate change in agriculture (such as the study of the impacts of climate change on phenology and yield of crops and evaluation of the most effective adaptation strategies). Particular attention is given to models CERES-Wheat and CSM-CERES-Maize implemented in the Decision Support System for Agrotechnology Transfer-Cropping System Model (DSSAT-CSM) that was used in this study.
The second section describes the objectives of the thesis and the methodological scheme followed in order to achieve them.
The third section relates to the first part of the thesis work: the parameterization at the Italian scale of the CSM-CERES-Wheat and CSM-CERES-Maize crop models for the considered crops (durum wheat, common wheat and maize). Detailed results of the calibration, evaluation and sensitivity analysis of these models are described for each crop.
The fourth section is dedicated to the assessment of climate change impacts on phenology and yield of crops considered in this study, through the use of crop models parameterized in the previous phase and considering two climate change scenarios (RCP4.5 and RCP8.5). In addition, the results of uncertainty analysis of the simulations output results due to two different climate data resolutions are shown in this section.
Finally, the last section shows the results of the evaluation of adaptation strategies that can be adopted in Italy in order to limit the negative effects of climate change on phenology and yield of durum wheat, common wheat and maize.
In chapters 3, 4 and 5 all the graphical and statistical results are shown separately for each crop.
10
Andrea Gallo - Assessment of the Climate Change Impact and Adaptation Strategies on Italian Cereal Production using High Resolution Climate Data - Tesi di Dottorato in Agrometeorologia ed Ecofisiologia dei Sistemi Agrari e Forestali - XXVI ciclo - Università degli Studi di Sassari
1. INTRODUCTION
The issue of climate change and related impacts at the socio-economic and political level is of a very high contemporary importance, as evidenced by numerous studies in recent decades. In fact, climate change has direct and indirect effects in several areas affecting human society, like agriculture, forestry, tourism, etc. The consequent implications on food security and on land use change are of particular importance both at the local and global scale.
Among the priorities for action on climate change, we may mention the United Nations Framework Convention on Climate Change (UNFCCC) at the political level and the Intergovernmental Panel on Climate Change (IPCC) at the scientific level.
The IPCC, in its Fifth Assessment Report, defines climate change as a statistically significant change of the mean state of the climate or of its natural or anthropogenic variability persisting for an extended period (typically decades or longer) (IPCC, 2013). On the other hand, the UNFCCC (1998) defines climate change as a change of climate which is attributed directly or indirectly to human activity that alters the composition of the global atmosphere and which is in addition to natural climate variability observed over comparable time periods.
The most obvious of ongoing climate change is the warming of the climate system, as evidenced by the increase in the average temperature of the air and oceans, the progressive melting of glaciers and the resulting increase in mean sea level. Further evidence of recent changes in climate is represented by the change in the composition of terrestrial and marine ecosystems, with the appearance of new species. (IPCC, 2013).
The main drivers of climate change are the progressive increase in the atmospheric concentration of greenhouse gases (GHGs) and aerosols, the solar irradiance and land cover. They influence the various radiative processes (absorption, scattering and emission) within the atmosphere and on the Earth's surface, resulting in positive or negative changes in energy balance defined as radiative forcing and expressed in W m-2 (IPCC, 2013).
Nowadays it is widely recognized that changes in radiative forcing are mainly due to anthropogenic emissions of long-lived GHGs: carbon dioxide (CO2), methane
(CH4), nitrous oxide (N2O) and halocarbons (F-gases). These gases accumulate in the
atmosphere and their concentrations increase with time (Figure 1). Significant increases in emissions of all of these gases have occurred in the industrial era: +80% between 1970 and 2010 (Figure 2). The largest increases in global emissions of GHGs in the
11
Andrea Gallo - Assessment of the Climate Change Impact and Adaptation Strategies on Italian Cereal Production using High Resolution Climate Data - Tesi di Dottorato in Agrometeorologia ed Ecofisiologia dei Sistemi Agrari e Forestali - XXVI ciclo - Università degli Studi di Sassari
same period are due to the energy sector (+145%). The energy supply sector is the one which mostly contributes to anthropogenic greenhouse gases emissions (35% in 2010), followed by the industrial sector (31.7%), agriculture (11.2%), and forestry and other land use (12.7%) (IPCC, 2014a).
Figure 1. Trend in atmospheric concentrations of important long-lived greenhouse gases over the last 2,000 years (source: IPCC, 2007).
Figure 2. Trend in atmospheric concentrations of important long-lived greenhouse gases over the last 40 years (source: IPCC, 2014a).
12
Andrea Gallo - Assessment of the Climate Change Impact and Adaptation Strategies on Italian Cereal Production using High Resolution Climate Data - Tesi di Dottorato in Agrometeorologia ed Ecofisiologia dei Sistemi Agrari e Forestali - XXVI ciclo - Università degli Studi di Sassari
The most important anthropogenic GHG is CO2 (77% of total anthropogenic
GHG emissions in 2010) (IPCC, 2014a). Its atmospheric concentration has increased from 280 ppm in pre-industrial era to 390.5 ppm in 2011 (+39.5%), becoming the most important component of the radiative forcing of climate change (IPCC, 2013). The main natural sinks of CO2 are the oceans (containing 78% of the total CO2) and fossil
sediments (22%). The main source of CO2 emissions is represented by fossil fuels (oil,
coal and natural gas), followed by the phenomena of deforestation, land use change, decay of biomass, etc. (IPCC, 2013). Its average persistence in the atmosphere is high and variable between 50 and 200 years, depending on the means of absorption.
The second largest long-lived GHGs is methane (CH4), which contributes to the
total radiative forcing for more than 15% and whose emissions derive from various sources such as the production and transport of fossil fuels, wetlands, livestock, rice cultivation, biomass burning and the decay of organic waste in solid waste landfills (IPCC, 2007, 2014a). Its global atmospheric concentration has increased by about 150% compared to pre-industrial levels (IPCC, 2013). Its average atmospheric concentration is about 1.8 ppm in 2011 with an average annual increase ranging between 1% and 1.4%. Notwithstanding the low concentration, methane has a capacity to retain heat about 20 times greater than carbon dioxide. Its persistence in the atmosphere is lower than that of CO2 (between 10 and 15 years).
Nitrous oxide (N2O) is the third long-lived GHGs (6.2% of total GHG emissions
in 2010) (IPCC, 2014a). Its atmospheric concentration is less than that of carbon dioxide and methane (about 0.3 ppm) with an average annual increase of 0.3% (about +20% compared to pre-industrial era) (IPCC, 2013). Emission sources are the agricultural sector (fertilization based on nitrogen fertilizers), the industrial sector (production of nylon), urban traffic and power plants using fossil fuels. N2O emissions
have increased by 50%, largely due to the development of the agricultural sector (IPCC, 2007, 2014a). Nitrous oxide has a capacity to absorb heat about 300 times greater than CO2 and has an average time of persistence of about 120 years.
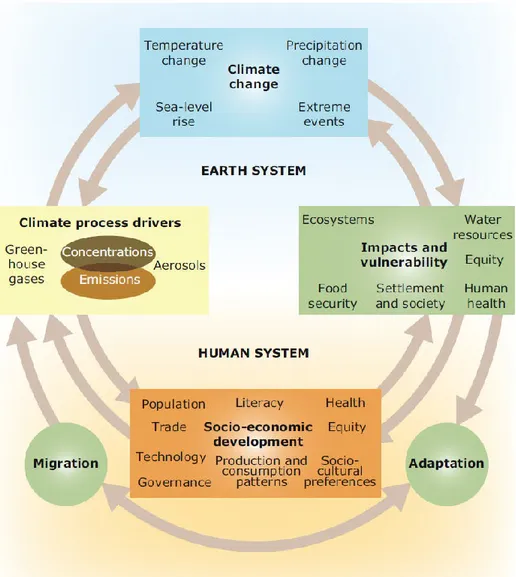
Figure 3 shows the linkages between the anthropogenic drivers of climate change, socio-economic and environmental impacts of climate change and possible measures (adaptation and mitigation strategies) in favor of socio-economic development.
The main effect of the increase in the atmospheric concentration of long-lived GHGs is the warming of the climate system. CO2 is the GHG most responsible for the
13
Andrea Gallo - Assessment of the Climate Change Impact and Adaptation Strategies on Italian Cereal Production using High Resolution Climate Data - Tesi di Dottorato in Agrometeorologia ed Ecofisiologia dei Sistemi Agrari e Forestali - XXVI ciclo - Università degli Studi di Sassari
Figure 3. Schematic framework representing anthropogenic climate change drivers, impacts and responses, and their links (source: IPCC, 2007 modified by European Environment Agency, http://www.eea.europa.eu/publications/environmental-indicator-report-2012/environmental-indicator-report-2012-ecosystem/part2.xhtml).
increase in the average temperature in recent decades (+0.85 °C from the pre-industrial era to 2012) (IPCC, 2013). According to recent projections, the atmospheric concentration of CO2 will increase to more than 700 ppm, resulting in increase of
average global temperature between 1.0 °C and 3.7 °C by the end of the century, depending on the climate change scenario (IPCC, 2013). Another consequence of the increase in the atmospheric concentration of GHGs is the change in rainfall patterns, with a reduction of these and an increase in the number and intensity of extreme weather events (floods and droughts).
The impacts of climate change on the environment (water resources, land use changes, etc.) and human activities (agriculture, tourism, etc.) are inevitable, even if
14
Andrea Gallo - Assessment of the Climate Change Impact and Adaptation Strategies on Italian Cereal Production using High Resolution Climate Data - Tesi di Dottorato in Agrometeorologia ed Ecofisiologia dei Sistemi Agrari e Forestali - XXVI ciclo - Università degli Studi di Sassari
their amount is variable in different areas of the planet (see section 4 of this thesis). Therefore, taking into account the climate projections for the coming decades, an accurate assessment of the climate change impacts is essential to evaluate the most effective strategies for adaptation and/or mitigation to climate change. These evaluations may be a useful tool for policy makers in order to plan for priority actions at different scales (from the field to the regional scale).
15
Andrea Gallo - Assessment of the Climate Change Impact and Adaptation Strategies on Italian Cereal Production using High Resolution Climate Data - Tesi di Dottorato in Agrometeorologia ed Ecofisiologia dei Sistemi Agrari e Forestali - XXVI ciclo - Università degli Studi di Sassari
1.1 THE IMPORTANCE OF CEREALS FOR HUMAN CONSUMPTION 1.1.1 World cereal production
Cereals are the main source of food supply for direct food consumption in the world. Therefore they represent the key sector for global agriculture and food security. The area cultivated with cereals in the world amounts to about 700 million hectares while total production is about 2.5 billion tons in 2012 (FAO, 2014a).
Figure 4 shows the increasing trend of production and use of cereals in the world over the past decade (FAO, 2014b). World cereal production by type in recent years is shown in Figure 5 (USDA, 2014). The most important cereals are maize, wheat and rice, which together cover about 80% of the total area cultivated with cereals with world production of 869, 657 and 472 million tons respectively in the crop year 2012-2013 (FAO, 2014a; USDA, 2014). For 2014 an increase in production is predicted for maize (+13.0%), wheat (+8.6%) and rice (+1.3%), as compared to 2013 (USDA, 2014).
16
Andrea Gallo - Assessment of the Climate Change Impact and Adaptation Strategies on Italian Cereal Production using High Resolution Climate Data - Tesi di Dottorato in Agrometeorologia ed Ecofisiologia dei Sistemi Agrari e Forestali - XXVI ciclo - Università degli Studi di Sassari
Figure 5. Evolution of the world cereal production by type (source: USDA, 2014).
The global trend of the use of cereals by type is shown in Figure 6. Cereals are mainly used for human consumption (46.2% of the total in 2012) and secondarily for animal feed (34.5%) (FAO, 2014c).
Figure 6. Global trend of cereal utilization by type (source: FAO, 2014c). 0 200 400 600 800 1,000 1,200 1,400
Wheat Coarse Grains Rice Maize
P ro du cti on (th ou san d m etr ic to nn es ) 2011-2012 2012-2013 2013-2014 (estimate) 0 500 1,000 1,500 2,000 2,500 3,000
Food Animal feed Other uses Total
C er eal u ti li zati on (m il li on to nn es ) 2012-2013 2013-2014 (estimate) 2014-2015 (forecast)
17
Andrea Gallo - Assessment of the Climate Change Impact and Adaptation Strategies on Italian Cereal Production using High Resolution Climate Data - Tesi di Dottorato in Agrometeorologia ed Ecofisiologia dei Sistemi Agrari e Forestali - XXVI ciclo - Università degli Studi di Sassari
Recent studies have shown an overall increase in yields of main cereals in the medium-recent past (Hafner, 2003; Ray et al., 2012). In particular, in the period 1962-2002 the average annual increase in yields in the world was 43 kg ha-1 for wheat and 62 kg ha-1 for maize, while in Europe the average annual increase in yields for these two crops was higher (77 and 145 kg ha-1 respectively) (Hafner, 2003). Over the past decade (2002-2012) the annual average yields increased further at the global level (+33 kg ha-1 for wheat and +40 kg ha-1 for maize) and also in Europe for wheat (+14 kg ha-1). Instead, an average annual decrease in yield was observed for maize at the European level (-42 kg ha-1) (FAO, 2014a). This is due to the decrease in wheat yields in some western European countries as a result of recent climate change (Brisson et al., 2010). The increase in yield in the 1961-2008 period has affected more than half of the cultivated area in wheat and maize in the world (61.2% and 70.1% respectively) (Ray et al., 2012).
However, recent research shows that climate change will have a negative impact on cereal yield in the coming decades, to varying degrees with the type of cereal, the geographical area and the climate change scenario and will lead to the northward shift of the cultivation areas (Brown, 2002; Ciais et al., 2005; Fischer et al., 2005; Hildén et al., 2005; Parry et al., 2005; Rosenweig et al., 2005; IPCC, 2007, 2014b, 2014c; Olesen et al., 2007; Mereu, 2010; Ciscar et al., 2011; Lobell et al., 2011; Mereu et al., 2012).
Considering the steady growth of the world population and the increase in area sown to cereals for biofuels production in recent years, the impacts of climate change on the variability of cereal yields is even more important for food security, especially in semi-arid areas (e.g., sub-Saharan Africa and several areas of Southern Asia) (Brunisma, 2003; IPCC, 2007; Schmidhuber and Tubiello, 2007).
1.1.2 Wheat production
Wheat is a cereal of primary importance for human consumption and, therefore, for food safety. Its spread over time has been favored by some of the characteristics that have made it an essential element to the world economy. First, it is a crop adaptable to different environments. This has made possible its large-scale cultivation. Second, the grain of wheat is a dry product, so it is easily storable and allows the establishment of stocks usable in time. Finally, the grain has a content of proteins, lipids, minerals and vitamins that make it suitable for human consumption.
18
Andrea Gallo - Assessment of the Climate Change Impact and Adaptation Strategies on Italian Cereal Production using High Resolution Climate Data - Tesi di Dottorato in Agrometeorologia ed Ecofisiologia dei Sistemi Agrari e Forestali - XXVI ciclo - Università degli Studi di Sassari
leavened bakery products, biscuits, pasta) (69.2% of total use) and secondarily for feeding livestock (19.3%). The remaining fraction (11.5%) is allocated for other uses (e.g., as a source of bio-energy) (Mergoum et al., 2009; FAO, 2014c).
Table 1 shows the trend of world production of wheat in recent years (2011-2013), and an estimate for 2014. The main producers are European Union, China, India, USA and Russia.
Table 1. Wheat world production in 2011, 2012, 2013, 2014 and estimates for 2015 (millions of metric tons) (source: USDA, 2014).
Country 2011 2012 2013 2014 (estimate) Argentina 17.2 15.5 9.3 10.5 Australia 27.4 29.9 22.5 27.0 Brazil 5.9 5.8 4.4 5.3 Canada 23.3 25.3 27.2 37.5 China 115.2 117.4 121.0 121.7 Egypt 7.2 8.4 8.5 8.7 European Union 136.0 137.3 133.9 143.3 India 80.8 86.9 94.9 93.5 Iran 15.0 13.5 13.8 14.5 Kazakhstan 9.6 22.7 9.8 13.9 Pakistan 23.9 25.0 23.3 24.0 Russia 41.5 56.2 37.7 52.1 Turkey 17.0 18.8 15.5 18.0 Ukraine 16.8 22.3 15.8 22.3 USA 60.1 54.4 61.7 58.0 Uzbekistan 6.5 6.3 6.7 6.7 Others 48.2 50.4 51.4 56.9 Worldwide 652.3 697.2 657.3 714.0
Considering world population growth and the limited availability of arable land, global grain production must increase in order to meet the growing demand for food. Therefore it is necessary to increase the grain yield of the areas currently under cultivation. This objective will be achieved through genetic improvement of the varieties currently used in order to introduce new varieties with higher yields and which are stable and more resistant to main plant diseases and abiotic factors. In such a way it will be possible to obtain varieties adaptable to the different cultivation areas, a condition of considerable importance if one takes into account the impacts of climate
19
Andrea Gallo - Assessment of the Climate Change Impact and Adaptation Strategies on Italian Cereal Production using High Resolution Climate Data - Tesi di Dottorato in Agrometeorologia ed Ecofisiologia dei Sistemi Agrari e Forestali - XXVI ciclo - Università degli Studi di Sassari
change for the coming decades.
There are different classifications of wheat. Those most commonly used are based on the genetic characteristics, growth habits and qualitative characteristics.
The most important types of wheat currently on the market are common wheat (Triticum aestivum L.) and durum wheat (Triticum durum Desf.). Common wheat is a hexaploid type of wheat (2n = 6x = 42), while durum wheat is tetraploid (2n = 4x = 28) (Mergoum et al., 2009). Common wheat is the most cultivated one in the world (about 95% of world wheat production) (Taylor and Koo, 2013).
Depending on growth habits, there are three main classes of wheat: winter, spring and facultative. Winter wheat is sown in late summer or autumn and requires vernalization for flowering. Therefore, it can withstand low winter temperatures. Growth resumes in early spring and grain is harvested in early summer. Winter wheat is mostly common wheat. Spring wheat does not usually require vernalization to flower and cannot endure temperatures below zero. Therefore it is mainly cultivated in areas with harsh winters in which it is sown in spring and harvested in late summer. The greatest part of global wheat production is spring wheat. Facultative wheat is a type of wheat for which vernalization is optional. It is cultivated mainly during the winter in mild climates and cannot endure long periods with temperatures below zero (Baenziger and DePauw, 2009; Taylor and Koo, 2012, 2013).
Finally, based on the qualitative characteristics (color of the caryopsis, endosperm hardness, etc.), winter and spring wheat can be distinguished in further classes, as described in Table 2 (Baenziger and DePauw, 2009; Mergoum et al., 2009).
Durum wheat
The durum wheat (Triticum durum Desf.) was one of the first cereals cultivated worldwide. It is native to the Central-Eastern Africa and eventually it spread to different areas of the world, particularly in the Mediterranean basin and North America, which are the main cultivation areas. In the last forty years, the area planted with wheat decreased progressively (Belaid, 2000).
The global durum wheat is grown on over 12 million hectares (about 5.5% of the world area cultivated with wheat in 2011) (USDA, 2010). The world durum wheat production estimated to be about 35 million metric tons in 2014 (IGC).
Main production areas in 2013 are the European Union, North America and North Africa with 8.0, 6.8 and 4.6 million metric tons respectively. According to recent
20
Andrea Gallo - Assessment of the Climate Change Impact and Adaptation Strategies on Italian Cereal Production using High Resolution Climate Data - Tesi di Dottorato in Agrometeorologia ed Ecofisiologia dei Sistemi Agrari e Forestali - XXVI ciclo - Università degli Studi di Sassari
Table 2. Qualitative classes of winter and spring wheat and their main uses (sources: Baenziger and DePauw, 2009; Mergoum et al., 2009).
Growth habit classes
Classes based on the
qualitative characteristics Main uses
Winter wheat
Soft red and white Cookies, breakfast cereals, cakes, and crackers. Hard red and white Leavened products (e.g., bread).
Soft white Noodles and steam breads.
Spring wheat
Hard red spring (HRS)
Bread wheat with superior milling and baking characteristics.
Soft white (SW) Cakes, crackers, pastries, cookies, quick breads, muffins, and snack foods.
Hard white spring (HRS) Yeast breads, hard rolls, bulgur, tortillas, and oriental noodles.
estimates, the largest producer of durum wheat in 2013 is Canada with about 4.6 million tons, followed by Italy (3.8 million tons), which is the largest exporter in the world (Eurostat, IGC).
The increase in production and reduction in the area cultivated with durum wheat resulted in a global average yield increase over the last forty years (from 1.4 t ha-1 to more than 2 t ha-1).
The European Union is the most important area for durum wheat with a cultivated area of about 2.5 million hectares and a total production of 8.0 million tons in 2013 (Eurostat). The largest producer is Italy followed by France, Spain and Greece. 95% of European Union durum wheat production is produced in these four states (Table 3).
Durum wheat has a high resistance to water scarcity. This makes it possible the growth under rainfed conditions in areas characterized by lower annual rainfall as the Mediterranean basin (Southern Europe, North Africa and West Asia) (Nazco et al., 2012). In these regions the main factors limiting the yield of durum wheat are drought during the grain filling phase, nutritional deficiencies (especially nitrogen), plant diseases, pests, and negative soil properties.
In the Mediterranean region the most widely growth habit is winter durum wheat, while in North America (Canada and USA) spring durum wheat is grown because the climate is continental (long and cold winters, short and hot summers).
21
Andrea Gallo - Assessment of the Climate Change Impact and Adaptation Strategies on Italian Cereal Production using High Resolution Climate Data - Tesi di Dottorato in Agrometeorologia ed Ecofisiologia dei Sistemi Agrari e Forestali - XXVI ciclo - Università degli Studi di Sassari
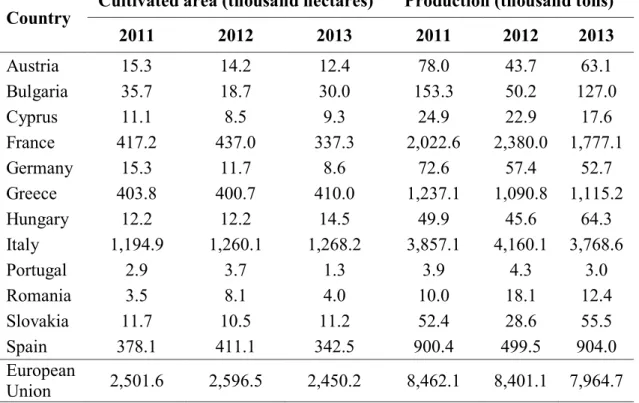
Table 3. Cultivated area and production of durum wheat in the European Union in 2011, 2012 and 2013 (source: Eurostat).
Country Cultivated area (thousand hectares) Production (thousand tons)
2011 2012 2013 2011 2012 2013 Austria 15.3 14.2 12.4 78.0 43.7 63.1 Bulgaria 35.7 18.7 30.0 153.3 50.2 127.0 Cyprus 11.1 8.5 9.3 24.9 22.9 17.6 France 417.2 437.0 337.3 2,022.6 2,380.0 1,777.1 Germany 15.3 11.7 8.6 72.6 57.4 52.7 Greece 403.8 400.7 410.0 1,237.1 1,090.8 1,115.2 Hungary 12.2 12.2 14.5 49.9 45.6 64.3 Italy 1,194.9 1,260.1 1,268.2 3,857.1 4,160.1 3,768.6 Portugal 2.9 3.7 1.3 3.9 4.3 3.0 Romania 3.5 8.1 4.0 10.0 18.1 12.4 Slovakia 11.7 10.5 11.2 52.4 28.6 55.5 Spain 378.1 411.1 342.5 900.4 499.5 904.0 European Union 2,501.6 2,596.5 2,450.2 8,462.1 8,401.1 7,964.7
particular for the production of pasta (80% ), typical breads (about 15%) and other products (e.g., couscous). The Mediterranean countries are major consumers of these products, so they are the main importers of durum wheat.
The increase in the yield of durum wheat in the last century is due to genetic improvement programs that have made possible the gradual replacement of old cultivars with modern varieties in many production areas of durum wheat (Moragues et al., 2006). This fact, combined with the reduced number of ancestors and cultivars currently used, has determined the loss of genetic variability (genetic erosion) (Skovmand et al., 2005). Therefore, the use of modern cultivars could result in an increase of vulnerability to biotic and abiotic stresses (especially drought and high temperatures).
The development of genetic variability for durum wheat is one of the main objectives of current breeding programs. To this end, the International Maize and Wheat Improvement Center (CIMMYT) and the International Center for Agricultural Research in the Dry Areas (ICARDA), play an important role as main centers that operate internationally on durum wheat.
The possibility of exploiting the existing genetic variability is related to the collection of germplasm in gene banks (de Carvalho et al., 2013). In this way, it has
22
Andrea Gallo - Assessment of the Climate Change Impact and Adaptation Strategies on Italian Cereal Production using High Resolution Climate Data - Tesi di Dottorato in Agrometeorologia ed Ecofisiologia dei Sistemi Agrari e Forestali - XXVI ciclo - Università degli Studi di Sassari
been possible to obtain new cultivars with higher and more stable yield, and which are more resistant to biotic (pests and diseases) and abiotic (drought, cold, lodging) stresses and with better qualitative characteristics (De Vita et al., 2007; Royo et al., 2007, 2008; Álvaro et al., 2008). However, the Mediterranean durum wheat landraces retain high variability (especially those in eastern regions), so they can be used to improve the qualitative characteristics of the grain in the modern varieties (Nazco et al., 2012).
Durum wheat in Italy
Italy is the largest producer of durum wheat in Europe contributing 47.3% to total production in the European Union in 2013 (Eurostat). Durum wheat is the second most important cereal after maize in Italy in 2013 with a production of just under 4 million tons, accounting for 23.9% of national cereal production, and its cultivation extending over an area of about 1.3 million hectares (ISTAT).
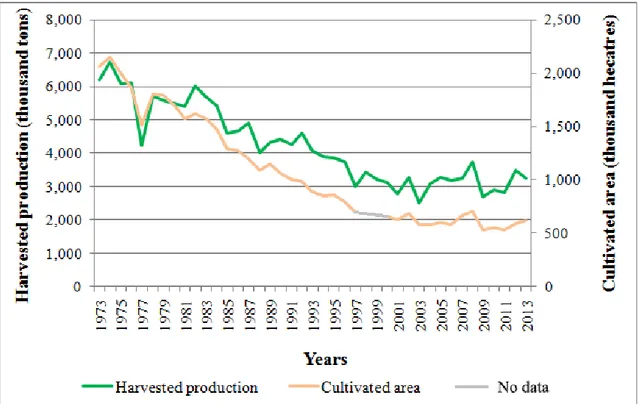
Figure 7 shows that over the past 50 years, Italian production of durum wheat has grown progressively, from 1.8 to 3.8 million tons in the 1963-2013 period (Eurostat). During the same period, the area under cultivation has decreased from 1.4 to 1.3 million hectares. So the yield of durum wheat in Italy has increased from 1.4 to 3.0 t ha-1 (Eurostat).
Figure 7. Trend in the production and cultivated area for durum wheat in Italy in the 1963-2013 period (source: Eurostat).
0 200 400 600 800 1,000 1,200 1,400 1,600 1,800 2,000 0 1,000 2,000 3,000 4,000 5,000 6,000 1963 1966 1969 1972 1975 1978 1981 1984 1987 1990 1993 1996 1999 2002 2005 2008 2011 C ul ti vate d ar ea (th ou san d he ctar es ) H ar ve ste d pr od uc ti on (th ou san d to ns ) Years
23
Andrea Gallo - Assessment of the Climate Change Impact and Adaptation Strategies on Italian Cereal Production using High Resolution Climate Data - Tesi di Dottorato in Agrometeorologia ed Ecofisiologia dei Sistemi Agrari e Forestali - XXVI ciclo - Università degli Studi di Sassari
Durum wheat is the most important cereal in Southern Italy and Islands. According to estimates of 2013, the South-Peninsular and Sicily cultivation areas contribute to 65% of the national production of durum wheat (ISTAT). The most productive regions are Apulia and Sicily with 1.08 and 0.78 million tons respectively. The cultivated area in Southern Italy and Islands has declined since the 1980s (-11.4% between 1981 and 1990 and -5.0% between 1991 and 2000) and this trend was confirmed in the last years (-24.2% between 2001 and 2013) (ISTAT).
Similar trends were observed in the other cultivation areas, except in the North area (+161.2% during the 2001-2013 period). The trend of production over the same period shows a large increase in the North area (+211.3%), an increase in South-Peninsular and Sicily areas (+21.0% and +3.7% respectively) and a decrease in other areas (from -3.4% in the Centre-Italy (Tyrrhenian side) area to -39.4% in the Sardinia area) (Figure 8).
Figure 8. Trend in the durum wheat production in different cultivation areas in Italy from 2001 to 2013 (source: ISTAT).
0 500 1,000 1,500 2,000 2,500 3,000 2001 2002 2003 2004 2005 2006 2007 2008 2009 2010 2011 2012 2013 H ar ve ste d pr od uc ti on (th ou san d to ns ) Years
North Centre-Italy (Tyrrhenian side)
Centre-Italy (Adriatic side) South-Peninsular
24
Andrea Gallo - Assessment of the Climate Change Impact and Adaptation Strategies on Italian Cereal Production using High Resolution Climate Data - Tesi di Dottorato in Agrometeorologia ed Ecofisiologia dei Sistemi Agrari e Forestali - XXVI ciclo - Università degli Studi di Sassari
Given the importance of durum wheat for Italian cereal production, since the beginning of the twentieth century various breeding programs have been launched for this species with the aim of restoring the genetic variability and in order to develop new better varieties in terms of yield and quality. The establishment of gene banks and the availability of a large number of Mediterranean landraces have made it possible to have many crosses (Di Fonzo et al., 2005).
In 1974, the cross between a CIMMYT dwarf line and cv 'Castelfusano' made it possible to obtain the variety 'Creso', characterized by high productivity. As a result, the productivity of durum wheat has reached similar values to those of common wheat. Since the 1980s the Italian gene pool has been enhanced with the introduction of new cultivars such as 'Simeto', 'Duilio', 'Iride', 'Colosseo', 'Ciccio', 'Ofanto', 'Grazia' and others which have spread rapidly nationwide (Di Fonzo et al., 2005).
Considering the amount of certified seeds in 2011, the varieties of durum wheat which are currently the most widespread in Italy are: 'Iride' (12.8%), 'Simeto' (9.6%), 'Saragolla' (8.7%), and 'Claudio' (7.0 %) (INRAN-ENSE).
Common wheat
Common wheat (Triticum aestivum L. ssp. aestivum) is the most important type of wheat in the world, contributing to 95% of global wheat production (Taylor and Koo, 2013). It is native to the Middle East, from which it spread to Europe during the Neolithic era. In the sixteenth century the Spanish introduced it in North America, which has become the largest exporter. Currently it is cultivated on all continents.
World production of common wheat in 2011 is of 659 million tons, according to the International Grain Council (IGC). Main producers are the European Union, China and India, which together contributing to over 45% of global production.
The area cultivated with common wheat in the European Union in 2013 is about 22 million hectares and the production is about 120 million tons (Eurostat). France is the main producer country with 37 million tons in 2013 (30.7% of the total production of the European Union), followed by Germany and the United Kingdom with 25 and 12 million tons respectively (Table 4).
Common wheat is a microtherm crop. Its high resistance to cold explains the spread of this species in regions with temperate and continental climates. Despite this, its cultivation is very important also in countries with a Mediterranean climate. The most widespread growth habit in Europe is winter common wheat (Eurostat).
25
Andrea Gallo - Assessment of the Climate Change Impact and Adaptation Strategies on Italian Cereal Production using High Resolution Climate Data - Tesi di Dottorato in Agrometeorologia ed Ecofisiologia dei Sistemi Agrari e Forestali - XXVI ciclo - Università degli Studi di Sassari
Table 4. Cultivated area and production of common wheat in the European Union in 2011, 2012 and 2013 (source: Eurostat).
Country
Cultivated area (thousand
hectares) Production (thousand tons)
2011 2012 2013 2011 2012 2013 Bulgaria 1,101.8 1,166.3 1,170.0 4,305.2 4,404.9 4,970.0 Czech Republic 805.8 746.0 788.4 4,660.2 3,234.9 4,530.8 Denmark 727.3 583.2 539.5 4,745.6 4,370.8 3,990.0 France 4,975.8 4,866.4 4,958.6 33,887.5 35,540.8 36,662.2 Germany 3,172.8 2,892.7 3,066.2 22,396.3 21,396.6 24,634.1 Hungary 949.9 1,040.5 1,058.3 3,997.0 3,910.1 4,920.8 Italy 531.1 593.5 620.4 2,828.9 3,494.2 3,241.3 Poland 1,931.2 1,373.0 1,872.2 8,272.2 5,949.8 8,558.1 Romania 1,968.3 1,938.7 2,130.6 7,160.9 5,067.4 7,412.4 Spain 1,616.6 1,685.2 1,583.7 5,976.3 4,278.5 5,957.6 United Kingdom 1,969.0 1,992.0 1,615.0 15,257.0 13,261.0 11,921.0 European Union 21,102.9 21,189.5 20,854.3 122,457.7 123,275.4 119,484.8
Common wheat is mainly used for the production of bread (over 60%). The remaining part is used for the production of cakes, biscuits, pasta and other domestic purposes. The countries of the Mediterranean Basin are among the largest consumers of products made from common wheat.
As in the case of durum wheat, in recent decades several breeding programs have been undertaken for common wheat also. Therefore, were developed new cultivars that are more productive and more adaptable to different climatic conditions. CIMMYT and ICARDA are the main international centers involved in the genetic improvement of common wheat. In particular, more than 35% of new cultivars of common wheat were obtained from CIMMYT germplasm, while in marginal areas landraces are still being used (Colombo, 2006).
Common wheat in Italy
Italian production of common wheat in 2013 is 3.2 million tons, corresponding to just under 3% of the European Union total production (Eurostat). Among the different species of cereals grown in Italy, common wheat is in the third place with a cultivated area of about 611 thousand hectares and a production equal to 20.3% of total
26
Andrea Gallo - Assessment of the Climate Change Impact and Adaptation Strategies on Italian Cereal Production using High Resolution Climate Data - Tesi di Dottorato in Agrometeorologia ed Ecofisiologia dei Sistemi Agrari e Forestali - XXVI ciclo - Università degli Studi di Sassari
cereal production (ISTAT).
The national production of common wheat has been decreasing in recent decades, as shown in Figure 9. As can be seen, the annual production of common wheat has been more than halved, going from 6.2 to 3.2 million tons in the 1973-2013 period, while the cultivated area decreased from about 2 million hectares to just over 600 thousand hectares in the same time span (Eurostat). Instead, the yield has increased from 3.0 to 5.2 t ha-1. One of the causes of reduction of the national production of common wheat is the Common Agricultural Policy (CAP) which has been applied since the 1990s and has affected to a great extent common wheat cultivation in Italy. The CAP reform of 2004 (effective from 2005), which introduced the "decoupling" of the prize from production and the "coupling" to the farm area for all crops, has not helped to reverse the trend. At the same time national needs have increased. For this reason Italy is currently one of the main importers of common wheat (USDA, 2012).
Figure 9. Trend in the production and harvested area for common wheat in Italy in the 1973-2013 period (source: Eurostat).
At the sub-national level, common wheat is mostly grown in the North cultivation area, where current production (2013) is about 2.7 million tons, accounting for 77% of national production (ISTAT). Emilia-Romagna is the most productive region with 1.1 million tons, followed by Veneto, Piedmont and Umbria with 0.7, 0.5 and 0.4
27
Andrea Gallo - Assessment of the Climate Change Impact and Adaptation Strategies on Italian Cereal Production using High Resolution Climate Data - Tesi di Dottorato in Agrometeorologia ed Ecofisiologia dei Sistemi Agrari e Forestali - XXVI ciclo - Università degli Studi di Sassari
million tons respectively. Overall, the national cultivation area of common wheat remained unchanged in the 2001-2013 period, but with differences in the various areas (ISTAT). In fact, despite an increase in the North area (+13.2%), a significant reduction was observed in the rest of Italy, especially in the Centre area (-12.0%). Regarding production, an increase of +22.5% was observed between 2001 and 2013, particularly inthe North area, where common wheat production has increased by +42.3% compared to 2001. Conversely, the production trend is decreasing in the Centre area (-21.0) (Figure 10).
Figure 10. Trend in the common wheat production in different cultivation areas in Italy from 2001 to 2013 (source: ISTAT).
The genetic improvement of common wheat carried out in Italy has been important. At the beginning of the twentieth century a large number of crosses were carried out between the cultivar 'Rieti' and local varieties (landraces) or with other cultivars from other countries (Boggini et al., 2011). The first cultivars obtained were not very productive because they were sensitive to the high temperatures during the grain filling. Therefore the main objective of breeding programs was to advance the date of earing and maturity. For this purpose, the Japanese variety 'Akagomughi' was
0 500 1,000 1,500 2,000 2,500 3,000 2001 2002 2003 2004 2005 2006 2007 2008 2009 2010 2011 2012 2013 H ar ve ste d pr od uc ti on (th ou san d to ns ) Years
28
Andrea Gallo - Assessment of the Climate Change Impact and Adaptation Strategies on Italian Cereal Production using High Resolution Climate Data - Tesi di Dottorato in Agrometeorologia ed Ecofisiologia dei Sistemi Agrari e Forestali - XXVI ciclo - Università degli Studi di Sassari
used, thus obtaining the cultivars 'Ardito, 'Damiano', 'Chiesa', 'Mentana', and 'Villa Glori', which became widespread in Italy and other countries. The variety 'San Pastore' was developed in 1929, which remained the most cultivated type in Italy for over 35 years and it has been used as a parent to obtain new cultivars (Boggini et al., 2011).
In recent decades new cultivars such as 'Aubusson', 'Bologna', 'Africa', 'Bolero', 'Bilancia', 'PR22R58', 'Mieti', 'Blasco', 'Palesio', 'Aquilante' and 'Antille' have been successfully introduced in Italy.
The most spread cultivars of common wheat at the national level in 2011 are 'Bologna' (17.2%), 'Aubusson' (10.8%), 'PR22R58' (6.7%), and 'Mieti' (4.4%) (INRAN-ENSE).
1.1.3 Maize production
Maize (Zea mays L.) is a cereal native to tropical and sub-tropical America. It was identified for the first time in Southern Mexico, from where it spread in North and South America and later in other continents. The introduction of maize in Europe came after the discovery of the Americas, but only the precocious forms, those indifferents to the photoperiod native of the tropical area, and those originating from regions with a photoperiod similar to that of the Mediterranean Basin have adapted to the climatic conditions of the Euro-Mediterranean area (Lorenzoni and Marocco, 2008). The continuous process of domestication and genetic improvement programs implemented has allowed the increase in number of varieties that can be used in different geographical areas.
Maize has high water requirements, so it is very sensitive to drought, especially in 50-60 days during the period of flowering. A prolonged water shortage in this period will significantly impair production. An example is given by the substantial loss of production that occurred in Europe in 2003, particularly in France (COPA-COGECA, 2003). For this reason, generally maize is grown in areas equipped for irrigation and in which rainfall contributes to a great extent to the crop water balance during the growing season.
One of the most common classifications of maize is that of Sturtevant modified by Kuleshov, based on the types of kernels. Based on this classification, the maize is divided into eight subspecies listed in Table 5 (Hallauer et al., 2010). Zea mays L. ssp. indentata is the most productive subspecie.
29
Andrea Gallo - Assessment of the Climate Change Impact and Adaptation Strategies on Italian Cereal Production using High Resolution Climate Data - Tesi di Dottorato in Agrometeorologia ed Ecofisiologia dei Sistemi Agrari e Forestali - XXVI ciclo - Università degli Studi di Sassari
Table 5. Subspecies of Zea mays L. according to type of kernels and related description (source: Hallauer et al., 2010).
Group Description
Zea mays L. ssp. indurata Flint corn Zea mays L. ssp. amylacea Soft corn Zea mays L. ssp. indentata Dent corn Zea mays L. ssp. everta Pop corn Zea mays L. ssp. saccharata Sweet corn
Zea mays L. ssp. amylea saccharata Starchy-sugary corn Zea mays L. ssp. ceratina Waxy corn
Zea mays L. ssp. tunicata Pod corn
each year new hybrids that can adapt to various pedoclimatic conditions are available, thus favoring the spread of maize in areas where it did not previously exist or it was not much cultivated. Secondly, maize can have multiple uses (Dell'Orto et al., 2008). In fact, the high carbohydrate content (about 65% starch) provides a high energy value to maize that makes it suitable for human consumption (especially in developing countries) and for animal feed (in particular maize silage). Finally, maize can be used as an bioenergy crop for the production of thermal energy and/or electricity through combustion or anaerobic digestion and for the production of ethanol through fermentation. Considering the increase in population and consumption of food of animal origin, the food demand for maize has increased significantly in recent years (Delgado, 2003). Therefore maize is a very important cereal for food security (Shiferaw et al., 2011).
According to global FAO estimates for 2014, maize is mainly used for animal feed (about 56.9% of total use) and in lower quantities for human consumption (just over 30%), while only a small fraction (about 10%) is used for other purposes.
Maize is cultivated on an area of about 177 million hectares and is the cereal crop with highest global production, approximatively equal to 868.8 million metric tons in 2013 (FAO, 2014a; USDA, 2014). The main producers are the United States and China (31.5% and 23.7% of global production), followed by Brazil (9.4%) and the European Union (6.8%) (Table 6). These four producers contribute to slightly more than half of the total world area sown with maize.
The European Union is the world's fourth largest producer of grain maize in 2013 with a cultivated area of about 9 million hectares and a production of 59 million tons (Table 7). France is the first European producer of maize in 2013 (23.1% of total
30
Andrea Gallo - Assessment of the Climate Change Impact and Adaptation Strategies on Italian Cereal Production using High Resolution Climate Data - Tesi di Dottorato in Agrometeorologia ed Ecofisiologia dei Sistemi Agrari e Forestali - XXVI ciclo - Università degli Studi di Sassari
Table 6. Maize world production in 2011, 2012, 2013 and estimates for 2014 (millions of metric tons) (source: USDA).
Country 2011 2012 2013 2014 (estimate) Argentina 25.2 21.0 27.0 24.0 Brazil 57.4 73.0 81.5 76.0 Canada 12.0 11.4 13.1 14.2 China 177.2 192.8 205.6 217.7 Ethiopia 4.9 6.1 6.2 6.5 European Union 58.3 68.1 58.9 64.6 India 21.7 21.8 22.3 24.2 Indonesia 6.8 8.9 8.5 9.1 Mexico 21.1 18.7 21.6 21.9 Nigeria 8.8 9.3 7.6 7.7 Philippines 7.3 7.1 7.3 7.7 Russia 3.1 7.0 8.2 11.6 Serbia 6.8 6.4 3.8 6.4 South Africa 10.9 12.8 12.4 14.5 Ukraine 11.9 22.8 20.9 30.9 USA 316.2 313.9 273.8 353.7 Others 86.3 88.4 90.3 91.1 Worldwide 835.92 889.3 868.8 981.9
Table 7. Cultivated area and production of grain maize in the European Union in 2011, 2012 and 2013 (source: Eurostat).
Country Area (thousand hectares) Production (thousand tons)
2011 2012 2013 2011 2012 2013 Bulgaria 399.4 466.8 420.0 2,209.2 1,717.8 2,300.0 Czech Republic 121.0 119.3 96.9 1,063.7 928.1 675.4 France 1,596.7 1,718.6 1,849.6 15,914.1 15,614.1 15,053.0 Germany 487.9 526.2 497.0 5,183.6 5,514.7 4,387.3 Greece 181.9 184.0 190.0 2,165.8 2,009.8 2,185.0 Hungary 1,230.3 1,191.3 1,254.0 7,992.4 4,762.7 6,724.8 Italy 994.8 976.6 808.3 9,752.6 7,888.7 6,503.2 Poland 333.3 543.8 613.9 2,392.1 3,995.9 4,041.9 Romania 2,604.9 2,748.3 2,593.8 11,671.9 5,949.3 11,434.9 Slovakia 202.0 212.3 219.2 1,444.4 1,170.4 1,133.6 Spain 369.3 390.2 440.9 4,199.9 4,261.4 4,853.6 European Union 9,302.0 9,854.0 9,752.0 70,620.0 59,745.7 65,240.9
31
Andrea Gallo - Assessment of the Climate Change Impact and Adaptation Strategies on Italian Cereal Production using High Resolution Climate Data - Tesi di Dottorato in Agrometeorologia ed Ecofisiologia dei Sistemi Agrari e Forestali - XXVI ciclo - Università degli Studi di Sassari
production), followed by Romania (17.5%), Hungary (10.3%) and Italy (10.0%) (Eurostat).
Figure 11 shows the progressive increase in maize production and cultivated area in the European Union over the last 40 years. Therefore, the annual yield has increased substantially (from 3.7 to 6.7 t ha-1 from 1963 to 2013) (FAO, 2014a). The genetic improvement programs and the introduction of more productive hybrids, resistant to biotic and abiotic factors were the key elements for the increase in maize yields and most likely it will be so in the coming decades so as to meet the increasing food needs related to world population growth and to cope with the reduction in yield due to climate change. In fact, an overall yield decrease from 3% to 10% by 2050 is expected for maize (Rosegrant et al., 2009).
Figure 11. Trend in the production and harvested area for maize in the European Union during the 1963-2013 period (source: FAO, 2014a).
Until the early 1930s mass selection was the only technique of genetic improvement for maize, but the increase in yield was very slow over time. The varieties of the U.S. Corn Belt developed in the second half of the nineteenth century have been the basis for highly productive varieties currently available in temperate climate areas
0 2 4 6 8 10 12 0 10 20 30 40 50 60 70 80 1963 1965 1967 1969 1971 1973 1975 1977 1979 1981 1983 1985 1987 1989 1991 1993 1995 1997 1999 2001 2003 2005 2007 2009 2011 2013 C ul ti vate d ar ea (m il li on h ec tar es ) H ar ve ste d pr od uc ti on (m il li on to ns ) Years
32
Andrea Gallo - Assessment of the Climate Change Impact and Adaptation Strategies on Italian Cereal Production using High Resolution Climate Data - Tesi di Dottorato in Agrometeorologia ed Ecofisiologia dei Sistemi Agrari e Forestali - XXVI ciclo - Università degli Studi di Sassari
(Lorenzoni and Marocco, 2008). A significant increase in yield was obtained with the use of hybridization techniques since the early 1930s (Duvick, 2005). Modern hybrids have also other advantages as compared to older hybrids, namely higher plant height (hence greater resistance to lodging), larger ears, greater stay green and greater resistance to abiotic and biotic stress factors (Duvick, 2005; Lorenzoni and Marocco, 2008). The most spread hybrids in the trade are simple hybrids [A x B] and double hybrids [(A x B) x (C x D)].
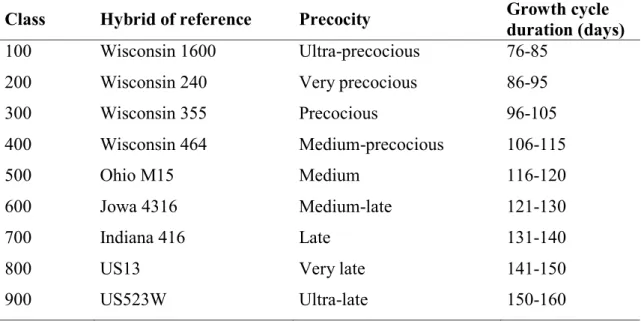
Currently the most used classification for maize hybrids is that of the FAO based on precocity (Table 8). The most precocious hybrids (classes 200 and 300) are used only in the case of spring dry sowing. The hybrids of intermediate precocity (classes 400, 500 and 600) are the most suitable for the production of grain. The late hybrids (classes 700, 800 and 900) are the most suitable for forage production.
Table 8. Classes of the maize hybrids based on the precocity (FAO classification).
Class Hybrid of reference Precocity Growth cycle duration (days)
100 Wisconsin 1600 Ultra-precocious 76-85 200 Wisconsin 240 Very precocious 86-95
300 Wisconsin 355 Precocious 96-105
400 Wisconsin 464 Medium-precocious 106-115
500 Ohio M15 Medium 116-120
600 Jowa 4316 Medium-late 121-130
700 Indiana 416 Late 131-140
800 US13 Very late 141-150
900 US523W Ultra-late 150-160
The conservation of germplasm in gene banks is fundamental for the evolution and implementation of breeding programs. The largest collection of maize germplasm in the world is that of CIMMYT with over 20,000 varieties from all over the world. Notwithstanding the commercial importance of the modern hybrids, it is necessary to point out the importance of maize landraces, as they represent a genetic resource that can be used to obtain better hybrids, with higher adaptability to different climatic conditions (Rebourg et al., 2003).
33
Andrea Gallo - Assessment of the Climate Change Impact and Adaptation Strategies on Italian Cereal Production using High Resolution Climate Data - Tesi di Dottorato in Agrometeorologia ed Ecofisiologia dei Sistemi Agrari e Forestali - XXVI ciclo - Università degli Studi di Sassari
Maize in Italy
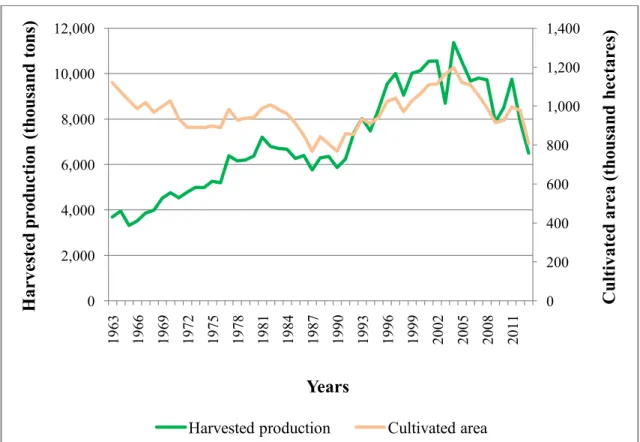
Italy is the fourth largest producer of maize in the European Union with about 6.5 million tons in 2013, accounting to 10.0% of total production (Eurostat). At the national level, maize is the most important cereal contributing to 38.5% of Italian cereal production and it is the second crop in terms of cultivation area, with about 800 thousand hectares dedicated to its production (ISTAT).
The national maize production has been increasing rather regularly, as shown in Figure 12. Since 2005, with the implementation of the reform of the Common Agricultural Policy (CAP), the cultivated area with maize has decreased leading to reduced production. Over the past 50 years, the Italian production of maize has increased of +76.1% because the yield has increased significantly from 2.9 to 8.1 t ha-1 in the 1963-2013 period, offsetting the decrease of the cultivated area, equal to -27.9% (Eurostat). The increase in yield in recent decades is due to the replacement of old varieties with hybrids and the improvement of cultivation techniques (Lorenzoni and Marocco, 2008).
Figure 12. Trend in the cultivated area and production of maize in Italy in the 1963-2013 period (source: Eurostat).
0 200 400 600 800 1,000 1,200 1,400 0 2,000 4,000 6,000 8,000 10,000 12,000 1963 1966 1969 1972 1975 1978 1981 1984 1987 1990 1993 1996 1999 2002 2005 2008 2011 C ul ti vate d ar ea (th ou san d he ctar es ) H ar ve ste d pr od uc ti on (th ou san d to ns ) Years
34
Andrea Gallo - Assessment of the Climate Change Impact and Adaptation Strategies on Italian Cereal Production using High Resolution Climate Data - Tesi di Dottorato in Agrometeorologia ed Ecofisiologia dei Sistemi Agrari e Forestali - XXVI ciclo - Università degli Studi di Sassari
In Italy maize is grown mainly in the plains of Northern Italy (Po Valley) where the greater availability of water resources enables irrigation during the summer. Sowing usually takes place between the end of March and mid-May, while harvest is carried out between the beginning of September and the end of October.
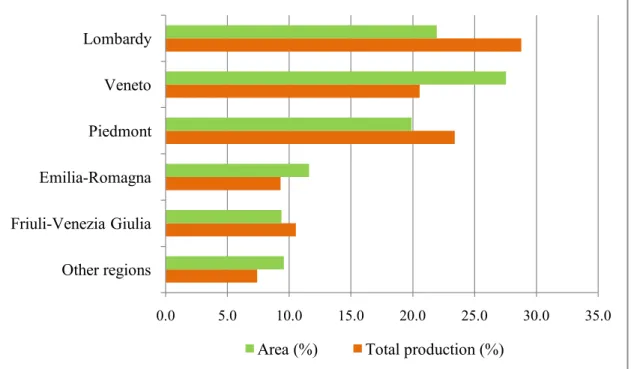
The regions with the highest maize production in 2012 are Lombardy and Veneto with 2.3 and 1.6 million tons respectively (Figure 13). Together, these two regions contribute to 49.4% of national maize production. Other producers are Piedmont (23.4%), Friuli-Venezia Giulia (10.5%) and Emilia-Romagna (9.3%) (ISTAT). There is little production of this crop in the Centre-South of Italy (7.4% of Italian production and 9.6% of the total cultivated area). This is due to the poor rains during great part of the crop cycle, thus resulting in lower and unstable yields.
Figure 13. Cultivated area and total production for maize in Italy in 2012 (% of total) (source: ISTAT).
The cultivated area with maize in Italy has declined over the 2001-2012 period (-11.8%), particularly in Friuli-Venezia Giulia (-27.7%), Lombardy (-24.7%) and the Centre-South (-30.4%). Figure 14 shows the trends for the production during the same period. National production has decreased by about 26%, while at the regional level the largest decrease was observed in Veneto (-41.6%) and the Centre-South (-42.6%) (ISTAT). 0.0 5.0 10.0 15.0 20.0 25.0 30.0 35.0 Other regions Friuli-Venezia Giulia Emilia-Romagna Piedmont Veneto Lombardy
35
Andrea Gallo - Assessment of the Climate Change Impact and Adaptation Strategies on Italian Cereal Production using High Resolution Climate Data - Tesi di Dottorato in Agrometeorologia ed Ecofisiologia dei Sistemi Agrari e Forestali - XXVI ciclo - Università degli Studi di Sassari
Figure 14. Trends in the regional maize production in Italy from 2001 to 2012 (source: ISTAT).
Regarding its use, most of the maize produced in Italy (about 90%) is used for animal feed as simple or compound feed (maize silage, mash silage and cobs, dry grain). Each year, 8% of available maize in Italy is used for the production of starch that is used by the food industry (production of sweets and drinks), for feed production of (corn gluten meal and feed) and in other industrial sectors (paper, chemical and pharmaceutical industries). A small fraction of the production is used for human consumption (as an ingredient in salads, corn flakes, popcorn, flour for polenta), the production of vegetable oil and for energy uses (production of ethanol and biogas) (USDA, 2012).
The maize germplasm in Italy is one of the most important in the world because it includes many varieties (hybrids and landraces). Initially, traditional varieties were cultivated, mainly for human consumption. The spread of hybrids dates back to the 1950s with the introduction of the U.S. varieties of Zea mays L. ssp. dentata, which were much more productive than the traditional ones. Thus, the traditional varieties were quickly replaced by hybrids (Leng et al., 1962; Brandolini et al., 2008).
0 500 1,000 1,500 2,000 2,500 3,000 3,500 4,000 2001 2002 2003 2004 2005 2006 2007 2008 2009 2010 2011 2012 H ar ve ste d pr od uc ti on (th ou san d to ns ) Years Lombardy Veneto Piedmont Emilia-Romagna
36
Andrea Gallo - Assessment of the Climate Change Impact and Adaptation Strategies on Italian Cereal Production using High Resolution Climate Data - Tesi di Dottorato in Agrometeorologia ed Ecofisiologia dei Sistemi Agrari e Forestali - XXVI ciclo - Università degli Studi di Sassari
One of the first research centers involved in the genetic improvement of maize in Italy was the Maize Section of Bergamo of the Istituto Sperimentale per la Cerealicoltura (currently the Unità di Ricerca per la Maiscoltura of the Consiglio per la Ricerca e la Sperimentazione in Agricoltura). As a result of hybridization techniques, maize it has spread in various areas thus becoming the first cereal for production (Sismondo, 2008). The old varieties of Zea mays L. ssp. indurata are still grown at higher altitudes and are used to produce flour for the polenta (Venturelli et al.,1990).
In the northern regions the best hybrids are those classified as FAO 600 and 700, while in Central Italy the medium-precocious hybrids (FAO classes 400 and 500) provide better results, due to the limitations on the use of irrigation.
Since several years, the Unità di Ricerca per la Maiscoltura of the Consiglio per la Ricerca e la Sperimentazione in Agricoltura (formerly Istituto Sperimentale per la Cerealicoltura) is involved in the national experimentation of maize hybrids marketed in Italy. Tests concern hybrids of different FAO classes and they are carried out every year for different sowing densities, for different levels of nitrogen fertilization, for different irrigation regimes and for different pesticide treatments.