1
This is the authors’ accepted manuscript of Dugato, Marco, Francesco Calderoni, and Gian Maria
Campedelli. 2019. “Measuring Organised Crime Presence at the Municipal Level.” Social
Indicators Research, August.
https://doi.org/10.1007/s11205-019-02151-7
.
https://link.springer.com/article/10.1007%2Fs11205-019-02151-7
The content of this documents should not be disseminated or disclosed without written authorization
by the authors.
Measuring organised crime presence at the municipal level
Authors
Marco Dugato ([email protected]) – Corresponding author
Università Cattolica del Sacro Cuore – Transcrime, Milan, Italy
Largo gemelli, 1 20123 – Milan, Italy Francesco Calderoni
Università Cattolica del Sacro Cuore – Transcrime, Milan, Italy
Gian Maria Campedelli
Università Cattolica del Sacro Cuore – Transcrime, Milan, Italy
1
Abstract
While indicators assessing the quality of life often comprise measures of crime or fear of crime, these components usually refer to property or violent crimes. More complex crimes, which may significantly impact on the social, economic, and political conditions of local communities, are often overlooked, mostly due to problems in adequately measuring the levels of e.g. organised crime and corruption. Indeed, despite the growing scholarly attention, measurements of organised crime are rare and frequently affected by important methodological limitations.
This study addresses this issue by proposing the Mafia Presence Index (MPI), a composite indicator measuring the presence of the mafias in Italy. The MPI aggregates variables measuring different dimensions of mafia presence, namely the presence and activities of mafia groups, mafia violence, and infiltration in politics and the economy. Furthermore, the analysis explores the validity and robustness of the MPI by considering possible alternative variables and by assessing the impact of different calculation strategies.
Results show that the MPI is a parsimonious and consistent measure of mafia presence, relying on a core set of five variables directly related to mafia presence. The index is also robust to different calculation methods and is negatively associated with the most popular indexes measuring the quality of life in Italy.
2
Measuring organised crime presence at the municipal level
2 Introduction
Most of the indicators assessing the quality of life include some measures of crime or fear of crime (Land, Michalos, & Sirgy, 2012; Michalos, 2014; Michalos & Zumbo, 2000). However, almost all of these efforts consider property or violent crimes, such as thefts, robberies, assaults or homicides. The assumption is that direct threats to the personal safety of individuals or their assets impact on the actual or perceived conditions and well-being of a given population. Nevertheless, almost all of these studies overlook the influence that other more complex crimes may have on the everyday lives of people. In particular, an extensive presence of organised crime groups can increase the risk for the personal safety of a population both directly, causing high levels of violence (Decker & Curry, 2002; Rios, 2013), or indirectly, favouring the spread of illicit markets affecting the health of the witting of unwitting consumers (Reynolds & McKee, 2010; Riccardi, Dugato, & Polizzotti, 2014). Moreover, it may undermine economic development and damage the social fabric by favouring corruptive or illicit behaviours (Savona, Riccardi, & Berlusconi, 2016). The limited attention to complex crime in social indicators research is probably due to problems with the definition and measurement of concepts such as corruption and organised crime, despite the increasing scholarly attention to these issues.
Attention to organised crime has significantly grown in the second half of the twentieth century. While scholars have debated for years about the nature and definition of organised crime (Smith, 1975; Woodiwiss, 2001; Von Lampe, 2016), several policies have been implemented at the international (e.g. the United Nations Convention against Transnational Organized Crime), regional (e.g. the European Union Framework Decision 2008/841/JHA on the fight against organised crime) and national levels (a number of national offences, enhanced confiscation policies and other preventive measures). Nevertheless, efforts to measure the presence and activities of organised crime systematically are rare, probably because of the remarkable challenges of this endeavour.
The development of cross-national measures of organised crime face several challenges (Savona, Dugato, & Garofalo, 2012; Dugato, De Simoni, & Savona, 2014). Studies by Buscaglia and Van Dijk (2003) and by Van Dijk (2007) developed a Composite Organized Crime Index (COCI) by combining data on the perceived prevalence of organized crime, unsolved homicides, grand corruption, money-laundering, and the black economy across more than 100 countries. The aim was to explore the interrelations among organized crime, law enforcement, rule of law and economic development. While the global scope of the analysis made the study particularly innovative, the heterogeneity of the legal systems and counting rules, and the reliance on perception surveys inevitably affected the results (Neapolitan, 1996; Roberts, 1992). The problem of measuring crime using subjective indicators has been addressed also in relation to other crimes like corruption (Sampford, Shacklock, Connors, & Galtung, 2006). Europol, the European Union law enforcement agency, has regularly published reports on organised crime. Europol’s latest Serious and Organised Crime Threat Assessment has identified more than 5,000 organised crime groups in the EU, mainly composed of six or more members, mostly EU nationals (Europol, 2017, p. 15). The assessment relies on the information gathered by Europol, and groups must meet the definition of the EU Framework Decision on the fight against organised crime. However, the public version of the report does not provide more details on the geographic distribution and on the activities of the specific groups. Overall, the paucity of cross-national measures may be due to the difficulties in establishing common operational definitions across different legal systems and the associated challenge in gathering comparable data beyond perception-based indicators.
3
Assessments at the national level are more abundant than the few cross-national measurements, mostly due to the availability of criminal justice or police data or other measurement strategies. Some studies have derived the presence of organised crime groups from official crime data. For example, Ferwerda and Unger analysed the complete database of offences by the Dutch Public Prosecution for the 2003-2014 period (2016). They identified a total 3,924 criminal groups comprising more than 11 thousand suspects and grouped them by their prevalent ethnicity, with 68% of the groups mainly composed of Dutch nationals. Yet the study did not provide a geographic distribution of the groups across the country. Meško and colleagues analysed the yearly number of criminal charges with signs of organised crime in Slovenia between 2000 and mid-2014 (2015; Slak, Modic, Eman, & Ažman, 2016). Annual figures varied remarkably, ranging between 200 and over 500 units per year, although there was no regional breakdown. Other studies have relied on organised crime groups identified by the law enforcement agencies. For example, the Spanish criminal intelligence agency CITCO annually reports on the number of organised crime groups identified. The most recent report by the CITCO identified 444 groups in Spain in 2016, providing a breakdown by region (Ministerio del Interior & CITCO, 2017). Palomo et al. (2016) analysed the groups classified in 2012 and 2013 into three intensity levels (Palomo, Márquez, & Laguna, 2015). The group total remained slightly below 500 in each year, although high intensity groups were 37 and 29 in 2012 and 2013, respectively. The law enforcement agencies of England and Wales have implemented a specific methodology for the mapping and assessing of organised crime groups (Gilmour, 2008; OCPB, 2010). The most recent figures by the UK National Crime Agency reported 5,866 active groups involving more than 39 thousand individuals (NCA, 2017, p. 9). Several assessments of these practices have reported inconsistencies in the mapping exercise across police forces, e.g. the large variations in the standardized number of active groups identified across police forces (between 8 and 145 per million population) (HMIC, 2015, 2017). Campana and Varese have proposed complementing this assessment exercise with an index measuring the extent to which organised crime groups identified by UK police forces engage in illegal governance (2018). When specific official crime data or groups counts are unavailable, researchers have developed several strategies. Mexico is an interesting example, as scholars have proposed measurements relying on group counting through the analysis of national and local newspapers (Guerrero-Gutiérrez, 2011, p. 29; Coscia & Rios, 2012), elaboration of composite indicators (Dugato et al., 2014), or group identification from original datasets recording organised crime-related events (Atuesta & Ponce, 2017; Atuesta, Siordia, & Madrazo Lajous, 2016). Overall, the national assessments show remarkable heterogeneity in the methods and results of the measurements. Inevitably, these attempts are influenced by the legal and operational definitions, by data availability and reliability, and by subjective assessments. For example, the largest estimates for Mexico (about 1.7 groups per million inhabitants) reported 217 different criminal organisations for the 2006-2011 period (Atuesta & Ponce, 2017, n. 69), whereas Ferwerda and Unger yield an annual average of 327 groups in the Netherlands (about 19.2 per mln inhab.), the Spanish CITCO counted around 500 groups annually (about 10.9 per mln inhab.) and the UK NCA reported over 5,000 groups (about 76.9 per mln inhab.).
Measurement of the presence of mafias is particularly important for Italy. The country has been infamously labelled as one of the cradles of organised crime worldwide (Antonopoulos & Papanicolaou, 2018; Paoli, 2003). The Italian mafias comprise four main syndicates (the Sicilian Cosa Nostra, the Calabrian ‘Ndrangheta, the Campanian Camorra and Apulian mafias) which originated in four different southern regions, with historical roots dating back to at least the nineteenth century (Ciconte, 1992; Lupo, 1993; Massari, 1998; Barbagallo, 2010). Despite the social and cultural differences, the Italian mafias also share common characteristics in terms of both criminal activities and modi operandi (Berlusconi, 2014; Paoli, 2014). In recent decades, growing evidence and lively public debate have pointed out the progressive expansion of these mafias, which have moved from their traditional areas to other Italian regions (Commissione parlamentare antimafia, 1994; Sciarrone, 1998; Varese, 2006; Sciarrone & Dagnes, 2014). And even more recently, the literature has also focused
4
on the transnational movements of the mafias to other countries in the world (Varese, 2006; Campana, 2011; Varese, 2013; Allum, 2014; Sciarrone & Storti, 2014; Calderoni, Berlusconi, Garofalo, Giommoni, & Sarno, 2015; Sergi, 2015). With the growing concern about the movements of the Italian mafias to other regions and countries, several recent studies attempted to systematically measure the mafias’ presence in Italy. Nevertheless, most attempts focused at the regional or provincial level, comprised a short time span, and included heterogeneous sources. To date a systematic and methodologically sound measurement of the diffusion of the mafia at the level of Italian municipalities is still lacking. As a consequence of this limited knowledge, policies to prevent and tackle the mafias may be inadequately targeted and fail to achieve their objectives, with negative impacts on the Italian society. Indeed, several studies have highlighted the influence of the mafias on the Italian culture, economy and politics (Lavezzi, 2008; V. Daniele & Marani, 2011; Albanese & Marinelli, 2013; Lavezzi, 2014; Pinotti, 2015; Moro, Petrella, & Sberna, 2016; Moro & Sberna, 2017; Caglayan, Flamini, & Jahanshahi, 2017). Systematic and methodologically sound measurements of mafia presence in Italy could improve the performance of antimafia policies, which are currently applied homogeneously across the country (Mete, 2009; Calderoni & Di Stefano, 2015).
Also the existing attempts to measure well-being in the Italian provinces and regions ignore this criminal issue. The Equitable and Sustainable Well-being indicators (“Benessere Equo e Sostenibile” BES) developed by ISTAT and CNEL (2017) and the Quality of Life indexes edited yearly by the business newspapers Il Sole 24 ORE (2017) and ItaliaOggi (2017) overlook any mafia-related measure and only focus on general crime rates. Given the growing research on the mafias’ impact on the society, the omission may impede accurate interpretation of living conditions across the Italian country.
This study addresses this gap by developing the Mafia Presence Index (MPI) as a composite indicator capturing the different dimensions (presence and activities, violence, political, and economic infiltration), by selecting the most appropriate variables, and by testing the robustness and reliability of the MPI. The results show that the MPI provides a parsimonious and effective measurement of mafia presence at the municipal level, relying on a core of only five indicators: reported mafia associations, reported mafia murders and attempted mafia murders, active mafia groups mentioned in official reports, city councils dissolved for mafia infiltration, and assets confiscated from organized crime. Exploration of alternative indicators shows that the five core indicators are correlated, whereas possible alternatives are not, suggesting that they may poorly capture the actual presence of the mafias or potentially bias the final measurement. Furthermore, the MPI is a reliable index, robust to variations of the calculation method. The rest of this article is structured as follows: the next section discusses the existing measurements of mafia presence in Italy and their limitations. The third section sets out the methodology for the construction of the MPI and for the robustness checks, while the fourth presents the results. The last section discusses the findings and concludes.
3 Measures of mafia presence in Italy
Despite the importance of the Italian mafias, scholars have adopted a variety of approaches to measure their presence. Empirical research in various fields has proxied for mafia presence by means of very different strategies, but almost always focusing only on one dimension of the mafia presence. For example, and in regard to only more recent studies, the literature has proxied for mafia presence by using murders or mafia murders (Centorrino & Ofria, 2008; Pinotti, 2015), mafia criminal associations (Barone & Narciso, 2012; Pinotti, 2015; Solivetti, 2016), city councils dissolved for mafia infiltration (Barone & Narciso, 2012; Coniglio, Celi, & Scagliusi, 2010). In a few studies, mafia presence has been measured through a mix of different variables, often selected using statistical methods (Mennella, 2009; Asmundo, 2011;
5
Capuano & Purificato, 2012; Caglayan et al., 2017; Ganau & Rodríguez‐Pose, 2017). This variety of approaches is likely to affect the reliability and comparability of the findings. Studies focusing on a single proxy variable may overlook the complexity and multidimensionality of the mafias (Sciarrone, 2009). Conversely, studies aggregating different variables may run into methodological issues when developing a synthetic indicator and may risk mixing direct measures of mafia presence (e.g. mafia murders) with other more indirect ones (e.g. extortion, an offence which may be committed by anyone). The existing literature provides a few insightful examples of the most recurrent problems (see also Calderoni, 2011 for further discussion).
First, studies may encounter problems of content validity: that is, whether the selected measures cover the full meaning of the object to be measured (Bachman & Schutt, 2010, p. 95). For example, the Italian National Institute of Statistics (ISTAT) developed the Organised Crime Index (OCI) to measure the presence of OC at regional level from 1995 to 2005 (ISTAT, 2010). The OCI included mafia murders, attacks, arsons and serious robberies. Whereas mafia murders are direct measures of mafia presence, the other variables are not uniquely related to mafia activities. Similarly, Daniele and Marani (2011) elaborated the Index of Organized Crime (IOC), which comprised extortions, arsons, bomb attacks and mafia association. Except for mafia association, all other offences are not exclusively committed by mafias. Furthermore, extortion may be affected by the problem of the ‘dark number’, i.e. underreporting, and particularly in areas of strong mafia presence (Asmundo & Lisciandra, 2008; Wittebrood & Junger, 2002). Overall, while the peculiarly secretive nature of mafia activities makes it particularly hard to find direct measures, caution is warranted in the use indirect measures because they may bias the results.
Second, choices of time and geographic coverage may affect the reliability and validity of the measurements. A number of studies have measured mafia presence across a relatively short time period. For example, Mennella (2009) focused only on 2004 data, Censis (2009) on data between 2004 and 2007, Barone and Narciso (2015) on the 2004-2009 period. Sometimes, the exact time span is not even specified (CROSS, 2014). Adopting a short time frame may affect the reliability of the measurement by emphasizing the role of indirect variables with higher frequencies (e.g. volume crimes such as robberies) and possibly omitting offences more directly related to mafia presence albeit with lower frequencies (e.g. mafia murders). The geographic coverage of mafia measurement may also pose significant problems. Like most crimes (Weisburd, 2015), and indeed like most social phenomena (the Pareto principle), mafia presence is likely to be concentrated in space. Measurements across the 20 Italian regions may disregard concentration of the mafias in smaller areas (V. Daniele & Marani, 2011; ISTAT, 2010). Furthermore, some studies have focused on only a few regions or provinces, thus making it impossible to compare mafia presence across the entire Italian country (Eurispes, 2004, 2007, 2008; CROSS, 2014).
Finally, the methods of aggregation often raise doubts about the quality of the measurement. For example, ISTAT’s OCI summed the absolute values of the selected crimes and weighted them by the average statutory penalty. The procedure inevitably emphasizes offences with higher frequencies which are only partially (and imperfectly) compensated by the weighting. Similarly, Mennella (2009) summed different crimes before computing the crime rates, leading to a measurement biased in favour of the most frequent offences. In some occasions, there is scarce information on the aggregation method. For example, a report for the Presidency of the Italian Antimafia Parliamentary Commission considers the number of mafia groups, mafia murders and confiscated assets (CROSS, 2014). However, it is unclear how the data have been aggregated, and the report explicitly states that the scores have been adapted and should be interpreted as a “subjective synthesis” (CROSS, 2014, p. 9).
6
Overall, studies measuring mafia presence in Italy have often faced problems relating to the selection of the adequate variables, appropriate geographic and time coverage, and sound aggregation methods. To address these issues, Calderoni (2011) proposed a composite indicator of mafia presence (the Mafia Index), covering the 1983-2010 period and ranking the 103 Italian provinces. The MI ranges from 0 to 100 and is the arithmetic mean of the normalised rank of the provinces for the rates of mafia associations, mafia murders, city councils dissolved for mafia infiltration and assets confiscated from organised crime. The study also suggested that the MI was robust to different specifications and was more parsimonious than other procedures. Furthermore, the variables included in the MI were direct proxies of mafia presence, thus avoiding the above-discussed issues with indirect proxies. A subsequent study by Transcrime for the Italian Ministry of Interior updated and expanded the MI (Calderoni, 2014; Transcrime, 2013). The result was composite indicator (Indice
di presenza mafiosa (IPM), i.e. mafia presence index) at the municipal level for the period 2000-2011. The IPM was
obtained through the arithmetic mean of the normalised rates of: reported mafia murders and attempted mafia murders; people reported for mafia association; city councils and public bodies dissolved for mafia infiltration; assets confiscated from criminal organizations; mafia groups mentioned in Italian anti-mafia authorities’ reports. The MI and the IPM provided synthetic measures of the mafia presence in Italy through parsimonious and clearly replicable methodologies. The MI and the IPM paved the way for methodologically transparent measurement of mafia presence in Italy. Several studies have used these composite indicators to analyze the impact of the mafias empirically. Caneppele and colleagues (2013) included the IPM as a proxy variable for OC presence in Italian regions in an analysis on mafia investments in the wind power sector. Focusing on a specific criminal activity, Riccardi and colleagues (2014) employed the MPI as a measure for mafia presence as a contextual factor related to the theft of medicines from Italian hospitals. Dugato et al. (2015) adapted the index to investigate how Italian mafias invest in the real estate sector. Schulz (2017) utilized the MI to investigate the relation between kin-groups and the functioning of formal institutions. Sberna and Olivieri (2014) and Daniele and Dipoppa (2017) relied on the MI as a measure for studying how organized crime uses violence against local politicians. Nevertheless, scholars have also argued that the two composite indexes have limitations. For example, Di Gennaro and La Spina suggested that the MI and the IPM may underestimate mafia presence outside traditional regions, since they exclude indicators on crimes which may be often committed by the mafias, such as arsons or bombings (Di Gennaro & La Spina, 2016, pp. 6–8).
This paper aims at further exploring the measurement of mafia presence in Italy by updating the MI and IPM into a Mafia Presence Index (MPI), a composite indicator measuring mafia presence between 2000 and 2015. Composite indicators have proved their ability to synthesize complex issues and point out possible risk patterns across different areas and disciplines (Giambona & Vassallo, 2014; Greco, Ishizaka, Tasiou, & Torrisi, 2018; Mizobuchi, 2014; Nardo, Saisana, Tarantola, Hoffman, & Giovannini, 2008; Saltelli, 2007). Measuring mafia presence is a complex task compared to other social phenomena, due to the uncertain selection of the variables that are supposed to empirically quantify it (Savona, 2012). While previous works by Calderoni (2011) and Transcrime (2013) proved to be grounded in terms of both methodological and theoretical perspectives, Di Gennaro and La Spina (2016, p. 7) correctly argue that the path to the development of a reliable mafia index is still in progress. In this regard, the literature on composite indicators suggests further technical improvements to refine the indicator. Therefore, this study aims to improve the statistical construction of the Mafia Presence Index, seeking to achieve a more accurate and less discretional structure, and to update the results at the most detailed possible level, namely Italian municipalities. A further intent is to provide a general framework that may be applied to other countries that seek to empirically evaluate the extent to which OC is active in a given area. 4 Methodology
7
4.1 Selection of the indicators
The selection of the indicators draws from previous indexes by Calderoni (2011) and Transcrime (2013). The MPI includes five core indicators covering the main dimensions identified in the operational definition of the mafia and encompassing evidences or effects of the presence and the activities of the mafia groups across Italy for the 2000-2015 period (Table 1 summarises the source and time period for the core indicators). In particular, the count of the mafia groups mentioned in the periodic reports of national antimafia law enforcement agencies, the Direzione Investigativa Antimafia (DIA) and the Direzione Nazionale Antimafia (DNA, and the number of mafia association offences reported by the police estimate the presence of mafia groups active in providing illicit goods and services in a given area.1 The reported number of mafia homicides (including also attempted ones) measures the level of mafia violence. Finally, information about city councils and public administrations dissolved for mafia infiltration and assets confiscated from mafia members are indicators of mafia infiltration in local politics and the economy, respectively. These countable indicators have been transformed into ratios on the resident population to take into account the difference in size of the Italian municipalities. The only exception is the number of dissolved city councils and public administrations, for which creating the rate by population would be meaningless.
A few changes in the methodology aim to improve the quality of the index. With regard to Calderoni’s Mafia Index, the current index moves the analysis to municipality level and it adds the indicator about mafia groups mentioned in the DIA and DNA reports. With respect to Transcrime’s index, this version updates all the indicators to a more recent time period. Moreover, it substitutes the number of people reported for mafia-type association with the number of reported mafia associations. Furthermore, all the indicators considered have been adjusted using a logarithmic transformation.2 This transformation better addresses the extreme skewness of the distribution of these variables by increasing their normality, and mitigating the effect of extreme outliers. In this study we willingly avoid considering any variable related to potential contextual determinants or enablers of the mafia presence, due to limited empirical evidence about these causal links in the literature. Our choice also allows us to focus on a finite number of variables avoiding the inclusion of a wider set of uncertain measures of mafia presence (Bollen & Bauldry, 2011).
To validate the variables included in the MPI, we selected from the literature a number of possible alternatives for measuring the potential effects of the mafia presence (Table 1, right column). Although the core indicators are widely accepted as direct indicators of the mafia presence, the choice of limiting the construction of the index to these variables was based mainly on a theoretical assessment on their soundness and internal coherence. This study proposes to validate this theoretical framework relying on an exploratory factor analysis that tests both the core and alternative indicators to assess their underlying correlation structure. The basic assumption of this technique is that the observed correlation among two or more variables is partially determined by the common influence of a broader, unobservable factor. A factor analysis allows identification and extrapolation of these latent factors to explain the largest part of the correlations among a set of original variables. Moreover, it provides a quantification of the extent to which each of the original variables is related to the factors identified (Corbetta, 2002; Cudeck, 2000), and it is particularly suited for indicators comprising effect variables (Bollen & Bauldry, 2011). This paper applies a factor analysis with principal component factor (PCF) extraction method,
1 Data on reported crimes have been obtained in the framework of an agreement between Università Cattolica del Sacro Cuore -Transcrime and the Italian Ministry of the Interior.
2 All the values obtained from the logarithm transformation are linearly transposed by adding the absolute of the minimum values for each transformed indicators plus a constant equal to 0.001. This procedure avoids the presence of negative and null values without altering the distribution of the transformed indicators allowing the next steps of the methodology.
8
and the factors obtained are rotated using an oblique rotation (oblimin) to facilitate interpretations of the results.3 Several alternative methods of extraction and rotation have been tested, providing comparable results.
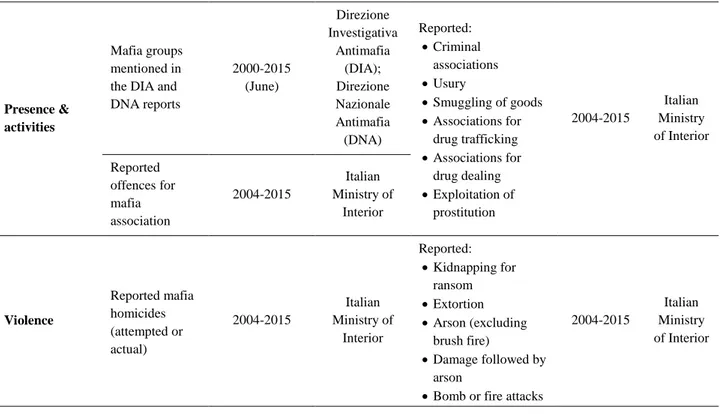
Table 1. Core indicators of the Mafia Presence Index by dimension and potential alternatives
Dimension
Core indicators Alternative indicators
Indicators Period Source Indicators Period Source
Presence & activities
Mafia groups mentioned in the DIA and DNA reports 2000-2015 (June) Direzione Investigativa Antimafia (DIA); Direzione Nazionale Antimafia (DNA) Reported: Criminal associations Usury Smuggling of goods Associations for drug trafficking Associations for drug dealing Exploitation of prostitution 2004-2015 Italian Ministry of Interior Reported offences for mafia association 2004-2015 Italian Ministry of Interior Violence Reported mafia homicides (attempted or actual) 2004-2015 Italian Ministry of Interior Reported: Kidnapping for ransom Extortion Arson (excluding brush fire) Damage followed by arson
Bomb or fire attacks
2004-2015 Italian Ministry of Interior Political infiltration City councils and Public Administrations dissolved for mafia infiltration 2000-2015 Italian Ministry of Interior - - - Economic infiltration Assets confiscated from organized crime 2000-2015 (for firms) 2000-2012 (for other assets) Agenzia Nazionale Beni Sequestrati e Confiscati (ANBSC) Reported money laundering offences 2004-2015 Italian Ministry of Interior
The preliminary validation by means of the factor analysis had two main aims. The first was to verify whether the core indicators were internally coherent, thus referring to a single latent factor as approximation for the mafia presence. This validates empirically the conclusions reached by Calderoni (2011) about the content validity and parsimony of his original index. The second was to verify whether the core indicators could be further integrated or modified, e.g. by removing or substituting some of its components or by introducing new ones (Asmundo, 2011; Di Gennaro & La Spina, 2016). Potential indicators significantly connected with the latent factor identified by the core indicators should enter into the
3
The rotations of the factors also allow the identified latent factors to be potentially correlated. This is positive as Mafia Presence may be
correlated with other criminal behaviours.9
final index. Similarly, one core indicator should be removed whether is loosely associated with the latent factor identified by the others. The alternative indicators were the reported crimes for a set of offences potentially associated with the mafias, and they covered three out of the four dimensions (i.e. presence & activities, violence and economic infiltration). As for the core indicators, all these variables were transformed into ratios and logged.
4.2 Constructing the Mafia Presence Index
All the core indicators were normalised using an indexing to their maximum values to allow comparability among variables with different measurement units. In detail, for each indicator the municipality with the highest value received a score of 100, and all the other values were rescaled accordingly. This normalisation ensures easier interpretation of the results than do other procedures; it maintains information about the relative distances among the municipalities; and it is coherent with the previous versions of the index.
The final score of the MPI is the arithmetic mean of the five normalised indicators. The main drawback of this aggregation method is that it permits compensability among the different indicators (i.e., a low value in one indicator can be compensated by a high value in another one). In the current exercise, compensability problems were negligible because, although all the core indicators assessed different specific dimensions, they all measured mafia presence in a given area and were thus substitutable indicators (Mazziotta & Pareto, 2013). Similarly, the equal weighting approach follows the theoretical assumption that all the indicators have the same relevance in measuring mafia presence and none of the data sources is considered as preferable or less flawed than others (Greco et al., 2018).
Although the indicators selected for constructing the MPI are clear signs of the presence of a mafia group in an area, their main limitation is that the picture they provide cannot be considered exhaustive. The presence of Mafia groups is probably not limited to the areas where these signs have been recorded. They are likely to be active in other neighbouring areas as well, although their presence has not been reflected by the available information. There may be various reasons for this, ranging from the efficacy and focus of law enforcement activities to the nature of the data available, which prevent understanding of whether the criminal behaviour recorded in a specific municipality was indeed limited to the municipality itself or involved a broader geographical area. This is particularly likely as the size of the unit of analysis decreases.
To partially solve this issue, a smoothing procedure was applied so that the value in each municipality was partially spread among its neighbours. The assumption behind this approach is that a mafia offence or evidence of political or economic infiltration in a given municipality can be considered as a sign of the influence and presence of mafia groups in a wider surrounding area. In particular, the procedure applied first derived the centroid of each municipality; then using an interpolation method, it calculated a smooth surface that passed through these points.4 Finally, it assigned to each municipality a new value corresponding to the highest value recorded by the surface obtained within its area. The final score obtained presents minimum deviances from the original one (R= 0.89; p <0.001) but makes it possible to draw a more realistic map of the mafia presence in Italy, avoiding anomalous positive or negative peaks in the distribution. This procedure, together with the logarithmic transformation of the original variables, contributes also in reducing the skewness of the data. However, it is worth noting that the lack of symmetry in the variables’ distributions is not particularly
4 The chosen method was a spline interpolation with barriers (i.e., the smooth surface calculated is constrained by the input barrier features) available in the ArcMap 10.4.1 software. The barriers considered were the Italian national borders. This procedure requires a small adjustment to amend the distortion caused by the edge effect in the municipalities at the borders or along the coastlines.
10
worrisome for this analysis as it is the direct consequence of the high spatial concentration of mafia presence. Robustness checks
Any composite indicator is directly affected by the methodology used and by the underlying assumptions that guide it, and the MPI is no exception (Greco et al., 2018). To assess the extent to which the results obtained are functions of our choices rather than of the actual information provided by the data, the MPI calculated using the IEA approach (i.e., Indexing, Equal weight, and Arithmetic mean) was compared with all the indexes resulting from alternative normalization, aggregation or weighting techniques (Table 2). A wider literature suggests this approach (Cherchye et al., 2008; Saisana, Saltelli, & Tarantola, 2005) and Dugato, De Simoni and Savona have already applied it to the measurement of organized crime presence and activities in Mexico (2014).
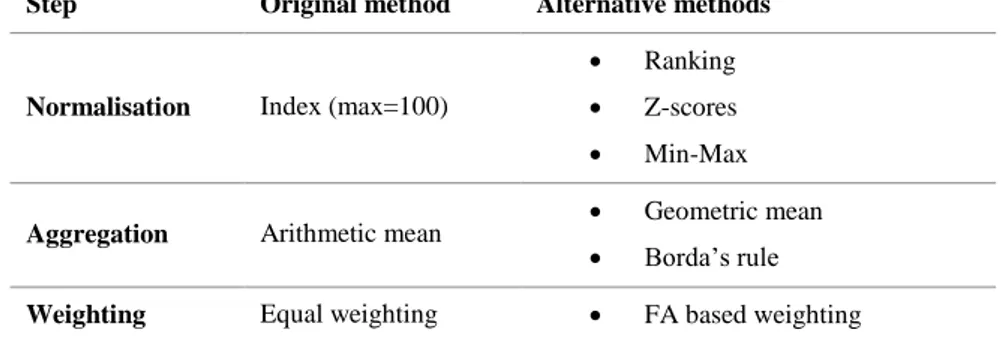
Table 2. Methodological alternatives
Step Original method Alternative methods
Normalisation Index (max=100)
Ranking
Z-scores
Min-Max
Aggregation Arithmetic mean Geometric mean
Borda’s rule
Weighting Equal weighting FA based weighting
In particular, the alternatives considered for the normalization of the indicators were the simple ranking, the z-scores standardization, and the min-max transformation; for the aggregation methods, the comparison was with two non-additive approaches, the geometric mean and an aggregation based on the Borda rule; the alternative to equal weighting considered a weighting based on the factor loadings obtained in the factor analysis.5 The different combinations resulted in 19 indexes alternative to the MPI.6
To assess the extent to which the chosen methodology affected the final ranking, we focused on the average variations in the ranks of the municipalities between the results of the IEA approach and the median of all the possible combinations. The smaller the difference, the lower the influence of the methodology on the final results. As a second robustness check, we explored the relative importance of the single indicators in determining the outcome of the MPI. For this purpose, we calculated five alternative indexes, each excluding one of the core indicators at a time. Again, an analysis of the average ranking variations enables investigation of which components affect the indexes the most.
5 Results
The factor analysis identified four relevant latent factors starting from the correlation matrix of the overall set of variables. Table 3 reports the relevant factor loadings for each original variable. The results confirm that the five core indicators are all correlated with factor 4, which can approximate the presence of mafia. Conversely, none of the alternative indicators is associated with this factor. This leads to two conclusions. First, it confirms the hypothesis that all the core indicators are suitable for measuring the same latent concept, i.e. the mafia presence. Second, the proposed alternative indicators
5 Describing each of these alternatives falls outside the scope of this paper. Full details can be found in OECD (2008)
11
are likely to measure other criminal dimensions that, although potentially connected with the mafias, are hardly valid substitutes for, or additions to, the core set.
Table 3 . Factor loadings based on a PCF extraction method with oblimin rotation (N = 8047) Factor 1 Factor 2 Factor 3 Factor 4 Core indicators Mafia murders - - - 0.67 Mafia association - - - 0.58 Mafia groups - - 0.43 0.34 Confiscated assets - 0.35 - 0.49
Dissolution of city councils or PA - - - 0.73
Alternative indicators
Usury - 0.75 - -
Kidnapping for ransom - 0.65 - -
Extortion - 0.58 0.33 -
Arson (excluding brush fire) - - 0.79 -
Damage followed by arson - - 0.72 -
Bomb or fire attacks 0.50 - - -
Criminal associations 0.54 - - -
Money laundering 0.51 - - -
Smuggling of goods 0.66 - - -
Associations for drug trafficking 0.72 - - -
Associations for drug dealing 0.64 - - -
Exploitation of prostitution 0.53 - - -
Note: Explained variance 48.2%; Factors with eigenvalues below 1 are dropped; Factors Factor loadings < 0.3 are suppressed.
Figure 1 shows the results of the MPI at municipality level. The highest value is scored by the municipality of Reggio Calabria, the capital of the homonymous province and the largest city of Calabria (at the tip of the Italian peninsula). Unsurprisingly, the highest values of the index are mostly concentrated in the four Southern Italian regions with a traditional presence of the four main mafias (Calabria for ‘Ndrangheta, Sicily for Cosa Nostra, Campania for Camorra and Apulia for the Apulian OC). The concentration is strong, since 90% of the top 10% municipalities in the ranking are in one of these four regions. Calabria is the most affected region considering that 48 out of the 100 municipalities scoring the highest values of MPI are located in this region. Campania (36), Sicilia (14) and Apulia (2) follow. However, the analysis at municipal level shows that mafia presence concentrates in specific areas of these regions, suggesting that not all the regional territories are equally affected by the mafias. For example, in Campania, 74.5% of the municipalities with the highest scores are located in the provinces of Naples and Caserta, which account for only 36% of the municipalities in the region.
Although mafia groups are highly concentrated in their home regions, the MPI identifies also a large mafia presence outside traditional mafia regions. Some significant clusters are detected in central and northern Italy, mainly within or around large cities (e.g., Rome, Milan, Turin, Bologna, Brescia, and Verona). Indeed, the medium-large (between 60,000 and 99,999 inhabitants) and large cities (more than 100,000 inhabitants) are respectively 4.9 and 4.4 times more represented in the highest decile of the MPI than in the general distribution of the municipalities. This pattern is even stronger in some non-traditional mafia regions, about 60.6 times for Lombardy, 13.5 for Lazio, and 12.6 for Liguria and peaking at around 120.8 times for Piedmont. Conversely, in the four traditional mafia regions, the prevalence of medium and large cities is only between 3.4 (Campania) and 1.8 (Sicily) times the prevalence of these cities across all
12
municipalities. Small towns (i.e., with fewer than 5000 inhabitants) are generally under-represented, with the sole exception of Emilia-Romagna (1.9) This may suggest different ways in which mafia groups distribute across the Italy, favouring large urban areas rather than small or rural settlements outside their traditional regions. The results of the indexes support the findings of previous studies and the existing literature on the topic. As an example, the correlation of the MPI at province level with Calderoni’s Mafia Index is positive and highly significant (R = 0.83; p < 0.001).
Figure 1 – Mafia Presence Index, municipal level, 2000-2015
13
its calculation. On average, there is a variation of about 73 positions on comparing the rank of the selected version of the MPI and the median position of all the 20 potential alternative ranks resulting from different methodological choices (Table 4). This value is very low considering the 8047 possible positions in the rank.
Table 4 - Comparison of the municipal rank from the MPI (IEA method) and the median of the 20 alternative methods Decile (IEA) Average positions variation % of municipalities in different deciles 1 42.4 1.7% 2 68.1 2.1% 3 66.3 1.2% 4 92.8 1.0% 5 83.7 0.9% 6 71.7 0.7% 7 65.4 0.7% 8 72.9 0.6% 9 65.2 0.4% 10 98.6 0.2% Total 72.7 1.0%
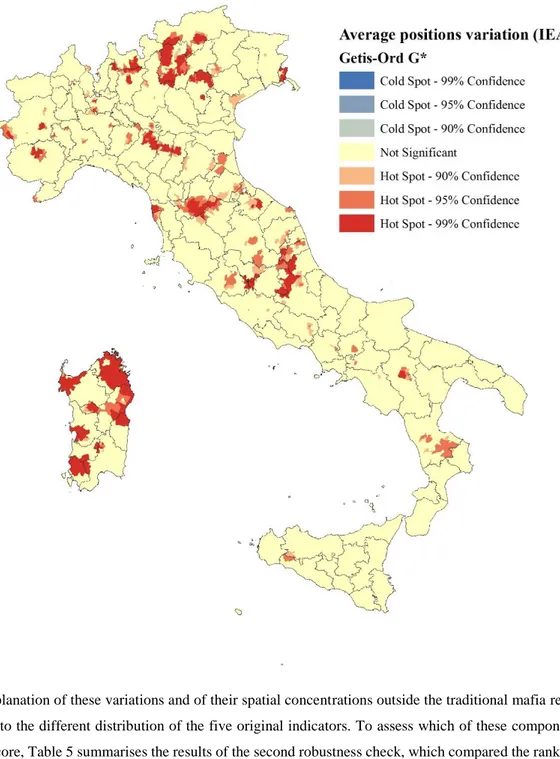
Furthermore some significant patterns emerge on looking at the spatial concentration of these variations.. The Getis-Ord General G spatial association statistic, which measures how concentrated the high or low values are in a given space, is positive and significant (i.e., z-score = 30.13 ; p < 0.001). This implies that the variations are not randomly distributed (Getis & Ord, 1992). The local version of this statistic (G*) highlights where the clusters of significantly high or low values are. In Figure 2, the hot spots identify the groups of adjacent municipalities recording significantly high deviations from the median value, and the cold spots the clusters experiencing significantly low variations. The results show that the most significant concentrations affect few areas of the country, namely the Sardinia region, the Trento and Vicenza provinces in the North, and the areas around the cities of Firenze, L’Aquila, Parma, Reggio Emilia and Modena in the Centre. These results confirm, as also Table 4 has shown, that the instability of the MPI does not affect the areas of the country recording the highest level of mafia presence. Therefore, despite some variations in the overall ranking, the methodological choices hardly jeopardize identification of the most problematic areas.
14
Figure 2 – Spatial concentrations of the variations between IEA and the Median of the 20 alternatives
An explanation of these variations and of their spatial concentrations outside the traditional mafia regions is likely to be linked to the different distribution of the five original indicators. To assess which of these components most affect the final score, Table 5 summarises the results of the second robustness check, which compared the rank of the MPI with the rank of the five alternatives of the index calculated excluding one of the core indicators at a time. The table reports the average position variations recorded.
15
Table 5 - Average position variations in the complete Mafia Presence Index Rank excluding a single indicator at a time Excluded indicator Mafia Homicides Mafia Association Active Mafia groups Dismantled Councils Confiscated assets Municipal level (n=8047) 100.87 160.12 999.77 33.69 730.47 Province level (n=110) 1.89 4.20 6.13 0.49 6.64 Region level (n=20) 0.30 0.10 1.10 0.30 0.60
Active Mafia Groups is the indicator with the highest influence on the final ranking, followed by Confiscated Assets. These two variables are indeed more dispersed across the country, implying that for many municipalities they are the sole indicators of the presence of a mafia group. Therefore, excluding one of these two indicators from the final index leads to a strong variation in the municipal ranking because the loss of information is not compensated by other indicators. This effect is confirmed, although largely tempered, when the analysis is conducted at a higher level (i.e. provincial or regional), as the compensation effect of the other indicators is more effective at more aggregated levels.
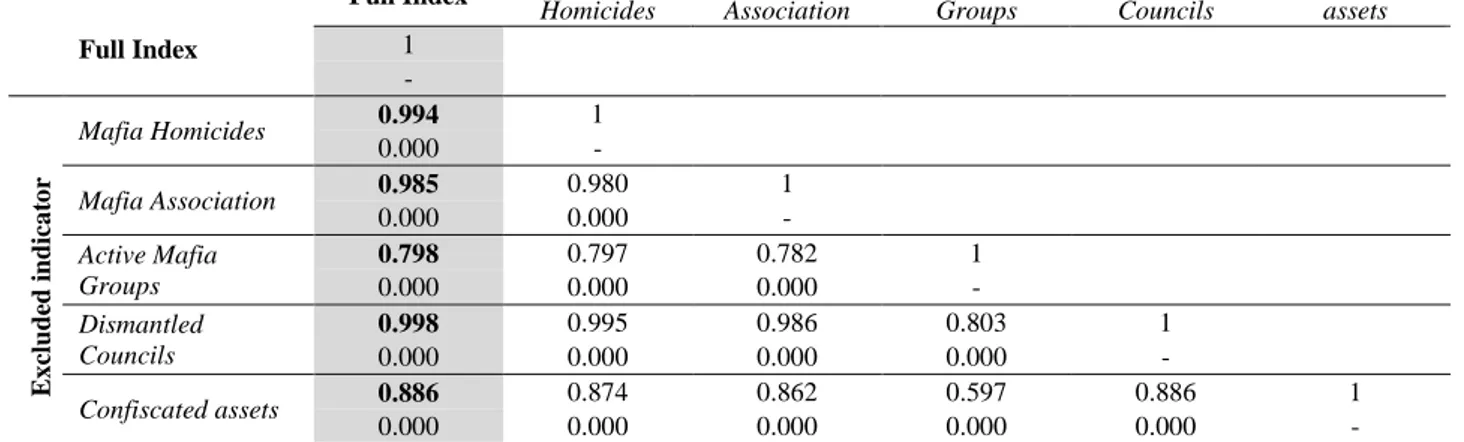
Despite these variations, the results of the index remain largely stable, as demonstrated by the linear correlations between the ranks obtained on excluding one of the components at a time and the original rank resulting from the full index (Table 6). Among the five components, Active Mafia Groups generates the highest instability in the results of the MPI. Thus, it is interesting to verify whether this influence is constant throughout the country. Figure 3 shows that there is a positive spatial association of the position variations between the full MPI and the index excluding the Active Mafia Groups indicator. This means that the effect of this indicator in determining the final index is not spatially constant. In particular, its removal affects the results in several municipalities in the North-East (e.g. Udine, Trento, Verona, Vicenza provinces), in the North-West (e.g. Aosta, Cuneo, Piacenza and Imperia provinces), and in large areas of the Sardinia, Molise and Basilicata regions. These areas are in non-traditional mafia regions, whereas in the rest of the country this component has a very scattered and limited influence on the full MPI.
16
Table 6 - Linear correlation between the municipal ranks of the full Mafia Presence Index and of the five indexes excluding a single indicator at a time
Excluded indicator
Full Index Mafia
Homicides Mafia Association Active Mafia Groups Dismantled Councils Confiscated assets Full Index 1 - Mafia Homicides 0.994 1 Ex clu d ed i n d ica to r 0.000 - Mafia Association 0.985 0.980 1 0.000 0.000 - Active Mafia Groups 0.798 0.797 0.782 1 0.000 0.000 0.000 - Dismantled Councils 0.998 0.995 0.986 0.803 1 0.000 0.000 0.000 0.000 - Confiscated assets 0.886 0.874 0.862 0.597 0.886 1 0.000 0.000 0.000 0.000 0.000 -
17
Figure 3 – Spatial concentrations of the positions’ distances between full IEA and IEA excluding the Active Mafia Groups indicator
These results have two main implications. First, the MPI in the traditional mafia areas is stable despite the removal of one of the five components at a time. This suggests an extensive co-presence and, consequently, a high level of compensability of the core indicators in these areas. Second, the higher variability recorded in the other regions, especially due to the Active Mafia Groups indicator, support the construction of a composite indicator. Gathering and merging information from different sources can capture the variety of the different forms that the mafia presence assumes and partially overcome the limitations imposed by the difficulties of obtaining evidence of this crime.
18
6 Discussion and conclusionsThis study has presented the Mafia Presence Index, an updated composite indicator measuring the presence of mafias across Italian municipalities. The results furnish several insights for the measurement of complex crimes in general and particularly for the growing literature on measuring and mapping organised crime. First, the MPI provides a parsimonious and effective measurement relying on a core of five direct measures of mafia presence: reported mafia associations, reported mafia murders and attempted mafia murders, active mafia groups mentioned in official reports, city councils dissolved for mafia infiltration, and assets confiscated from organized crime. Exploration of alternative, indirect, effect indicators through a factor analysis showed that all the options considered are loosely correlated with the five core indicators. The findings thus suggest caution in expanding the list of possible indicators beyond direct measures. In particular, several previous studies have proxied mafia presence by including also offences such as extortion, arsons and bomb attacks in addition to direct measures (V. Daniele & Marani, 2011; Asmundo, 2011). This is also one of the main criticisms made of the MI and the IPM by Di Gennaro and La Spina, who contended that “we just need to agree upon a proportion of arsons or bombings which are ‘indicative’ of the phenomenon [i.e. the mafia], and a remaining quota to be considered extraneous to it” (2016, p. 7). However, Italian official crime data lack specific categories of mafia-related extortions, arsons or bomb attacks, unlike attempted and committed homicides. Consequently, the currently available data make it impossible to attribute a specific share of these crimes to the mafias without unwarranted assumptions. While it is certainly true that the mafias may often resort to e.g. bomb attacks, the unfeasibility of distinguishing mafia-related offences from the others may bias the measurement of mafia presence in directions which are hardly predictable, not to mention the issues related with underreporting or dark numbers.
Furthermore, it is uncertain whether an “extended” version of the MPI including additional indirect measures would improve the quality of the measurement. On the one hand, inserting few additional indicators is likely to affect the actual results minimally, given the presence of a highly correlated core of indicators, as highlighted by the above-reported factor analysis. Calderoni (2011) demonstrates this consistency empirically in assessing the validity of the MI at provincial level. On the other hand, including a high number of indirect indicators will require to weight carefully the different components, necessitating additional methodological concerns and assumptions. This would increase the complexity and uncertainty of the measure obtained.
Second, the MPI computed through the IEA method is robust to variations of the calculation method, highlighting the reliability of the measurement. Mafia presence as measured by the MPI is hardly due to the specific calculation method adopted. Comparison of the rankings obtained with 20 alternative solutions shows marginal impact on the municipal ranking. Across the 8,047 municipalities, the median variation in the rank is about 73 positions, with only 1% of the municipalities falling in a different decile. Furthermore, the distribution of the variations also shows that they concentrate outside traditional mafia regions. Whereas the MPI clearly identifies areas with the strongest mafia presence, the relatively small variations mostly concern other parts of Italy, where the core indicators may be more unevenly distributed. Indeed, among the five core indicators, Active Mafia Groups has the largest influence on the synthetic score. This is mostly due to the dispersion of the indicators across Italian municipalities.
Third, mafia presence in Italy is strongly concentrated in specific areas of the Southern regions of Sicily, Campania, Calabria and Apulia, where the mafias have a well-established, traditional presence (Lupo, 1993; Ciconte, 1992; Behan, 1996; Massari, 1998; Barbagallo, 2010). However, the MPI shows important mafia presence in the Centre and North of Italy. This is consistent with the growing media and scholarly attention to the movements of the mafias outside their
19
original areas (Commissione parlamentare antimafia, 1994; Sciarrone, 1998, 2014). For example, the provinces of Rome and neighbouring Latina (to the south of the capital) report medium-high scores due to increasing evidence of mafia activities in the area (Crime&Tech, 2018).
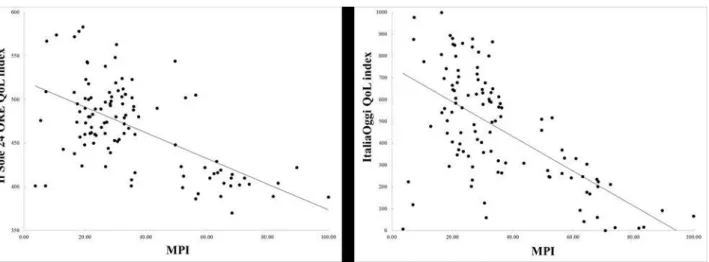
Lastly, the validity of the MPI in a broader perspective is confirmed through comparison with the main indexes of quality of life in Italy. As shown in Figure 4, the provincial MPI correlates negatively with the indexes of quality of life compiled by Il Sole 24 ORE and ItaliaOggi (respectively R: -0.59 and R: -0.62; p ≤ 0.001). The negative association between mafia presence and the quality of life further corroborates the growing body of literature suggesting that the mafias have a significant and negative impact on local communities (Lavezzi, 2008; V. Daniele & Marani, 2011; Lavezzi, 2014; De Feo & De Luca, 2013; Moro et al., 2016; Moro & Sberna, 2017; Caglayan et al., 2017). Because the mafia may affects people’s living conditions, it would be appropriate to include also the MPI in evaluations of the quality of life in a given area.
Figure 4 – Scatterplots of the MPI and Il Sole 24 ORE (left) and ItaliaOggi (right) quality of life indexes at provincial level
20
ReferencesAlbanese, G., & Marinelli, G. (2013). Organized crime and productivity: Evidence from firm-level data. Rivista Italiana
Degli Economisti, 18(3 December 2013), 367–394.
Allum, F. (2014). Understanding criminal mobility: the case of the Neapolitan Camorra. Journal of Modern Italian
Studies, 19(5), 583–602. https://doi.org/10.1080/1354571X.2014.962257
Antonopoulos, G., & Papanicolaou, G. (2018). Organised crime: a very short introduction. New York, NY: Oxford University Press.
Asmundo, A. (2011). Indicatori e costi di criminalità mafiosa. In R. Sciarrone (Ed.), Alleanze nell’ombra. Mafie ed
economie locali in Sicilia e nel Mezzogiorno (pp. 49–66). Rome: Donzelli Editore.
Asmundo, A., & Lisciandra, M. (2008). The cost of protection racket in Sicily. Global Crime, 9(3), 221–240. https://doi.org/10.1080/17440570802254338
Atuesta, L. H., & Ponce, A. F. (2017). Meet the Narco: increased competition among criminal organisations and the explosion of violence in Mexico. Global Crime, 18(4), 375–402. https://doi.org/10.1080/17440572.2017.1354520 Atuesta, L. H., Siordia, O. S., & Madrazo Lajous, A. (2016). La “Guerra Contra las Drogas” en México: registros
(ofciales) de eventos durante el periodo de diciembre de 2006 a noviembre de 2011. Aguascalientes: Centro de
Investigación y Docencia Económicas. Retrieved from
http://www.politicadedrogas.org/PPD/documentos/20170202_095133_14._atuesta_siordia__madrazo__la_guerra_contr a_las_drogas_en_mexico_registros_oficiales_de_eventos_durante_el_periodo_de_diciembre_de_2006_a_noviembre_d e_2011.pdf
Bachman, R., & Schutt, R. K. (2010). The Practice of Research in Criminology and Criminal Justice. Thousands Oaks, CA: SAGE.
Barbagallo, F. (2010). Storia della camorra. Bari: Laterza.
Barone, G., & Narciso, G. (2012). The effect of mafia on public transfers (p. 38). Presented at the Economia informale, evasione fiscale e corruzione, Pavia. Retrieved from http://www.siepweb.it/siep/oldDoc/2012/201207.pdf
Barone, G., & Narciso, G. (2015). Organized crime and business subsidies: Where does the money go? Journal of Urban
Economics, 86, 98–110. https://doi.org/10.1016/j.jue.2015.01.002
Behan, T. (1996). The Camorra. London and New York: Routledge.
Berlusconi, G. (2014). Italian Mafia. In G. Bruinsma & D. Weisburd (Eds.), Encyclopedia of Criminology and Criminal
Justice (pp. 2699–2706). New York: Springer.
Bollen, K. A., & Bauldry, S. (2011). Three Cs in measurement models: Causal indicators, composite indicators, and covariates. Psychological Methods, 16(3), 265–284. https://doi.org/10.1037/a0024448
Buscaglia, E., & Van Dijk, J. (2003). Controlling organized crime and corruption in the public sector. Forum on Crime
and Society, 3(1–2), 1–34.
Caglayan, M., Flamini, A., & Jahanshahi, B. (2017). Organized Crime and Technology (DEM Working Papers Series No. 136). Pavia: University of Pavia, Department of Economics and Management. Retrieved from https://ideas.repec.org/p/pav/demwpp/demwp0136.html
Calderoni, F. (2011). Where is the mafia in Italy? Measuring the presence of the mafia across Italian provinces. Global
Crime, 12(1), 41–69. https://doi.org/10.1080/17440572.2011.548962
Calderoni, F. (2014). Measuring the Presence of the Mafias in Italy. In S. Caneppele & F. Calderoni (Eds.), Organized
21
Calderoni, F., Berlusconi, G., Garofalo, L., Giommoni, L., & Sarno, F. (2015). The Italian mafias in the world: A systematic assessment of the mobility of criminal groups. European Journal of Criminology, 1477370815623570. https://doi.org/10.1177/1477370815623570
Calderoni, F., & Di Stefano, F. (2015). The administrative approach in Italy. In A. C. M. Spapens, M. Peters, & D. Van Daele (Eds.), Administrative measures to prevent and tackle crime: Legal possibilities and practical application in EU
Member States (pp. 239–264). Den Haag: Eleven International Publishing.
Campana, P. (2011). Eavesdropping on the Mob: the functional diversification of Mafia activities across territories.
European Journal of Criminology, 8(3), 213–228.
Campana, P., & Varese, F. (2018). Organized Crime in the United Kingdom: Illegal Governance of Markets and Communities. The British Journal of Criminology. https://doi.org/10.1093/bjc/azx078
Caneppele, S., Riccardi, M., & Standridge, P. (2013). Green energy and black economy: mafia investments in the wind power sector in Italy. Crime, Law and Social Change, 59(3), 319–339. https://doi.org/10.1007/s10611-013-9418-1 Capuano, C., & Purificato, F. (2012, July). The Macroeconomic Impact of Organized Crime, a Neo-Kaleckian Perspective. Retrieved from https://mpra.ub.uni-muenchen.de/40077/1/MPRA_paper_40077.pdf
Censis. (2009). Il condizionamento delle mafie sull’economia, sulla società e sulle istituzioni del Mezzogiorno. Roma: Censis. Retrieved from http://www.censis.it/censis/attachment/protected_download/624?view_id=35
Centorrino, M., & Ofria, F. (2008). Criminalità organizzata e produttività del lavoro nel Mezzogiorno: un’applicazione del modello “Kaldor-Verdoorn.” Rivista Economica Del Mezzogiorno, (1/2008). https://doi.org/10.1432/27151
Cherchye, L., Moesen, W., Rogge, N., Van Puyenbroeck, T., Saisana, M., Saltelli, A., … Tarantola, S. (2008). Creating composite indicators with DEA and robustness analysis: the case of the Technology Achievement Index. Journal of the
Operational Research Society, 59(2), 239–251. https://doi.org/10.1057/palgrave.jors.2602445
Ciconte, E. (1992). ’Ndrangheta dall’Unità a oggi. Roma Bari: Laterza.
Commissione parlamentare antimafia. (1994). Relazione sulle risultanze dell’attività del gruppo di lavoro incaricato di
svolgere accertamenti su insediamenti e infiltrazioni di soggetti ed organizzazioni di tipo mafioso in aree non tradizionali.
Roma: Commissione Parlamentare d’inchiesta sul fenomeno della mafia e sulle altre associazioni criminali similari. Coniglio, N., Celi, G., & Scagliusi, C. (2010). Organized Crime, Migration and Human Capital Formation: Evidence
from the South of Italy (Working paper No. 28). Dipartimento di Economia e Finanza - Università degli Studi di Bari
“Aldo Moro.” Retrieved from https://econpapers.repec.org/paper/baiseries/economia-series28.htm
Corbetta, P. (2002). Metodi di analisi multivariata per le scienze sociali: i modelli di equazioni strutturali. Bologna: Il mulino.
Coscia, M., & Rios, V. (2012). Knowing Where and How Criminal Organizations Operate Using Web Content. In
Proceedings of the 21st ACM International Conference on Information and Knowledge Management (pp. 1412–1421).
New York, NY, USA: ACM. https://doi.org/10.1145/2396761.2398446
Crime&Tech. (2018). Mafie nel Lazio: Le infiltrazioni della criminalità organizzata nell’economia legale del Lazio. Roma: Regione Lazio.
CROSS. (2014). Primo rapporto trimestrale sulle aree settentrionali, per la presidenza della commissione parlamentare
di inchiesta sul fenomeno mafioso. Milano: Osservatorio sulla Criminalità Organizzata dell’Università degli Studi di
Milano.
Cudeck, R. (2000). Exploratory Factor Analysis. In Handbook of Applied Multivariate Statistics and Mathematical
Modeling (pp. 265–296). Elsevier. https://doi.org/10.1016/B978-012691360-6/50011-2
Daniele, G., & Dipoppa, G. (2017). Mafia, elections and violence against politicians. Journal of Public Economics, 154, 10–33. https://doi.org/10.1016/j.jpubeco.2017.08.004
22
Daniele, V., & Marani, U. (2011). Organized crime, the quality of local institutions and FDI in Italy: A panel data analysis.
European Journal of Political Economy, 27(1), 132–142. https://doi.org/10.1016/j.ejpoleco.2010.04.003
De Feo, G., & De Luca, G. (2013). Mafia in the ballot box (SIRE Discussion Paper No. 2013–104). Scottish Institute for Research in Economics (SIRE). Retrieved from https://econpapers.repec.org/paper/ednsirdps/529.htm
Decker, S. H., & Curry, G. D. (2002). Gangs, gang homicides, and gang loyalty:: Organized crimes or disorganized criminals. Journal of Criminal Justice, 30(4), 343–352.
Di Gennaro, G., & La Spina, A. (2016). The costs of illegality: a research programme. Global Crime, 17(1), 1–20. https://doi.org/10.1080/17440572.2015.1128621
Dugato, M., De Simoni, M., & Savona, E. U. (2014). Measuring OC in Latin America. Mexico City, Mexico: UNODC-INEGI.
Dugato, M., Favarin, S., & Giommoni, L. (2015). The Risks and Rewards of Organized Crime Investments in Real Estate.
British Journal of Criminology, 55(5), 944–965. https://doi.org/10.1093/bjc/azv002
Eurispes. (2004). 16° Rapporto Italia 2004. Roma: Eurilink. Eurispes. (2007). 19° Rapporto Italia 2007. Roma: Eurilink. Eurispes. (2008). 20° Rapporto Italia 2008. Roma: Eurilink.
Europol. (2017). European Union Serisous and Organised Crime Threat Assessment: Crime in the age of technology. Den Haag: Europol. Retrieved from https://www.europol.europa.eu/activities-services/main-reports/european-union-serious-and-organised-crime-threat-assessment-2017
Ferwerda, J., & Unger, B. (2016). Organised crime infiltration in the Netherlands: transportation companies hiding transit crimes. In E. U. Savona, M. Riccardi, & G. Berlusconi (Eds.), Organised Crime in European Businesses (pp. 35–50). London - New York: Routledge.
Ganau, R., & Rodríguez‐Pose, A. (2017). Industrial clusters, organized crime, and productivity growth in Italian SMEs.
Journal of Regional Science, 58(2), 363–385. https://doi.org/10.1111/jors.12354
Getis, A., & Ord, J. K. (1992). The Analysis of Spatial Association by Use of Distance Statistics. Geographical Analysis,
24(3), 189–206. https://doi.org/10.1111/j.1538-4632.1992.tb00261.x
Giambona, F., & Vassallo, E. (2014). Composite Indicator of Social Inclusion for European Countries. Social Indicators
Research, 116(1), 269–293. https://doi.org/10.1007/s11205-013-0274-2
Gilmour, S. (2008). Understanding Organized Crime: A Local Perspective. Policing: A Journal of Policy and Practice,
2(1), 18–27. https://doi.org/10.1093/police/pan002
Greco, S., Ishizaka, A., Tasiou, M., & Torrisi, G. (2018). On the Methodological Framework of Composite Indices: A Review of the Issues of Weighting, Aggregation, and Robustness. Social Indicators Research.
https://doi.org/10.1007/s11205-017-1832-9
Guerrero-Gutiérrez, E. (2011). Security, drugs, and violence in mexico: a survey (p. 146). Washington: 7Th North American Forum.
HMIC. (2015). Regional Organised Crime Units: A review of capability and effectiveness. London: Her Majesty Inspectorate of Constabulary. Retrieved from https://www.justiceinspectorates.gov.uk/hmicfrs/wp-content/uploads/regional-organised-crime-units.pdf
HMIC. (2017). PEEL: Police Effectiveness 2016. A National Overview. London: Her Majesty Inspectorate of Constabulary. Retrieved from https://www.justiceinspectorates.gov.uk/hmicfrs/wp-content/uploads/peel-police-effectiveness-2016.pdf
Il Sole 24 ORE. (2017, November 30). Qualità della vita 2017: tutte le classifiche del Sole 24 Ore. Il Sole 24 ORE. Retrieved from http://www.ilsole24ore.com/dossier/notizie/2017/qualita-della-vita/
23
ISTAT. (2010, September). B. Indicatori di contesto chiave e variabili di rottura. Retrieved October 16, 2010, from http://www.istat.it/ambiente/contesto/infoterr/azioneB.html#tema
ISTAT. (2017). BES 2017 - Il benessere equo e sostenibile in Italia. Rome, Italy: Istituto nazionale di statistica. Retrieved from https://www.istat.it/it/files//2017/12/Bes_2017.pdf
ItaliaOggi. (2017, November 27). Qualità della vita 2017. ItaliaOggi, p. 40.
Land, K. C., Michalos, A. C., & Sirgy, J. (Eds.). (2012). Handbook of Social Indicators and Quality of Life Research. Springer Netherlands. Retrieved from //www.springer.com/la/book/9789400724204
Lavezzi, A. M. (2008). Economic structure and vulnerability to organised crime: Evidence from Sicily. Global Crime,
9(3), 198–220.
Lavezzi, A. M. (2014). Organised crime and the economy: a framework for policy prescriptions. Global Crime, 0(0), 1– 27. https://doi.org/10.1080/17440572.2013.868626
Lupo, S. (1993). Storia della mafia. Dalle origini ai nostri giorni. Roma: Donzelli. Massari, M. (1998). La Sacra Corona Unita: Potere E Segreto. Roma: Laterza.
Mazziotta, M., & Pareto, A. (2013). Methods for constructing composite indices: one for all or all for one. Rivista Italiana
Di Economia Demografia e Statistica, 67(2), 67–80.
Mennella, A. (2009). Reti sociali, criminalità organizzata e mercati locali del lavoro. University of Sassari. Retrieved from http://www.aiel.it/Old/bacheca/SASSARI/papers/mennella.pdf
Meško, G., Sotlar, A., Dobovšek, B., Eman, K., Modic, M., Ažman, B., & Slak, B. (2015). Slovenia. In E. U. Savona & G. Berlusconi (Eds.), Organized Crime Infltration of Legitimate Businesses in Europe: A Pilot Project in Five European
Countries. Final Report of Project ARIEL – Assessing the Risk of the Infltration of Organized Crime in EU MSs Legitimate Economies: a Pilot Project in 5 EU Countries (pp. 50–56). Trento: Transcrime - Università degli Studi di Trento.
Mete, V. (2009). Fuori dal comune: lo scioglimento delle amministrazioni locali per infiltrazioni mafiose. Acireale and Roma: Bonanno.
Michalos, A. C. (Ed.). (2014). Encyclopedia of Quality of Life and Well-Being Research. Springer Netherlands. Retrieved from //www.springer.com/gp/book/9789400707528
Michalos, A. C., & Zumbo, B. D. (2000). Criminal Victimization and the Quality of Life. Social Indicators Research,
50(3), 245–295. https://doi.org/10.1007/978-94-017-0389-5_15
Ministerio del Interior, & CITCO. (2017). Lucha contra el crimen organizado la corrupción. Balance 2016. Madrid:
Ministerio del Interior. Retrieved from
http://www.interior.gob.es/documents/10180/5791067/Balance+2016+de+lucha+contra+el+Crimen+Organizado+y+la+ Corrupci%C3%B3n.pdf/25acb5f9-b4b4-4b21-9d22-aef29fc88a57
Mizobuchi, H. (2014). Measuring World Better Life Frontier: A Composite Indicator for OECD Better Life Index. Social
Indicators Research, 118(3), 987–1007. https://doi.org/10.1007/s11205-013-0457-x
Moro, F. N., Petrella, A., & Sberna, S. (2016). The Politics of Mafia Violence: Explaining Variation in Mafia Killings in Southern Italy (1983–2008). Terrorism and Political Violence, 28(1), 90–113. https://doi.org/10.1080/09546553.2014.880835
Moro, F. N., & Sberna, S. (2017). Transferring Violence? Mafia Killings in Nontraditional Areas: Evidence from Italy.
Journal of Conflict Resolution, 0022002717693049. https://doi.org/10.1177/0022002717693049
Nardo, M., Saisana, M., Tarantola, S., Hoffman, A., & Giovannini, E. (2008). Handbook on constructing composite
indicators: methodology and user guide. Paris: OECD.