HAL Id: hal-01287998
https://hal.archives-ouvertes.fr/hal-01287998
Submitted on 14 Mar 2016
HAL is a multi-disciplinary open access
archive for the deposit and dissemination of sci-entific research documents, whether they are pub-lished or not. The documents may come from teaching and research institutions in France or abroad, or from public or private research centers.
L’archive ouverte pluridisciplinaire HAL, est destinée au dépôt et à la diffusion de documents scientifiques de niveau recherche, publiés ou non, émanant des établissements d’enseignement et de recherche français ou étrangers, des laboratoires publics ou privés.
A longitudinal analysis of the Italian national
standardized mathematics tests
Laura Branchetti, Federica Ferretti, Alice Lemmo, Andrea Maffia, Francesca
Martignone, Mariagiulia Matteucci, Stefania Mignani
To cite this version:
Laura Branchetti, Federica Ferretti, Alice Lemmo, Andrea Maffia, Francesca Martignone, et al.. A lon-gitudinal analysis of the Italian national standardized mathematics tests. CERME 9 - Ninth Congress of the European Society for Research in Mathematics Education, Charles University in Prague, Faculty of Education; ERME, Feb 2015, Prague, Czech Republic. pp.1695-1701. �hal-01287998�
A longitudinal analysis of the Italian national
standardized mathematics tests
Laura Branchetti1, Federica Ferretti2, Alice Lemmo1, Andrea Maffia3, Francesca Martignone4, Mariagiulia Matteucci2 and Stefania Mignani2
1 University of Palermo, Palermo, Italy, [email protected], [email protected]
2 University of Bologna, Bologna, Italy, [email protected], [email protected], [email protected]
3 University of Modena and Reggio Emilia, Modena, Italy, [email protected]
4 University of Eastern Piedmont, Vercelli, [email protected]
This paper presents a longitudinal analysis of the out-comes of the Italian national standardized mathematics tests. By intertwining quantitative and qualitative meth-ods, we selected and analysed a set of linked questions among the tests administered to the same cohort of stu-dents first in grade 6 and then in grade 8. In particular, we focus on poor knowledge students and we argue an example of the analysis of two linked questions about graphical representation of fractions. The comparison between the two questions allows us to interpret some difficulties of students and to expect possible future be-haviours.
Keywords: Standardized mathematics tests, longitudinal
analysis, fractions, qualitative and quantitative analysis.
INTRODUCTION
This paper presents an “in progress” research devel-oped within the Ideas for the research project, funded by the Italian national institute for the educational evaluation of instruction (INVALSI). This project asks for new qualitative interpretative tools with the aim to integrate the statistical ones with them. These tools can be used by teachers to point out some groups of questions (in different grades) that could identify
poor knowledge students (see the next section for a
definition of this set) in specific mathematics con-tents. Our study focuses on a longitudinal analysis of mathematics standardizes tests outcomes collected by INVALSI in 2011 and 2013 respectively in grade 6 and 8 (therefore we analyse the same cohort of students who faced the INVALSI tests in grade 6 and 8). The aim of this analysis is to identify questions in which poor knowledge students have difficulties and, observing
their behaviours, to describe possible causes of these difficulties. Such causes are going to be the object of our future analysis in classroom activities.
We carried out an analysis that intertwined quali-tative and quantiquali-tative interprequali-tative tools in a lon-gitudinal study: in particular, we analysed items of the INVALSI tests focusing both on the mathematical contents involved and on the solution strategies de-veloped by students to face the tasks (qualitative anal-ysis), and using the information given by a statistical analysis of the national sample results (quantitative analysis). We expect this study to be an useful tool for teachers because the outcomes of the research could help teachers in identifying students’ difficulties in longitudinally linked items. These information could be used to implement educational activities aimed to avoid the persistence of wrong behaviours of students, similar to the ones observed in the research, and fu-ture failures in mathematics.
In the next phase of our research some of the items, selected from the INVALSI tests and analysed in the first part of our study, will be administered again during classroom activities in order to give empirical support to the analysis presented in this paper.
THEORETICAL LENSES
The INVALSI test is designed by Italian teachers selected by INVALSI according to their experience and education. INVALSI framework is based on to National Standards Ministero dell’Istruzione, Università e Ricerca, 2012). In our study, we take into account INVALSI framework but we integrate it with
A longitudinal analysis of the Italian national standardized mathematics tests (Laura Branchetti and colleagues)
1696
specific theoretical tools taken from the literature in mathematics education.
The items are presented in a written form with multiple choice questions, open questions, true or false and closed. As the topics are many and the test is faced by a large amount of students, we conjecture that the most frequent difficulties described in literature appear in students’ answers. For this reason, we create a list of difficulties found in literature for each topic. For instance, in this paper, we analyse two questions about fractions. Our theoretical framework on educational studies about fraction refers to the research carried out in the last thirty years and summarized in the Encyclopaedia of Mathematics Education (2014). In particular, Demetra Pitta-Pantazi describe some recurring misconceptions, for example:
Students often do not interpret fractions as numbers but view fractions as two numbers with a line between them. When adding fractions, they often add the nu-merators and denominators or are unable to order fractions from smaller to larger (e.g., Behr et al., 1992). (Encyclopaedia, 2014, pp. 470–476)
We use also the study of Fandiño Pinilla (2007) who offers a wide review about difficulties in fractions domain. These researches gave us the tools to identify and to interpret students’ answers to the INVALSI test items. In this paper, we analyse students’ answers iden-tifying some common difficulties and errors linked to the concept of fraction: (M1 – Divide in non-equiv-alent parts: count-and-match misconception) the “Epistemic” misconception of fraction as a part but non-equivalent to the others; (M2 – Answer d – n instead of the total d) the mistake in identifying the fraction numerator and denominator when students analyse some coloured parts in a grid of equivalent parts of a figure and considering the coloured part as numerator (n) and only the rest (d–n) as denominator, not the total amount of parts (d); (M3 – Divide in equiv-alent parts and take some parts) Student implicitly suggests that “some” cannot be “all”; it becomes easily an obstacle for the fractions equivalent to the unit. The INVALSI items are given to students in written form, but words are often mixed with images, tables, graphs and other representations. For this reason, some students’ difficulties could be related to semi-otic representations management. Indeed, we need a theoretical tool of analysis to figure out possible obstacles arising from this semiotic richness. We
use semiotic approach proposed by Duval: “there are always many possible semiotic representations of the same object. The higher process of thought, and especially mathematical activity, are based on this plural semiotic object representation” (Duval, 1993; 2008). Even if a richness of semiotic representations is necessary to conceptualize mathematical objects, in the very first steps of learning or for poor knowledge students coordinating many registers and connecting representations can be an obstacle. Different students errors in INVALSI tests can be interpret as a failure in verbal-graphic conversion, in the decoding of the text or in expressing a right solution in another register. In the examples argue below the students mistakes could be caused by a wrong transformation of the fraction verbal representation in the right graphic one or vice versa (S1) or in a incorrect transformation of the graphic results in the fractions’ register (S2). Our research question is: what kind of information, emerging from the analysis (both quantitative and qualitative) of the 8th grade items, are useful for the interpretation of the outcomes of the analysis of the 6th grade questions?
We conjecture that a longitudinal analysis of the answers of the same cohort of students, carried out through the comparison between the two data sets from different years, could be useful to better inter-pret the 6th grade outcomes in terms of the analysis of 8th grade items. Unfortunately, by means the analysis of the statistical data, we cannot follow the specific test outcomes for each student in different years; for this reason we need a criterion to link questions from different grade tests. In particular we decided to select questions that deal with longitudinal topics, identi-fied in the National Standards - Indicazioni Nazionali (2012), and which can be solved using the same scheme, namely the same sequence of actions, controls, opera-tional invariants and so on (Vergnaud, 2009).
METHODOLOGY
A longitudinal analysis of the tests, administered to the same cohort of students in different years has been performed integrating qualitative methods with quantitative ones. Starting from 2013 INVALSI test for grade 8 students, we consider 2011 test for sixth graders.
As concerns the qualitative analysis we analysed all the items of the INVALSI test for grade 8 and grade 6 focusing on some longitudinal contents: e.g., fraction and decimal representations of rational numbers and equivalent polygons. In this paper, we analyse items that deals with the fractions of a square area. The INVALSI team verifies the consistency of the whole test by Classical Test Theory tools (Cronbach alpha, point-biserial correlation coefficient). Then using an Item Response Theory approach (Van der Linden & Hambleton, 1997) the estimation of item characteristic parameters is carried on.
In our work we use some INVALSI test results to in-vestigate the behaviour of the items. First we apply a latent class analysis [1] to classify students and to judge the item characteristics. This statistical method gives a classification of students in a fixed number of groups characterized by different levels of perfor-mance. The classification is based on the estimated probability of correct answer of each item. Chosen the best number of groups, it is possible to interpret them (for example, the group with the worst performance, the group with the best performance and so on) and to investigate the probability of a correct answer for all items within each group. In this way items that show a particular response behaviour could be identified. Most items included in the test are unordered cate-gorical (nominal) multiple-choice items. The statisti-cal analysis and specifistatisti-cally the latent class analysis were conducted on dichotomous items, i.e. correct/ incorrect response. The analysis of the national
sam-ple (i.e., the students of the same cohort in grade 6 in 2011 and in grade 8 in 2013) showed the presence of groups/classes of students with a lower probability of correct answers in comparison with the results of the whole of students’ answers to all the items of the INVALSI test. Analysing the results obtained by the group with the lower performance, we selected some items in which the ‘weaker’ group had the low-est probability of correct answer compared to all the students who faced the same test. In our data we iden-tify five groups/classes [2] which consist of students with a similar response probability for the same items. We analyse the results on a national sample of about 28000 grade 8 students.
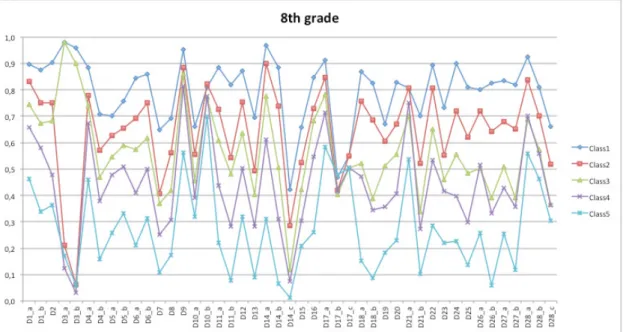
Class 5 (about the 23% of the students) is the class with the lowest outcome probabilities so we consider it as the set of poor knowledge students. Comparing class performances item by item, a set of questions in which only class 5 has low performances can be observed (Figure 1). In particular, we gather the items in which the success probability for class 5 is less than half of outcome probabilities for the other classes. Item D25 (Figure 1) has the maximum ratio, equal to 0.46, indeed the probability of class 5 right answer is 14% instead of the other classes whose outcome probabilities are a range from 30% to 81%. This item seemed to be a good candidate to study the possible difficulties face by poor knowledge students in INVALSI test. It was identified through the interweaving of qualitative and quantitative analysis: this is meaningful both as re-gards the contents and schemes involved (it concerns
A longitudinal analysis of the Italian national standardized mathematics tests (Laura Branchetti and colleagues)
1698
the identification of relationships between areas of polygons), and the results on the national sample.
AN EXAMPLE OF ITEMS ANALYSIS
Using Latent Class analysis on data from grade 8 test of 2013, we select a set of questions with low perfor-mances in particular for poor knowledge students. To give an example of our analysis we consider question D25 (Figure 2).
This is a multiple choice question with four options and only one right answer. The correct answer is Option D. Option A considers the number of all
piec-es as denominator, so it could be chosen by students who do not take in account the different areas of the pieces (M1); Option B may be selected considering only half of the Tangram maybe because of a wrong calculation of the area of the triangle not dividing by 2; Option C is selected by students that correctly divide in equivalent parts the square, but take 1 as numerator and the difference between total and 1 (16–1=15) as denominator (M2).
Looking at data, 42% of the students answer correctly and few students choose Option B and C (respectively 8.0% and 11.3%). A relatively high percentage of stu-dents, about 35%, chooses Option A.
Figure 2: Question D25 from the grade 8 INVALSI test administered in 2013 [2]
Figure 3: Characteristic Curve of question D25 from the grade 8 INVALSI test, 2013. The probability of options
In the Figure 3 on the abscissa of the graph we can read the measure of the ability of the students in the test (Latent Trait), and on ordinate there are the prob-abilities of options choice. Each option choice is rep-resented by a different Characteristic Curves (see the Legend in Figure 3). Analysing Characteristic Curve (Figure 3), we can notice that students with lowest performances, among which we expect to find poor knowledge students, have 60% of probability to choose Option A and less than 20% of probability to choose the others (see the framed region indicated by the arrow in the Figure 3). We link the question of grade 8 test, D25, to question D2 of grade 6 (Figures 4–5).
There’s a very good relation between the two ques-tions in terms of statistic trends. Moreover the task is similar and the strategies developed to answer can be compared. We have to stress that the two questions, even if similar, are different. The grade 6 question asks
to cover while the grade 8 one to find a fraction, but in both the cases the operation to carry out the solution is the same: to compose the square using triangles equivalent to the coloured one. In item D2, the per-centage of correct answers is 55.3%; since the question is not a multiple choice one, the Characteristic Curve gives information only in terms of “right-wrong” an-swer. In this case, students belonging to the lowest performances in the graphic have a probability about 10% to provide a correct answer, with more than 70% of failure. The percentages given by national results didn’t help us to understand which kind of errors stu-dents made because, in open questions, we can know only how many students gave the right answers (and how many students gave the wrong ones). In order to identify the possible wrong answers, we collected a sub-sample of 74 tests from the national survey of 2011 and we analyse the students’ answers. Obtained data are summarized in Table 1.
Figure 4: Question D2 from the grade 6 INVALSI test administered in 2011 [3]
A longitudinal analysis of the Italian national standardized mathematics tests (Laura Branchetti and colleagues)
1700
The percentage of right answers of this sub-sample is coherent with the national sample. Analysing wrong answers in Table 1, it is possible to identify some re-sults that can be the outcome of the same students’ solution schemes captured by the options of the D25 in 2013: therefore we conjecture a link between these difficulties observed in grade 8 and grade 6 results. As a matter of fact, students who answer 12 maybe look at triangle AOB as composed by three triangles, even if they are not equivalent (M1), and repeat this procedure in all the quarters of the square. This at-titude could be linked with students who answer 3. They probably consider the three triangles but do not extend the procedure to the others. Another inter-pretation of this phenomenon is that students could individuate the right number of triangles composing AOB, but do not consider in the calculation the grey one and count 3 triangles or 12 in the case of extending procedure for the whole square (M2). Students that answer 8 probably do not consider the grey part and count only the white pieces of AOB, then multiply by four (M2+M1). Who answers 4 maybe does not reach the instruction and refers to AOB instead of the grey triangle or just focus on AOB’s pieces (S3). As a mat-ter of facts, same codes are present in both questions’ analysis. This fact allows us/makes us able to link dif-ficulties in the two questions longitudinally. In par-ticular, students who answer 12 in D2 can behave as students who choose Option A or C. For instance, M1 refers to students who consider non-equivalent pieces and count 12 triangles in D2 (or 3 in the case in which do not extend the procedure to the whole square) and “one seventh” in D25. Otherwise, if we consider the second interpretation (M2), it is possible to link this attitude with the choice of Option C i.e. who does not consider the coloured triangle in counting. From the semiotic point of view, in both questions students have to recognize verbal, graphic and symbolic rep-resentations of fraction and to switch from one to the others. Indeed, one of the students’ difficulties could be found in conversion between registers (S1–S2). An interesting difference we have to take in account is
that the multiple choice question obliges the student to coordinate graphical register with the verbal one, because using written verbal register to represent
fractions is quite unused in Italian schools for the solutions. Probably some wrong answers are due to a combination of these difficulties. It will be possible to validate this conjecture only in the second part of the project, that will be carried out through interviews and classroom experiments – on the qualitative side – and correlating sets of data from the same sub-sample of students in the two grades. Comparing the percent-age of correct answers, we notice that from grade 6 to grade 8 it decreases of 13 percentage point (from 55% to 42%), thus there is a significant group of students that is able to give a correct answer to D2 question but not to D25, even if the operations required to give the right answer are the same. Indeed, there is a peculiar feature of D25 which make this question more diffi-cult and the main difference can be identified in the presence of a direct reference to fractions.
CONCLUSION AND FUTURE PRESPECTIVE
In this paper, we show an example of longitudinally linked items (these can be seen as paradigmatic exam-ples of questions) that can identify poor knowledge students in specific tasks. From the methodological point of view we selected these questions both using quantitative and qualitative methods intertwined. In particular statistical analysis on a big amount of data allowed us to focus our attention on a group of students, and starting from their performances we could select a set of items of interest for our aim. The opportunity to use data about the same cohort of stu-dent in different grades has been exploited linking the selected questions from 2013 test to questions of the 2011 one. This connection is achieved through a quali-tative study focuses on the epistemological, cognitive and educational aspects: i.e. we analyse the concepts involved, the representations and schemes (Vergnaud, 2009) developed by students in order to face that the task, and the possible difficulties arising from con-version among different semiotic representations (Duval, 2003).
The comparison of the linked questions outcomes strengthens the a priori analysis of possible students’ difficulties facing these items. We identified the same coded difficulties and the percentages in outcomes are
Answer 16 12 8 4 3 other missing
Percentage 52.7% 10.8% 5.4% 6.8% 4.1% 6.8% 13.4%
similar. The qualitative analysis of the grade 6 item allows us to formulate hypothesis for the selection of options in grade 8 item; it is reasonable to assume that grade 6 question outcomes can have a predictive power for the grade 8 ones, but only the classroom ex-periment can confirm it. In particular, as concerns the analysed questions, we can assume that the students who have difficulties in dividing a figure in equivalent pieces in grade 6 will tend to consider non-equivalent parts in graphical representation of fractions in grade 8. Similarly, the students who do not consider all the parts in a figure (in our example, the grey part) will be inclined to convert graphical representation of frac-tion in symbolic or verbal ones with a wrong denom-inator. Further interviews can confirm if students that have a difficulty in one of the questions have the same difficulties in the other. These interviews could be integrated with a correlation analysis of outcomes within already collected data.
The next phase of the project is going to involve some schools to identify students with peculiar difficulties on the selected items and to analyse their behaviours. We can show how our analysis points out some groups of questions (in different grades) that could identify poor knowledge students in specific mathematics contents. We would like to share with the teachers involved both our theoretical tools and the analysis of the data. It is important for us to understand if the tools produced are usable by the teachers.
These qualitative analysis of the items could be also useful for the teachers who design the test items be-cause it shows some elements that can discriminate in the assessment of poor knowledge students. From a statistical point of view, future developments of this work could include the implementation of a multilevel latent class analysis (Vermunt, 2003; 2008). In fact, traditional latent class analysis assumes that observations are independent while a hierarchical structure could be present (e.g., students nested within classes or schools). The multilevel latent class analysis could account for the nested structure of the data by allowing latent class intercepts to vary across groups (level 2 units) and by investigating if and how the groups affect the level 1 latent classes. In our study, this analysis would allow to examine how the proba-bility of belonging to a particular performance group could vary across level 2 units (classes or schools). Finally, covariates could be introduced at level 1 and
level 2 in order to predict the probability of belonging to a certain latent class.
REFERENCES
Behr M.J., Harel G., Post T., & Lesh R. (1992). Rational number, ratio and proportion. In D.A. Grouws (Ed.) (1992), Handbook
of research on mathematics teaching and learning (pp.
296–333). New York, NY: Macmillan.
Duval, R. (1993). Registres de représentation sémiotique et fonctionnement cognitif de la pensée. Annales de
didactique et de sciences cognitives, 5, 37–65.
Duval, R. (2008). Eight problems for a Semiotic Approach in Mathematics Education. In L. Radford, G. Schubring, & F. Seeger (Eds.), Semiotics in Mathematics Education (pp. 39–61). Rotterdam, The Netherlands: Sense Publishers. Fandiño Pinilla, M.I. (2007). Fractions: conceptual and didactic
aspects. Acta Didactica Universitatis Comenianae, 7, 23–45.
Lerman, S. (Ed.) (2014). Encyclopaedia of Mathematics
Education. Dordrecht, Heidelberg, New York, London:
Springer.
Linden, W. J., & Hambleton, R. K. (1997). Handbook of modern
item response theory. New York, NY: Springer.
Ministero dell’Istruzione, Università e Ricerca (2012). Indicazioni
nazionali per il curricolo della scuola dell’infanzia e del primo ciclo di istruzione. Rome, Italy: Author.
Vergnaud, G. (2009). The theory of conceptual fields. Human
development, 52(2), 83–94.
Linden, W. J., & Hambleton, R. K. (1997). Handbook of modern
item response theory. New York, NY: Springer.
Vermunt, J. K. (2003). Multilevel latent class mod-els. Sociological Methodology, 33, 213–239.
Vermunt, J. K. (2008). Latent class and finite mixture models for multilevel data sets. Statistical Methods in Medical
Research, 17(1), 33–51
ENDNOTES
1. We implemented a Random Effects Latent Class Analysis (random LCA); this R package fits latent class models, may include a random effect.
2. In our analysis the classification in five classes gave a good division of the group of students according their performance in the test.