www.nature.com/leu
Molecular detection of minimal residual disease is a strong predictive factor of
relapse in childhood B-lineage acute lymphoblastic leukemia with medium risk
features. A case control study of the International BFM study group
A Biondi1, MG Valsecchi2, T Seriu3, E D’Aniello1, MJ Willemse4, K Fasching5, A Pannunzio1, H Gadner5, M Schrappe3,
WA Kamps6, CR Bartram3, JJM van Dongen4and ER Panzer-Gru¨mayer5
1Clinica Pediatrica Universita` di Milano-Bicocca, Ospedale S Gerardo, Monza, Italy;2Department of Medicine and Public Health, Universita`
di Verona, Italy;4Department of Immunology, Erasmus University Rotterdam, Rotterdam, The Netherlands;3Institute of Human Genetics,
University of Heidelberg, Heidelberg, Germany;5Children’s Cancer Research Institute, St Anna Kinderspital, Vienna, Austria; and6Dutch
Childhood Leukemia Study Group (DCLSG), The Hague, The Netherlands
The medium-risk B cell precursor acute lymphoblastic leuke-mia (ALL) accounts for 50–60% of total childhood ALL and comprises the largest number of relapses still unpredictable with diagnostic criteria. To evaluate the prognostic impact of minimal residual disease (MRD) in this specific group, a case control study was performed in patients classified and treated as medium (or intermediate)-risk according to the criteria of
national studies (ALL-BFM 90, DCLSG protocol ALL-8,
AIEOP-ALL 91), which includes a good day 7 treatment response. Standardized polymerase chain reaction (PCR) analysis of patient-specific immunoglobulin and T cell receptor gene (TCR) rearrangements were used as targets for semi-quantitative estimation of MRD levels: ⭓10−2, 10−3, ⭐10−4. Twenty-nine relapsing ALL patients were matched with the same number of controls by using white blood cell count (WBC), age, sex, and time in first complete remission, as matching factors. MRD was evaluated at time-point 1 (end of protocol Ia of induction treatment, ie 6 weeks from diagnosis) and time-point 2 (before consolidation treatment, ie 3 months from diagnosis). MRD-based high risk patients (⭓10−3at both time-points) were more frequently present in the relapsed cases than in controls (14vs 2), while MRD-based low risk patients (MRD negative at both time-points) (1vs18) showed the opposite distribution. MRD-based high risk cases experi-enced a significantly higher relapse rate than all other patients, according to the estimated seven-fold increase in the odds of failure, and a much higher rate than MRD-based low risk patients (OR=35.7;P=0.003). Using the Cox model, the predic-tion of the relapse-free interval at 4 years was 44.7%, 76.4% and 97.7% according to the different MRD categories. MRD-based risk group classification demonstrate their clinical relevance within the medium-risk B cell precursor ALL which account for the largest number of unpredictable relapses, despite the cur-rent knowledge about clinical and biological characteristics at diagnosis. Therefore, MRD detection during the first 3 months of follow-up can provide the tools to target more intensive ther-apy to those patients at true risk of relapse.Leukemia(2000)
14, 1939–1943.
Keywords: childhood ALL; B cell precursor ALL; minimal residual
disease; immunoglobulin; T cell receptor; gene rearrangements
Introduction
The attempt to tailor the intensity of treatment to patient’s risk of relapse, represents one of the major issues in the current therapeutic strategy of childhood acute lymphoblastic leuke-mia (ALL).1Risk classification comprises the use of both
clini-cal (age, liver and spleen size),2,3and biological (leukocyte or
blast count, phenotype, DNA index, chromosomal
Correspondence: A Biondi, Centro Ricerca ‘M Tettamanti’, Clinica Pediatrica, Universita` di Milano-Bicocca, Ospedale S Gerardo, Via Donizetti 106, 20052 Monza (MI), Italy; Fax: 39 039 233 2167 Received 30 December 1999; accepted 5 July 2000
abnormalities) features at diagnosis3,4 and the evaluation of
early response to pre-phase treatment.5,6
The medium-risk group (MRG) represents a rather hetero-genous cohort of patients.1,7In the recently closed national
studies of the Austrian and German Berlin–Frankfurt–Mu¨nster (BFM) group (ALL-BFM 90),8 the Associazione Italiana di
Ematologia e Oncologia Pediatrica (AIEOP-ALL 91)9 or the
Dutch Childhood Leukemia Study Group (DCLSG, protocol ALL-8),10 the patients were stratified into standard-risk (SR),
medium-risk (MR) and high-risk (HR) treatment groups, mainly according to the presenting features, ie leukemic cell mass and prednisone response.2 The medium-risk group covers
more than half of newly diagnosed ALL and has 20–25% of children relapsing at 4–5 years from diagnosis.8–10Compared
to high risk patients, the percentage of failures is relatively low, but they account for more than half of all relapses in most studies.8–10Identification of the children who are likely
to relapse, should be sufficiently early to allow intensification of their treatment schedule and thereby improve their outcome.
We and others have recently shown that monitoring of minimal residual disease (MRD) by highly sensitive molecular or immunological approaches, gives clinically relevant insight into the effectiveness of treatment.11–15Combined information
on MRD from the first 3 months of treatment identified patients at different risk of relapse and it has been proposed to be relevant for tailored treatment.11–14 The series of the
International BFM Study Group (I-BFM-SG) on MRD rep-resents the largest so far reported,14 and 65% of this series
consisted of patients with medium-risk features, but the evalu-ation of the prognostic impact of MRD for these medium risk patients was hampered by the relatively small number of events and by the heterogeneity of the group with regard to MRD information.
This prompted us to design a matched case-control study, by focussing on the medium-risk patients already included in the I-BFM-SG MRD study,14and by increasing the number of
medium-risk relapsed cases analyzed for MRD, with the same modalities and in the same countries which participated in the previous study. This is an efficient type of study design, which provides an estimate of the impact of MRD on the odds of failure, and adjusts for heterogeneity in presenting features by matching.16 In addition, the study allowed us to explore
different types of MRD classification and, under certain assumptions, to project the impact of early detection of MRD positivity in relapse-free interval.
1940
Materials and methods Patients and cell samples
Bone marrow samples were taken at diagnosis and during fol-low-up times (time-point 1 corresponds to the end of phase la of the induction, ie 5–6 weeks from diagnosis; time-point 2 before consolidation treatment, ie 3 months from diagnosis),8–10 in 29 relapsing ALL patients and in the same
number of matched controls (see below). Out of the 29 cases, 17 relapses in the MRG were already included in I-BFM-SG MRD series14 and 12 cases were additionally analyzed for
MRD. All relapses occurred in the bone marrow. All controls were from the I-BFM-SG MRD series. All children were enrolled in the ALL-BFM 90, the AIEOP-ALL 91, or the DCLSG ALL-8 protocols8–10which shared the same BFM-based criteria
for risk definition and intensive chemotherapy.2 We
con-sidered patients with B cell precursor phenotype and age greater than 1 year, who were classified as medium risk according to the following criteria: BFM risk factor (RF)⭓0.8 (and ⬍1.7 only for AIEOP-ALL 91);2 good prednisone
response (as defined if the peripheral blood blast cell count/l at day 8 is⬍1000);2CR at day 35 or 42; absence of t(9;22)
and t(4;11) translocations and no CNS disease (only for AIEOP-ALL 91).9
Mononuclear cells were isolated from the bone marrow samples and stored in liquid nitrogen or at−70°C for DNA extraction. Of the 58 patients included in the analysis: 10 were from Austria, 13 from Germany, 28 from Italy and seven from the Netherlands. They fulfilled the following criteria: (1) preferably, two PCR targets at least one of which reached a sensitivity of 10−4; (2) MRD data known at the two predefined
time points.14In those cases (three), where MRD data only at
time-point 2 were available, patients were included if MRD level was ⬎10−4, as we assumed the same or higher MRD
level at the previous time-point.
Study design and statistical analysis
This study is partially nested in the cohort of patients prospec-tively enrolled in the I-BFM-SG on MRD.14The ‘cases’ in this
study are patients who relapsed. Each case was matched to one control selected among patients of the same gender and country who had been in continuous complete remission (CCR) at least as long as the case and who had similar WBC count and age at diagnosis. According to sample size calcu-lation, 25 matched pairs were needed to show, with 90% power and 0.05 type one error level, an odds ratio (OR) of 7.5, ie a 7.5-fold increase in the relapse rate in MRD positive patients with respect to the others (assuming a 10% proportion of MRD positivity in the control group). A total number of 29 cases were analyzed and for each of these, one matched con-trol was found from the original study cohort (in three cases only the matching on sex was not possible). The odds ratio estimator, confidence limits and exact conditional test on the difference for matched case-control studies were calculated according to Breslow and Day.17 Secondary analyses
con-trasting MRD-high with MRD-intermediate and low-risk patients were performed for exploring purposes. Note that, in the case-control study, cases (relapses) are by design over represented as 50% of the patients, rather than the natural distribution of 21% observed in medium-risk patients in the prospective cohort of the I-BFM-SG study.14In order to
esti-mate the relapse-free interval (RFI) (defined as the time from
complete remission to relapse; in case no relapsed occurred, the time is censored at the last follow-up or at death in remission), we resorted to the background hazard function as estimated, according to Cox,18in the prospective cohort, and
made the following assumptions: proportional hazards between MRD-based risk groups and the OR estimate as an approximation of the hazard ratio. Further, we should be aware in interpreting results, of possible biases that could have occurred in the cohort and in the case-control study, had the preserved samples been disproportionately available for differ-ent types of patidiffer-ents.
Identification of PCR targets at diagnosis
The procedure for the identification of the patient-specific probe according to the junctional regions of the T cell recep-tor (TCR) gamma (TCRG), delta (TCRD) and kappa deleting elements (Kde) recombinations has been described in detail.19
Briefly, the rearrangements were detected by Southern blot analysis and confirmed by PCR analysis and direct sequencing of the junctional regions with standardized sets of oligonucle-otide primers. On the basis of the sequence data of the junc-tional regions, patient-specific oligonucleotides were designed for each identified MRD-PCR target, using OLIGO 5.0 software (National Biosciences, Plymouth, MN, USA).19
MRD detection during follow-up
The MRD-PCR analyses of bone marrow samples during fol-low-up were done by single PCR analysis of 1g of DNA (equivalent to 105–106 cells) with the standardized primer
sets, followed by dot blotting and hybridization with the corre-sponding 32P-labelled patient-specific junctional region
probe, as previously described.19,20The hybridization signals
were visualized by use of radiographic films or phosphor-imaging. The sensitivity of each identified MRD-PCR target was established by use of a dilution experiment, in which DNA from the leukemic cells at diagnosis was 10-fold diluted into DNA control from a mixture of blood mononuclear cells of about 10 different healthy donors.19,20 The concentration
of leukemic cells in the bone marrow samples during follow-up was done by comparing the signals with those of the 10-fold dilution samples of DNA at diagnosis. This resulted in reproducible semi-quantitative estimations of MRD-PCR results of 10−2or more, 10−3, 10−4or less.
Results
Median WBC was 17×109/l among cases (range: 4–
160×109/l) and 14×109/l among controls (range: 1–
116×109/l). Median age at diagnosis was 44 and 42 months
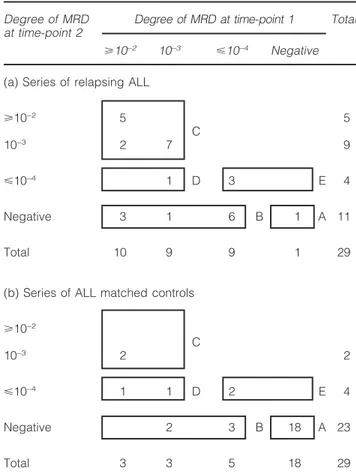
among cases and controls, respectively. Median time from diagnosis to relapse was 30 months in the 29 relapsing patients who constitute the cases; the median follow-up time of the patients in CCR who are the matched controls was 50 months. Table 1 summarizes the degree of MRD at time-points 1 and 2 in the cases (a) and control series (b). According to the MRD information at time-point 1 and 2, patients were classified in the low-risk MRD group when MRD negatively was present at both time points (group A), in the high-risk group when MRD was⭓10−3at both time-points (group C),
1941
Table 1 Series of relapsing ALL and matched controls
Degree of MRD Degree of MRD at time-point 1 Total at time-point 2
⭓10−2 10−3 ⭐10−4 Negative
(a) Series of relapsing ALL
⭓10−2 5 5 C 10−3 2 7 9 ⭐10−4 1 D 3 E 4 Negative 3 1 6 B 1 A 11 Total 10 9 9 1 29
(b) Series of ALL matched controls ⭓10−2 C 10−3 2 2 ⭐10−4 1 1 D 2 E 4 Negative 2 3 B 18 A 23 Total 3 3 5 18 29
A–E, MRD-based risk groups (A, low; B, D and E, intermediate; C, high), as reported in the I-BFM-SG study on MRD.14
intermediate-risk group (groups B, D, E). As shown in Table 1, MRD-based high risk patients were more frequent within cases than controls (14 vs 2) while MRD-based low risk was under-represented in cases as compared to controls (1 vs 18). The remaining patients (14 cases and nine controls) had MRD-based intermediate-risk features.14The case-control results are
shown in Table 2, both for the MRD-based high risk patients
vs all other patients (a) and for the three MRD-based risk group
(b). The MRD-based high risk patients experienced a signifi-cantly higher relapse rate than all others, according to the esti-mated seven-fold increase in the odds of failure (OR=7.0,
P=0.01), and a much higher rate than patients with MRD-based low-risk features (OR=35.7, P=0.003). The odds of failure for patients with MRD⭓10−3are higher than for MRD
intermediate patients (groups B, D, E), but not significant (OR=3.0, P=0.18) (b). As most of the cases (24) had relapsed early, ie within 3 years from diagnosis, we also restricted the analysis to a more homogeneous subset in terms of outcome. The results on the 24 matched pairs, as shown in Table 3, are very similar to those obtained without time constraints in the design.
In order to project the relapse-free interval curve in the three strata defined by MRD, we combined results from the original prospective cohort,14 and from this case-control
study. The background relapse rate was estimated on the orig-inal cohort,18 accounting for the natural mixture of patients
and of relapses, while the OR estimates (Table 2) were used to discriminate the outcome between strata. The projected 4-year relapse-free interval was 44.7%, 76.4% and 97.7% for
Table 2 Estimated odds ratios (OR) according to different MRD levels (a) Ca Co MRD (1,2)⭓10−3(group C)a 14 2 16 Groups A, B, D, Ea 15 27 42 29 29 58
OR (group Cvsother groups)=7.0 (95% CI=1.96–45.45)
Pvalue=0.01 (b) Ca Co MRD (1,2)⭓10−3(group C)a 14 2 16 Groups B, D, Ea 14 9 23 MRD (1,2) negative (group A)a 1 18 19 29 29 58 OR (group Cvsgroup A)=35.7 (95% CI=5.32–1000.0) Pvalue=0.003 OR (group Cvsgroup B, D, E)=3.0 (95% CI=0.68–20.41) Pvalue=0.18
95% confidence interval (CI) andPvalue of the exact conditional test.
aA–E,=MRD-based risk groups as reported in the I-BFM-SG study
on MRD.14
the MRD-based high-risk, intermediate-risk and low-risk groups, respectively. With caution due to the statistical assumptions underlying this calculation, these figures clarify the heterogeneity which is present in the medium risk patients (⬎1 year of age). Finally, we explored the implication of changing the cut-off point for the definition of MRD-based high risk, ie from 10−3to 10−4(data not shown). This change
induced a slight decrease in the odds ratio estimates con-trasting the three MRD categories, but, more importantly, a decrease in the specificity of the MRD test. The low sensitivity of the test, defined as in Table 2 (14/29=48%) is counter-balanced by a high specificity (27/29=93%). By lowering the cut-off points for the definition of positivity, the increase in sensitivity (up to 69%) is paid by a decrease in specificity to 77% (data not shown).
Discussion
This case-control study of MRD in childhood ALL demon-strates that careful molecular monitoring of in vivo treatment response might provide the tools to target more intensive ther-apy to medium-risk B cell precursor ALL at true risk of relapse. Although variably defined in different study groups, this group accounts for 50–60% of total ALL and comprises the largest number of relapses still unpredictable with currently available genetic or immunological markers.1 In the context of the
I-BFM study on MRD,1481 patients with B cell precursor ALL,
over 1 year of age, and classified as medium risk according to clinical and biological features,8–10 were found to be
remarkably heterogeneous with respect to MRD levels. According to MRD degree at time-points 1 and 2,1415% were
1942 Table 3 Estimated odds ratios (OR) according to different MRD levels, accounting for cases relapsed within 3 years and matched controls (a) Ca Co MRD (1,2)⭓10−3(group C)a 12 2 14 Groups A, B, D, Ea 12 22 34 24 24 48
OR (group Cvsother groups)=6.0 (95% CI=1.64–38.46)
Pvalue=0.02 (b) Ca Co MRD (1,2)⭓10−3(group C)a 12 2 14 Other groups (B, D, E)a 11 5 16 MRD (1,2) negative (group A)a 1 17 18 24 24 48 OR (group Cvsgroup A)=30.3 (95% CI=4.41–1000.0) Pvalue=0.005 OR (group Cvsgroup B, D, E)=2.4 (95% CI=0.52–16.95) Pvalue=0.29
95% confidence interval (CI) andPvalue of the exact conditional test.
A–E=MRD-based risk groups as reported in the I-BFM-SG study on MRD.14
classified as MRD-based high-risk, 47% as MRD-based low-risk and the remaining 38% as MRD-based intermediate-low-risk group. Overall they experienced 17 relapses, all but one in the MRD-based high (9) and MRD-based intermediate (7) risk groups. The limited number of events hampered the evalu-ation of the real impact of MRD detection to assess the risk of relapse within the medium-risk ALL subgroup.
We designed a matched case-control study, partially nested in the cohort: we used as much as possible the data already available,14 and the study was enriched with new cases in
order to reach the target sample size. The analysis performed on 29 matched case-control pairs, clearly confirms that high MRD levels (⭓10−3) represent a strong prognostic factor, being
associated with a seven-fold increase (Cl: 1.96–45.45) and a 35-fold increase (Cl: 5.32–1000.0) in the rate of relapse when compared to all other patients (MRD-based low or intermediate) and only to those with MRD-based low risk, respectively. MRD-based intermediate risk patients showed a failure rate not significantly different from the MRD-based high risk, but still significantly different from the MRD-based low risk patients (OR=12.3, Cl: 2.3–38.2).
Interestingly, five relapses occurred more than 36 months after diagnosis (at 39, 43, 45, 46, 50 months). In two of the cases, the levels of MRD at both time-points 1 and 2 were ⭓10−3(MRD-based high risk), thus being potentially eligible
for a more intensive treatment. The remaining three cases, were classified as intermediate-risk and accordingly leave open the question of the MRD strength as measured at early time-points of treatment, to identify patients at risk for late or very late relapses.
These data confirm and further extend the strong predictiv-ity of MRD detection as an independent prognostic factor in childhood ALL11–15in particular for those patients considered
at low risk of relapse.10–15 They pertain to a very large ALL
subgroup, with B cell precursor phenotype, age greater than 1, with early good response to treatment (as assessed by in
vivo prednisone-response) and thus not likely to be further
classified for the risk of relapse according to standard clinical features. Several known biological features could be addition-ally considered to further stratify risk classification for medium B-lineage ALL.21–25In the perspective to further improve
gen-etically-based risk classification, and to achieve a more rational selection of therapy (based on risk of treatment failure), MRD detection could be used as a new prognostic factor.
If the tailored treatment remains the major goal to be achi-eved, it still remains a challenge on which clinical option should be considered for improvement of ALL patients with intermediate- or high-risk MRD features. Although the possibility to achieve the same results in the MRD-based intermediate-risk subgroup as those obtained in the MRD-based low-risk subgroup appears to be unlikely, there is still room for treatment options to be tested in large clinical stud-ies. Nachman et al26 recently showed that augmented
post-induction chemotherapy results in an excellent outcome for patients with high-risk ALL (1 to 9 years of age and WBC of at least 50×109/l or 10 years or older age) and with a slow
response to initial therapy. This augmented post-induction therapy could represent a clinical option to be evaluated for medium-risk B cell precursor ALL patients being reassigned to high-risk according to MRD data. Along this line the future clinical studies of the I-BFM-SG will test the relevance of MRD risk classification for pediatric ALL.
Acknowledgements
This work was supported by Fondazione M Tettamanti, Assoc-iazione Italiana per la Ricerca sul Cancro (AIRC) and MURST 40% (AB, ED’A and GM); by a grant from the Deutsche Kreb-shilfe (to CRB); by the Osterreichische KinderkrebKreb-shilfe (ERP-G and KF), by a grant from the FWF No. P 13575-MED (to ERP-G); by Dutch Cancer Society (Koningin Wilhelmina Fonds), grant EUR 94-852 (MJW and JJMvD).
References
1 Pui C-H. Recent advances in the biology and treatment of child-hood acute lymphoblastic leukemia. Curr Opin Hematol 1998; 5: 292–301.
2 Reiter A, Schrappe M, Ludwig WD, Hiddemann W, Sauter S, Henze G, Zimmermann M, Lampert F, Havers W, Niethammer D, Odenwald E, Ritter J, Mann G, Welte K, Gadner H, Riehm H. Chemotherapy in 998 unselected childhood acute lymphoblastic leukemia patients. Results and conclusions of the multicenter trial ALL-BFM 86. Blood 1994; 84: 3122–3133.
3 Smith M, Arthur D, Camitta B, Carroll AJ, Crist W, Gaynon P, Gelber R, Heerema N, Korn EL, Link M, Murphy S, Pui CH, Pullen J, Reamon G, Sallan SE, Sather H, Shuster J, Simon R, Trigg M, Tubergen D, Uckun F, Ungerleider R. Uniform approach to risk classification and treatment assignment for children with acute lymphoblastic leukemia. J Clin Oncol 1996; 14: 18–24. 4 Raimondi SC. Current status of cytogenetic research in childhood
acute lymphoblastic leukemia. Blood 1993; 70: 2237–2251. 5 Gaynon PS, Desai AA, Bostrom BC, Hutchinson RJ, Lange BJ,
Nachman JB, Reaman GH, Sather HN, Steinherz PG, Trigg ME, Tubergen DG, Uckun FM. Early response to therapy and outcome
1943 in childhood acute lymphoblastic leukemia. Cancer 1997; 80:
1717–1726.
6 Schrappe M, Reiter A, Riehm H. Cytoreduction and prognosis in childhood acute lymphoblastic leukemia. J Clin Oncol 1996; 14: 2403–2406.
7 Childhood ALL Collaborative Group. Duration and intensity of maintenance chemotherapy in acute lymphoblastic leukemia: overview of 42 trials involving 12 000 randomised children.
Lan-cet 1996; 347: 1783–1788.
8 Schrappe M, Reiter A, Ludwig W-D, Harbott J, Zimmermann M, Hiddemann W, Niemeyer C, Henze G, Feldges A, Zintl F, Kornhuber B, Ritter J, Welte K, Gadner H, Riehm H. Improved outcome in childhood ALL despite reduced use of anthracyclines and of cranial radiotherapy. Results of trial ALL-BFM 90. Blood 2000; 95: 3310–3322.
9 Conter V, Arico` M, Valsecchi MG, Rizzari C, Testi A, Miniero R, Di Tullio MT, Lo Nigro L, Pession A, Rondelli R, Messina C, San-toro N, Mori PG, De Rossi G, Tamaro P, Silvestri D, Biondi A, Basso G, Masera G. Intensive BFM chemotherapy for childhood ALL: interim analysis of the AIEOP-ALL 91 study. Haematologica 1998; 83: 791–799.
10 Kamps WA, Bo¨kkerink JP, Hakvoort-Cammel FG, Weening RS, Verman AJ, Weeden JF, van Wering ER, van der Does-van der Berg A. Results of the DCLSG-study ALL8 (1991–1997): BFM-ori-ented treatment without cranial irradiation (CI) and comparing conventional oral and high doses intravenous 6-mercaptopurine.
Med Ped Oncol 1999; 33: 169a.
11 Wasserman R, Galili N, Ito Y, Silber JH, Reichard BA, Shane S, Womer RB, Lange B, Rovera G. Residual disease at the end of induction therapy as a predictor of relapse during therapy in child-hood B-lineage acute lymphoblastic leukemia. J Clin Oncol 1992;
10: 1879–1888.
12 Brisco MJ, Condon J, Hughes E, Neoh SH, Sykes PJ, Seshadri R, Toogood I, Waters K, Tauro G, Ekert H, Morley A. Outcome pre-diction in childhood acute lymphoblastic leukemia by molecular quantification of residual disease at the end of induction. Lancet 1994; 343: 196–200.
13 Cave H, van der Werff ten Bosch J, Suciu S, Guidal C, Waterkeyn C, Otten J, Bakkus M, Thielemans K, Grandchamp B, Vilmer E. Clinical significance of minimal residual disease in childhood acute lymphoblastic leukemia. New Engl J Med 1998; 339: 591–598.
14 van Dongen JJ, Seriu T, Panzer-Grumayer ER, Biondi A, Pongers-Willemse MJ, Corral L, Stolz F, Schrappe M, Masera G, Kamps WA, Gadner H, van Wering ER, Ludwig WD, Basso G, de Bruijn MA, Cazzaniga G, Hettinger K, van der Does-van den Berg A, Hop WC, Riehm H, Bartram CR. Prognostic value of minimal residual disease in acute lymphoblastic leukemia in childhood. Lancet 1998; 352: 1731–1738.
15 Coustan-Smith E, Behm FG, Sanchez J, Boyett JM, Hancock ML, Raimondi SC, Rubnitz JE, Rivera GK, Sandlund JT, Pui CH, Cam-pana D. Immunological detection of minimal residual disease in children with acute lymphoblastic leukemia. Lancet 1998; 351: 550–554.
16 Marubini E, Valsecchi MG. Analysing Survival Data from Clinical
Trials and Observational Studies. John Wiley. Chichester, 1995.
17 Breslow NE, Day NE. Statistical Methods in Cancer Research, vol.
1: The Analysis of Case-Control Studies. International Agency for
Research in Cancer: London, 1980.
18 Cox DR. Regression models and life-tables (with discussion). J Roy
Stat Soc 1972; 34: 187–220.
19 Pongers-Willemse MJ, Seriu T, Stolz F, d’Aniello E, Gameiro P, Pisa P, Gonzalez M, Bartram CR, Panzer-Grumayer ER, Biondi A, San Miguel JF, van Dongen JJ. Primers and protocols for stan-dardized detection of minimal residual disease in acute lymphobl-astic leukemia using immunoglobulin and T cell receptor gene rearrangements and TAL1 deletions as PCR targets: report of the BIOMED-1 Concerted Action: investigation of minimal residual disease in acute leukemia. Leukemia 1999; 13: 110–118. 20 Beishuizen A, de Bruijn MA, Pongers-Willemse MJ, Verhoeven
MA, van Wering ER, Hahlen K, Breit TM, de Bruin-Versteeg S, Hooijkass H, van Dongen JJ. Heterogeneity in junctional regions of immunoglobulin kappa deleting element rearrangements in B cell leukemias: a new molecular target for detection of minimal residual disease. Leukemia 1997; 11: 2200–2207.
21 Rubnitz JE, Downing JR, Pui CH, Shurtleff SA, Raimondi SC, Evans WE, Head DR, Crist WM, Rivera GK, Hancock ML, Boyett JM, Buijs A, Grosveld G, Behm FG. TEL gene rearrangement in acute lymphoblastic leukemia: a new genetic marker with prognostic significance. J Clin Oncol 1997; 15: 1150–1157.
22 Borkhardt A, Cazzaniga G, Viehmann S, Valsecchi MG, Ludwig WD, Burci L, Mangioni S, Schrappe M, Riehm H, Lampert F, Basso G, Masera G, Harbott J, Biondi A. Incidence and clinical relevance of TEL/AML 1 fusion genes in children with acute lymphoblastic leukemia enrolled in the German and Italia multicenter therapy trials. Blood 1997; 90: 571–577.
23 Takeuchi S, Bartram CR, Miller CW, Reiter A, Seriu T, Zimmerann M, Schrappe M, Mori N, Slater J, Miyoshi I, Koeffler HP. Acute lymphoblastic leukemia of childhood. Identification of two dis-tinct regions of deletion on the short arm of chromosome 12 in the region of TEL and KIP1. Blood 1996; 87: 3368–3374. 24 Rubnitz JE, Behm FG, Pui CH, Evans WE, Relling MV, Raimondi
SC, Harrison PL, Sandlund JT, Ribeiro RC, Grosveld G, Downing JR. Genetic studies of childhood acute lymphoblastic leukemia with emphasis on p16, MLL, and ETV gene abnormalities: results of St Jude Total Therapy Study XII. Leukemia 1997; 11: 1210– 1206.
25 Sauerbrey A, Stammler G, Zintl F, Volm M. Expression and prog-nostic value of the retinoblastoma tumour suppressor gene (RB-1) in childhood acute lymphoblastic leukemia. Br J Haematol 1996;
94: 99–104.
26 Nachman JB, Sather HN, Sensel MG, Trigg ME, Cherlow JM, Lukens JN, Wolff L, Uckun FM, Gaynon PS. Augmented post-induction therapy for children with high-risk acute lymphoblastic leukemia and a low response to initial therapy. New Engl J Med 1998; 338: 1663–1671.