NICCOLÒ BALDI, DDS, MSc
Postgraduate student, Oral Surgery Unit, Department of Translational Medicine, University of Florence, Italy JACOPO BUTI, DDS, PhD, MPerio RCSEd Associate Professor in Clinical Periodontology, UCL Eastman Dental Institute, London
MADGA MENSI, DDS
Adjunct Professor, Unit of Oral Surgery, Department of Surgical Specialities, Radiological Science and Public Health, University of Brescia, Italy FORTUNATO ALFONSI, DDS
Unit of Oral Surgery and Implantology, Department of Surgery, University Hospital of Geneva, Clinique Universitaire Mèdicine Dentaire, Geneva, Switzerland CHIARA CINQUINI, DDS
Associate Professor, Oral Medicine and Surgery, Department of Surgical, Medical and Molecular Pathology and Special Needs, University Hospital of Pisa, University of Pisa, Italy
PAOLO TONELLI, MD, DDS
Associate Professor, Oral Surgery Unit, Department of Translational Medicine, University of Florence, Italy ANTONIO BARONE, DDS, PhD, MSc
Associate Professor, Unit of Oral Medicine and Surgery, Department of Surgical, Medical and Molecular Pathology and Special Needs, University Hospital of Pisa, University of Pisa, Italy
Correspondence to:
Niccolò Baldi
Oral Surgery Unit, Department of Translational Medicine, University of Florence
Largo Brambilla 3, Florence, Italy E-mail: [email protected]
XENOGENEIC DERMAL MATRIX
VERSUS
AUTOLOGOUS CONNECTIVE TISSUE GRAFT
VERSUS
NO GRAFT AT ABUTMENT CONNECTION FOR IMPROVING AESTHETICS:
6-MONTH OUTCOMES OF A RANDOMISED CONTROLLED TRIAL
OBJECTIVES. The aim of this multicentre randomised controlled trial was to evaluate the
efficacy of a xenogeneic dermal matrix in widening keratinised peri-implant tissues du-ring second-stage surgery, and to compare it to both autologous connective tissue graft and a control group with no augmentation.
MATERIAL AND METHODS. Patients requiring an increase in keratinised gingiva width
were enrolled by four university/dental practices and randomised into three different groups for grafting procedures at the implant uncovering stage: either xenogeneic der-mal matrix (Group X), autologous connective tissue graft (Group A) or no graft (control, Group C). The primary outcomes were width of keratinised tissue and facial soft tissue levels, evaluated at three different time points (T0, implant uncovering stage; T1 and T2, six weeks and six months after surgery, respectively). Secondary outcomes were: implant failure, complications, marginal bone loss, papilla index, facial soft tissue level, pink esthetic score, and aesthetic assessment by patients.
RESULTS. Thirty-six patients, with one implant per patient, were enrolled at two centres
(18 at each centre): 12 for control, 12 for xenogeneic dermal matrix and 12 for autologous tissue graft. Three patients dropped out and two patients from the autologous group had implant failures. No complications were recorded. After six months, the width of keratini-sed tissue increakeratini-sed by 0.16 ± 1.01 (P = 0.79), 1.05 ± 0.76 (P = 0.01) and 0.80 ± 1.73 mm (P = 0.28), and facial soft tissue level was -0.95 ± 0.85 (P = 0.04), 0.32 ± 0.57 (P = 0.15) and 0.35 ± 0.79 mm (P = 0.30) respectively in Groups C, X and A groups. Between-group analysis showed that, with respect to control, only facial soft tissue level (1.31 mm, P = 0.01) and width of keratinised mucosa (2.43 mm, P = 0.01) outcomes in the autologous graft group were statistically significant at T2. Mean marginal bone loss between T0-T2 was -0.4 ± 0.4mm, with no differences between groups. Pink aesthetic score showed no significant differences between groups, being 0.89 for A-C (P = 0.41), 0.88 for A–X (P = 0.63) and 0.72 for X-C (P = 0.88).
Patient’s aesthetic satisfaction (Visual Analogue Scale) was 92.2 ± 8.4, 93.8 ± 7.7, 97.2 ± 3.0, for Groups C, X and A, respectively. Between the two dental centres, only facial soft tissue level at T0–T2 was significantly different, by 0.67 ± 0.62 mm (P = 0.03).
CONCLUSIONS. After six months, autologous connective tissue graft yielded a significant
gain in facial soft tissue levels and width of keratinised mucosa, as compared to the control group (no graft).
CONFLICTS OF INTEREST STATEMENT. This study received support from Tecnoss, which
provided Derma membranes, and Sweden & Martina, which that provided free dental implants and healing abutments.
INTRODUCTION
In single-tooth implant restorations, the final level of the gingival margin depends on multiple factors such as the peri-implant biotype and crestal bone level, as well as the corono-apical position and inclination of the implant1. Peri-implant soft tissue recession is a common fin-ding2. It usually develops during the first six months after prosthetic loading, mainly on the buccal side, and results in exposure of the metal component, thereby compromising the ae-sthetics of the restoration2,3. Aesthetic failure can also be caused by mismatching soft tissue colour and texture, and incomplete/absent interdental papillae4. In addition, the colour of the implant metal is more likely to be visible through a thin peri-implant mucosa, impairing the aesthetic outcome5.
Linkevicius et al. detected a correlation between clinical outcome and gingival thickness, with less bone loss around implants surrounded by thick mucosa (≥ 2 mm)6. On the other hand, in a 5-year prospective clinical trial, Todisco et al. recorded that, although the height of the ke-ratinised mucosa did not seem to alter the clinical outcomes, its presence on vestibular and lingual sites was associated with increased marginal bone loss when compared to implants having at least one side without keratinised mucosa7.
In fact, even if the presence of keratinised peri-implant mucosa does not seem to alter long-term implant survival, it can influence the biological outcome8. Lang & Loe suggested that a width of at least 2 mm of keratinised tissue is essential for peri-implant health9. This has been confirmed by studies showing that implants surrounded by less than 2 mm of keratinised tissue are more likely to accumulate plaque, have a 3-fold greater chance of developing ble-eding on probing, and are more prone to cause discomfort during brushing10,11.
The volume of keratinised peri-implant tissue can be increased via different augmentation techniques, which can be performed as a preliminary intervention, during implant placement, at the uncovering phase, or at any time gingival recession appears12. At present, however, there is insufficient evidence on the best technique for peri-implant soft tissue augmenta-tion13.
Nevertheless, autologous connective tissue harvested from the palate and used in conjun-ction with a coronally repositioned flap has been successfully applied in periodontal surgery for the treatment of gingival recession, and is associated with major gains in keratinised tis-sue14. Similarly, the flap can be elevated and grafted with autologous connective tissue during the uncovering stage of two-step implant treatments. In fact, in a split-mouth study, Wiesner et al. showed that implant sites grafted with autologous connective tissue not only developed a thicker keratinised mucosa, but also achieved significantly better aesthetic scores15. Howe-ver, despite the good clinical outcomes, the use of gingival tissue harvested from the palate comes with several disadvantages, which include the need for a second surgical site, post-o-perative pain, limited graft availability and more time needed for the intervention12,16.
In order to overcome these limitations, alternative graft materials have been introduced. In particular, porcine-derived collagen has shown promising results in the treatment of gingival recession, both in terms of root coverage and keratinised tissue gain17. Furthermore, Cairo et al. observed, in a randomised controlled trial, that both xenogeneic dermal matrix and con-nective tissue grafts resulted in similar final apico-coronal keratinised tissue amounts14. More recently, a new xenogeneic dermal matrix has been tested in animal models as a sub-e-pithelial graft for the augmentation of keratinised tissue. It showed good biocompatibility and stability in the host tissue, and the same gingival thickness gain as that achieved via autolo-gous grafting18. However, there have not yet been long-term clinical trials assessing its effi-cacy in augmenting keratinised mucosa around implant-supported restorations.
xenogeneic dermal matrix versus autologous connective graft and control treatment (no graft) in augmenting/improving the width of peri-implant keratinised mucosa and facial soft tissue levels.
The null hypothesis was that there would be no differences between groups. Secondary objectives were aesthetic outcomes (pink aesthetic score) and patient satisfaction with ae-sthetics.
MATERIALS AND METHODS
Study population and design
This study was set up as a randomised controlled trial of parallel group design with 3 arms. Patients were recruited from January 2015 to January 2016 in 4 universities/dental practices using similar and standardised procedures (Centre A: University of Pisa, Versilia Hospital, Pisa, Italy; Centre B: University of Brescia, Brescia Italy; Centre C: Dr. Maria Gabriella Grusovin, Gori-zia, Italy; Centre D: Dr. Rossi, Genova, Italy). The plan was to recruit 24 patients per centre (8 for each group).
All patients with a single, submerged, bone level, cylindrical implant (Premium, Sweden & Martina, Due Carrare, Italy) fitted at least 3 months prior and a paucity of buccal soft tissue volume who were able to comprehend and sign an informed consent form were consecuti-vely enrolled in the study.
Exclusion criteria were:
▬History of systemic diseases that would contraindicate oral surgery;
▬Long-term non-steroidal anti-inflammatory drug therapy;
▬Any oral pathology involving the oral mucosa;
▬Any periodontal disease affecting any residual dentition;
▬Treatment with antiresorptive drugs;
▬History of radiotherapy to the head/neck area;
▬Unwillingness to return for follow-up examination.
All patients received thorough explanation of the study and had to complete a written infor-med consent form prior to being enrolled in the study. The results of the trial are reported in line with the CONSORT statement for improving the quality of reports on parallel-group ran-domised trials (http://www.consort-statement.org/).
The patients enrolled in the trial were treated by a single clinician at their respective centres (Centre A: Prof. Barone; Centre B: Prof. Mensi; Centre C: Dr. Grusovin; Centre D: Dr. Rossi). The-se discusThe-sed the inclusion and exclusion criteria, surgical procedures, outcome measures and how to measure the clinical parameters until consensus was reached at two meetings held at Versilia Hospital. All patients included in the trial were carefully assessed by examining diagnostic casts and periapical/panoramic radiographs, and data on age, gender, smoking habits and location of implant (maxillae/mandible, anterior/posterior) were collected for each patient. All patients had at least one oral hygiene session prior to abutment connection procedures in order to provide an oral environment more conducive to wound healing.
Randomisation
Using a computerised random allocation process, single implants (i.e. patients) were assi-gned to one of three groups: X (xenogeneic dermal matrix, Derma®), A (autologous connective tissue graft) or C (control group, no graft). An open randomisation list was sent to each cen-tre, and the clinician in charge of surgical treatment had to assign the sequential randomisa-tion code to consecutively enrolled patients. Random allocarandomisa-tion was not concealed.
Surgical procedures
An x-ray and silicon impression were taken before surgery. All patients received prophylactic antibiotic therapy (2 g amoxicillin, or 600 mg clindamycin if allergic to penicillin) one hour before the soft tissue augmentation procedure. All patients rinsed for one minute with 0.2% chlorhexidine mouthwash immediately prior to surgery (and twice a day for the following 3 weeks with 0.12% chlorhexidine) and were treated under local anaesthesia using articaine with epinephrine 1:80,000. All surgeries were performed using the same technique by the expert clinicians, as established in the planning meetings (FIGS. 1 A, B).
The recipient site was prepared with a crestal incision to allow access to the implant’s surgi-cal screw. Subsequently, the experimental site was prepared by creating a split-thickness flap on the buccal side. The partial-thickness flap was separated by sharp dissection in order to prepare a periosteal bed and to eliminate muscle insertion, if present.
Patients enrolled in the study were assigned to the following treatment arms, according to the randomisation list provided to each single centre:
a) X: xenogeneic dermal matrix (Derma, Osteobiol, Tecnoss, Coazze, Torino, Italy), 2-mm thick-ness, shaped to adapt to the implant site (FIGS. 2 A, B);
FIGS. 1 A, B: Preoperative image, before implant uncovering stage, showing edentulous ridge with mandibular right first molar missing and reduced keratinised tissue in xenogeneic dermal matrix group (X).
FIGS. 2 A, B: The recipient site was prepared with a crestal incision and split-thickness flap on the buccal side. Healing abutment positioned and xenogeneic dermal matrix placed on the buccal aspect of the implant, held in place with resorbable sling sutures in xenogeneic dermal matrix group (X).
1A
2A
1B
b) A: autologous sub-epithelial connective tissue graft, of a size established according to the receiving site and thickness of about 2 mm, harvested from the palate;
c) C (control): the soft tissues were displaced buccally and stabilised with the healing abut-ment but no graft.
The autologous and the xenograft connective grafts were adapted to the receiving sites and stabilised to the periosteum with a horizontal suture. The healing abutment was placed, and soft tissues were sutured to the lingual/palatal flap with 5-0/4-0 resorbable sutures.
Post-surgical instructions and prosthetic treatments
Patients were instructed to continue with antibiotic therapy, amoxicillin and clavulanic acid 1 g twice a day for 5 days, and naproxen sodium 550 mg tablets were prescribed as an anti-in-flammatory, to be taken 2 times a day as long as required. Patients were instructed to avoid brushing the treated area and to use mouthwash (0.12% chlorhexidine). Any removable pro-sthesis was not to be worn until it had been adjusted and refitted (no sooner than 3 weeks after surgery). Sutures were removed 7-10 days after surgery, and teeth were professionally cleaned using a mild prophylaxis paste.
After 6 weeks of healing, the restorative procedures were performed: implants were manual-ly tested for stability, impressions were taken using pomanual-lyvinyl siloxane impression material and customised resin impression trays. Final prosthetic restorations were screw-retained or cemented, peri-apical x-rays and impressions were taken, and patients were enrolled in an oral hygiene programme with recall visit every 3 months (FIGS. 3, 4).
Outcome measures
One independent calibrated and blinded outcome assessor at each centre made all measu-rements. The following clinical parameters were recorded for all participants at baseline (T0, immediately before surgical procedures), T1 (6 weeks after soft tissue augmentation) and T2 (6 months after soft tissue augmentation).
The primary endpoint was achievement of adequate peri-implant mucosa. This was evaluated using the following parameters.
▬Keratinised tissue width(KMW): measured in millimetres mid-facially from the top of the edentulous crest to the mucogingival junction, before the second stage surgery (T0, ba-seline), at the time of implant impression (T1) and from the gingival margin to the muco-gingival junction at the delivery of the final restoration (T2).
▬Facial soft tissue level (FST): evaluated measuring the distance in millimetres between the mid-facial soft tissue level and a reference line connecting the facial soft tissue level of the adjacent teeth (negative values for apical measures, positive values for coronal measures). The measurements were taken before the soft tissue augmentation (T0, ba-seline), and 6 weeks (T1) and 6 months after the soft tissue augmentation (T2).
The secondary endpoints were implant survival, biological complications, radiographic and aesthetic outcomes, assessed as follows.
▬Prosthesis and implant failures: implant mobility, removal of stable implants due to pro-gressive marginal bone loss or infection, and implant fracture or any other mechanical complications rendering the implant unusable. Prosthesis failure was considered as pro-sthesis loss secondary to implant failure or a propro-sthesis that had to be remade.
▬Biological complications: healing and biological complications at the implant sites throu-ghout the course of follow-up.
FIG. 3: Soft tissue healing at 6-month follow-up in xenogeneic dermal matrix group (X).
FIG. 4: X-ray at 6-month follow-up in xenogeneic dermal matrix group (X).
▬Interdental papilla (IP): evaluated according to the index proposed by Jemt19: 0 = no papil-la; 1 = less than one half of papilla height is present; 2 = greater than half of the papilla height is present, but not to the full extent of the contact point; 3 = papilla fills the entire proximal space and is in good harmony; 4 = papilla is hyperplastic. Measurements were taken at final restoration fitting (T2).
▬Marginal bone level(MBL): evaluated on intra-oral radiographs at the mesial and distal sites (mMBL and dMBL) as the distance between most apical point of the marginal bone level and a reference point at the implant-abutment interface. Digital intra-oral periapi-cal radiographs (70 KVp, 7 mA) were taken with digital sensor using a cone paralleling technique just before the second stage of surgery (T0), 6 weeks (T1) after soft tissue augmentation, and at final crown fitting (T2). A paralleling device and individualised bite blocks made of polyvinyl siloxane impression material (Flexitime, Heraeus/Kulzer, Hanau, Germany) were used to standardise the x-ray geometry.
▬Aesthetic evaluation by the operator: assessments were performed using the pink esthe-tic score20 at crown fitting (T2). The PES is based on seven variables: mesial papilla, distal papilla, soft-tissue level, soft-tissue contour, alveolar process deficiency, and soft-tissue colour and texture. Each variable was assessed on a 2-1-0 scale, with 2 being optimal and 0 being poor. Papilla values were evaluated for completeness, incompleteness or absen-ce. Other variables were assessed by comparison with a reference tooth. The highest possible score reflecting a perfect match of the peri-implant soft tissue with that of the reference tooth was 14.
▬Patient’s aesthetic assessment: at the final restoration fitting (T2), patients provided a subjective assessment of the entire implant treatment by filling in a questionnaire, after thorough information and instruction. Patients expressed their degree of satisfaction regarding the entire implant treatment (Question 1: “What is your level of satisfaction regarding the implant treatment overall?”); the appearance of the peri-implant soft tis-sues (Question 2: “What is your level of satisfaction regarding the appearance of the soft tissue around your implant?”); and the appearance of the implant crown (Question 3: “What is your level of satisfaction regarding the appearance of the crown on your im-plant?”) on a 10-cm visual analogue scale (VAS) on which 0 indicated extreme dissati-sfaction and 10 complete satidissati-sfaction. Respondents’ VAS scores were measured to the nearest mm on a ruler21.
Statistical analyses
The sample size, a two-sided significance level of 0.05, a power of 90% and an expected standard deviation of 0.9 mm were established based on a previous study by Sanz et al. 2009 considering the increase in width of the KM as the main outcome variable22. The analysis was performed post-hoc due to the preliminary nature of these results, which are part of a lar-ger study with a lonlar-ger follow-up. The effect size (d) considered was 2 mm, and correction for multi-arm trials was applied. On the basis of these data, the minimum number of patien-ts required to be enrolled was calculated as 24. However, considering the possibility of a certain amount of dropout (40%), the total minimum number of patients was raised to 36. Descriptive statistics are expressed as means ± standard deviation for quantitative variables, and frequencies and percentage (%) for qualitative variables. Multiple linear regression mo-dels were created to estimate differences between groups and the centre-related effect. Fixed effects included the “Centre” and the “Group”, while baseline estimates of the dependent variables were used as covariate when more than one time point was present. For marginal bone level differences, mesial and distal measurements were averaged and the resulting fi-gure used for the inferential analysis.
Tukey’s HSD was used to test all differences between least-squares experimental group me-ans. An ordered differences report was also created. All tests were conducted at the 0.05 level of significance. Between-group differences in implant failures (dichotomous outcomes) were compared using the chi-squared test or Fisher’s exact test (or the Freeman–Halton extension of Fisher’s exact test) depending on the count per cell (small cell sizes with values less than 5).
RESULTS
Two centres (out of four) did not provide data for the 6-month evaluation, and this 6-month report was therefore based on reports from two centres only. Thirty-nine patients were con-sidered eligible for the study; three patients were not enrolled due to the following reasons: 1 patient reported potentially being pregnant; 1 patient was unable to attend the planned fol-low-up schedule; and 1 patient had uncontrolled diabetes. Hence, 36 patients were enrolled (18 for each centre): 12 in the control group (no graft), 12 in the X group (xenograft), and 12 in the A group (autologous connective tissue graft). Three patients from the A group dropped out from the study and did not attend the final follow-up exam.
The mean age of the sample population was 50 years, and there were 20 females and 13 ma-les; groups were balanced in terms of patient characteristics and location of graft sites (TABLE 1). However, there were differences between groups in terms of baseline width of
keratinised mucosa and facial soft tissue level, which were 1.84 ±1.0 and 0.92 (1.4), 2.0±1.2 and 0.07 (0.8) (X), and 3.87±1.1 and 0.8 (1.1) (A) in millimetres, respectively (FIG. 5).
TABLE 1
: PATIENTS AND SITE CHARACTERISTICS AT BASELINE (T0) BY GROUP
Control (n = 12) X (n = 12) A (n = 12)
Patients Age: mean (SD) 53.9 (7.8) 51.1 (8.2) 47.5 (5.2)
Gender: female/male 7/5 9/3 5/7
Smoker/ non-smoker 5/7 5/7 5/7
Sites Maxilla/mandible 3/9 6/6 9/3
Anterior/posterior 4/8 5/7 4/8
Control = no graft group; X = xenogeneic dermal matrix group; A = autologous connective tissue graft group.
FIG. 5: Descriptive analysis of mean width in mm of keratinised mucosa, KMW (on the left), and facial soft tissue level, FST (on the right), for the three groups at baseline (T0, red); 6-week follow-up (T1, green); and 6-month follow-up (T2, blue). Control = no graft group; X = xenogeneic
Two implants failed (A group), respectively at 2 and 12 weeks after the second stage of sur-gery. The survival rate was 78% in Group A, while it was 100% in both the X and C groups (P-value 0.0682). No complications were recorded.
The primary outcomes at the three different time points (T0, T1 and T2) are reported in TABLE 2. At baseline, the mean keratinised mucosa width (KMW) was 1.84 ± 1.0, 2.0 ± 1.2 and 3.87 ± 1.1
mm in Groups C, X and A, respectively, i.e., the A group showed a trend toward greater initial KMW than the other groups, despite the randomised allocation of participants. At T0 the mean facial soft tissue level (FST) was 0.92 ± 1.4, 0.07 ± 0.8 and 0.8 ± 1.1 mm for Groups C, X and A, respectively.
At T2, on the other hand, the mean keratinised tissue width (KMW) was 2.08 ± 1.2, 3.05 ± 1.34 and 4.9 ± 0.8 mm, and facial soft tissue level (FST) 0.05 ± 0.9, 0.40 ± 0.47 and 1.5 ± 1.8 mm, re-spectively, in Groups C, X and A. Descriptive analyses conducted at T0, T1 and T2 are reported in TABLE 2.
The secondary outcome measures at T2 are reported in TABLE 3; the interdental papilla index
(IP) of the mesial and distal papillae was 1.33 ± 1.0, 1.46 ± 0.9, 2.3 ± 0.5 and 1.08 ± 1.1, 1.46 ± 0.7, 2.1 ± 0.4, respectively, for Groups C, X and A.
The changes between T0, T1 and T2 in the primary outcome variable (KMW and FSL) are shown for all participants in TABLE 4. From T0-T2, the mean KMW increased by 0.16 ± 1.01 (P = 0.79),
1.05 ± 0.76 (P = 0.01), and 0.80 ± 1.73mm (P = 0.28) in Groups C, X and A, respectively. In xenograft group, the increase was statistically significant between both T0-T1 and T0-T2. Similarly, the mean facial soft tissue level change between T0-T2 was -0.95 ± 0.85 (P = 0.04), 0.32 ± 0.57 mm (P = 0.15) and 0.35 ± 0.79 (P = 0.30) in Groups C, X and A; therefore, A reached the highest value, but the only significant increase, of 0.34 mm (P = 0.02), was registered in the xenograft group, specifically from T1-T0.
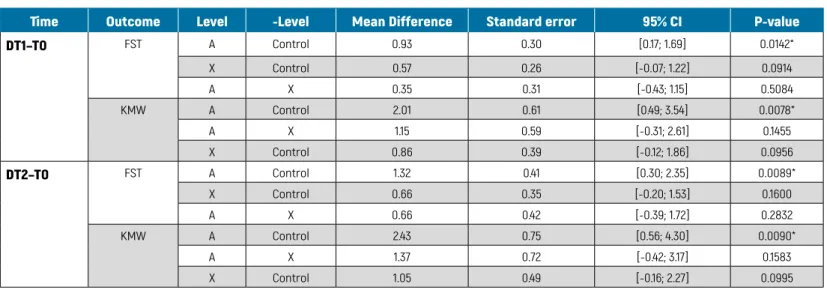
The between-group analysis of primary outcomes for all participants is presented in TABLE 5.
From T0 to T1 and T0-T2, the mean differences in KMW between Groups A and the control group were 2.01 ± 0.61 (P = 0.007) and 2.43 ± 0.75 mm (P = 0.009), respectively, while between Groups A and X they were 1.15 ± 0.59 (P = 0.145) and 1.37 ± 0.72 (P = 0.158). The mean differences in FST levels between Groups A and C were significant for T0-T1 and T0-T2, being 0.93 ± 0.76 (P = 0.01) and 1.32 ± 1.03 mm (P = 0.008), respectively. Other differences between groups were not statistically significant.
TABLE 2
DESCRIPTIVE ANALYSIS OF PRIMARY OUTCOMES
Outcome Control Xenograft Connective tissue graft
N Mean (SD) CI 95% N Mean (SD) CI 95% N Mean (SD) CI 95% KMW T0 12 1.84 (1.0) [1.2; 2.4] 12 2.00 (1.2) [1.2; 2.7] 12 3.87 (1.1) [2.9; 4.8] KMW T1 12 2.00 (1.0) [1.3; 2.6] 12 2.80 (1.2) [2.0; 3.5] 7 4.66 (0.5) [4.1; 5.2] KMW T2 12 2.08 (1.2) [1.2; 2.8] 12 3.05 (1.3) [2.2; 3.8] 7 4.91 (0.8) [4.0; 5.8] FST T0 12 0.92 (1.4) [0.0; 1.8] 12 0.07 (0.8) [-0.4; 0.5] 12 0.80 (1.1) [-0.6; 1.8] FST T1 12 0.59 (1.3) [-0.2; 1.4] 12 0.42 (0.7) [0.0; 0.8] 7 1.61 (1.5) [0.0; 3.2] FST T2 12 0.05 (0.9) [-0.5; 0.6] 12 0.40 (0.4) [0.1; 0.6] 7 1.51 (1.8) [-0.4; 3.4]
N = number of patients; SD = standard deviation; and CI 95% = 95% upper and lower limits of confidence interval; KMW = width of keratinised mucosa at T0 (baseline), T1 (6-week follow-up) and T2 (6-month follow-up); FST = facial soft tissue level at T0, T1 and T2.
TABLE 3
DESCRIPTIVE ANALYSIS OF SECONDARY OUTCOMES AT T2 (6 MONTHS AFTER GRAFT SURGERY)
Outcome Control Xenograft Connective tissue graft
N Mean (SD) CI 95% N Mean (SD) CI 95% N Mean (SD) CI 95% mIP 12 1.33 (1.0) [0.6; 2.0] 12 1.46 (0.9) [0.8; 2.0] 7 2.30 (0.5) [1.7; 2.8] dIP 12 1.08 (1.1) [0.3; 1.8] 12 1.46 (0.7) [0.9; 1.9] 7 2.10 (0.4) [1.7; 2.5] Question 1 12 92.08 (8.3) [86.7; 97.4] 12 92.53 (8.6) [87.2; 97.2] 7 97.51 (4.1) [93.1; 101] Question 2 12 92.08 (8.3) [86.7; 97.4] 12 92.91 (7.0) [88.6; 97.1] 7 94.10 (4.9) [89; 99.3] Question 3 12 92.50 (8.6) [86.9; 98.0] 12 96.01 (7.6) [91.4; 100] 7 100 (0) [100; 100] PES: mPapilla 12 1.41 (0.6) [1.0; 1.8] 12 1.08 (0.5) [0.8; 1.4] 7 1.57 (0.5) [1.1; 2.1] PES: dPapilla 12 1.25 (0.7) [0.8; 1.7] 12 0.92 (0.5) [0.6; 1.2] 7 1.57 (0.5) [1.1; 2.1] PES: Curvature F. 12 1.50 (0.9) [0.9; 2.1] 12 1.42 (0.5) [1.1; 1.7] 7 1.71 (0.5) [1.3; 2.2] PES: Level P. 12 1.42 (0.7) [1.0; 1.8] 12 1.50 (0.5) [1.2; 1.8] 7 1.57 (0.5) [1.1; 2.1] PES: Alveolar P. 12 1.00 (0.7) [0.5; 1.5] 12 1.33 (0.5) [1; 1.6] 7 1.43 (0.5) [0.9; 1.9]
PES: Soft tissue C. 12 1.50 (0.5) [1.2; 1.8] 12 1.92 (0.3) [1.7; 2.1] 7 2.01 (0) [2.0; 2.0]
PES: Soft tissue T. 12 1.58 (0.5) [1.3; 1.9] 12 1.67 (0.5) [1.4; 2.0] 7 1.71 (0.5) [1.3; 2.2]
Tot. PES (max 14) 12 9.67 (3.3) [7.6; 11.8] 12 9.83 (1.5) [8.9; 10.8] 7 11.57 (1.5) [10.2; 13.0]
mMBL 12 1.83 (0.8) [1.3; 2.3] 12 1.29 (0.7) [0.8; 1.7] 7 0.75 (0.8) [-0.1; 1.6]
dMBL 12 1.66 (0.8) [1.1; 2.2] 12 1.22 (0.7) [0.7; 1.6] 7 0.96 (0.7) [0.1; 1.7]
Tot MBL 12 1.74 (0.8) [1.1; 2.3] 12 1.25 (0.7) [0.7;1.7] 7 0.85 (0.8) [-0.1; 1.7]
N = number of patients; SD = standard deviation; CI 95% = 95% upper and lower limits of confidence interval; mIP and dIP = mesial and distal interdental papilla indices; Questions 1–3 = patient’s aesthetic assessment; PES = pink aesthetic scores for mesial papilla, distal papilla, curvature of the facial mucosa, level of the facial peri-implant mucosa, alveolar process deficiency, soft tissue colour, soft tissue texture at the facial aspect of the implant site; mMBL and dMBL = mesial and distal marginal bone levels.
The between-group analyses of secondary outcomes are shown in TABLE 6, radiographic
measures, and TABLE 7, aesthetic outcomes. As regards the aesthetics evaluation by the
operator, at T2 there were no significant differences in pink esthetic score (PES) between the three groups: between A and C the difference was 1.93 ± 2.45 (P = 0.14), between A and X it was 1.16 ± 2.50 (P = 0.49), and between X and C it was 0.77 ± 2.16 (P = 0.65). The only significant dif-ference in interdental papilla index was between Groups A and C at T2, when it was 1.07 and 1.15 respectively for mIP and dIP (P = 0.04; P = 0.01).
As far as patients’ mean aesthetic satisfaction is concerned, this was high at T2 for all three groups, at 92.2 ± 8.4 (C), 93.8 ± 7.7 (X) and 97.2 ± 3.0 (A). There were no statistically significant differences between the three groups in terms of aesthetic outcomes.
For each between-groups analysis, the influence of the centre (Clinic A and Clinic B) was also calculated: for primary outcomes only the T0-T2 FST was significant, at 0.67 ± 0.62 mm (P = 0.0348). Considering the secondary outcomes, the difference in PES was statistically different, at 2.81 ± 1.33 (P = 0.0002) (Centre A = 5.61; Centre B = 8.42), while the mean difference in patient satisfaction with aesthetics, 9.10 ± 4.88 (P = 0.0007), was in favour of Centre B: for Question 1 (Centre A = 89.5; Centre B = 98.69); Question 2 4.84 ± 5.24 P = 0.06 (Centre A = 90.6; Centre B = 95.5); and Question 3 6.73 ± 4.87 P = 0.0095 (Centre A = 92.8; Centre B = 99.6), respectively.
TABLE 4
WITHIN-GROUP CHANGES IN PRIMARY CLINICAL OUTCOMES
Outcome Group Time Mean difference Standard error 95% CI P-value
DFST Control T1–T0 -0.40 0.23 [-0.91; 0.09] 0.1041 T2–T0 -0.95 0.42 [-1.8; -0.02] 0.0455* T2–T1 -0.54 0.32 [-1.25; 0.16] 0.1212 X T1–T0 0.34 0.13 [0.05; 0.63] 0.0218* T2–T0 0.32 0.21 [-0.13; 0.78] 0.1527 T2–T1 -0.02 0.19 [-0.45; 0.40] 0.9089 A T1–T0 0.50 0.22 [-0.07; 1.07] 0.0756 T2–T0 0.35 0.30 [-0.44; 1.14] 0.3095 T2–T1 -0.15 0.27 [-0.85; 0.55] 0.6094 DKMW Control T1–T0 0.08 0.31 [-0.60; 0.77] 0.7949 T2–T0 0.16 0.45 [-0.84; 1.17] 0.7227 T2–T1 0.08 0.33 [-0.65; 0.82] 0.8088 X T1–T0 0.80 0.36 [0.01; 1.60] 0.0470* T2–T0 1.05 0.35 [0.28; 1.81] 0.0111* T2–T1 0.24 0.17 [-0.14; 0.63] 0.1923 A T1–T0 0.50 0.56 [-0.94; 1.94] 0.4150 T2–T0 0.80 0.67 [-0.93; 2.53] 0.2881 T2–T1 0.30 0.19 [-0.19; 0.79] 0.1780
FST = facial soft tissue level; KMW = keratinised tissue width between different time points (T0, baseline; T1, 6-weeks follow-up; T2, 6-month follow-up); Control = no graft group; X = xenogeneic dermal matrix group; A = autologous connective tissue graft group.
Mean differences, standard error, and as CI 95%, 95% upper and lower limits of confidence interval. Statistically significant p-values are marked with an asterisk(*).
TABLE 5
BETWEEN-GROUP DIFFERENCES IN PRIMARY CLINICAL OUTCOMES
Time Outcome Level -Level Mean Difference Standard error 95% CI P-value
DT1–T0 FST A Control 0.93 0.30 [0.17; 1.69] 0.0142* X Control 0.57 0.26 [-0.07; 1.22] 0.0914 A X 0.35 0.31 [-0.43; 1.15] 0.5084 KMW A Control 2.01 0.61 [0.49; 3.54] 0.0078* A X 1.15 0.59 [-0.31; 2.61] 0.1455 X Control 0.86 0.39 [-0.12; 1.86] 0.0956 DT2–T0 FST A Control 1.32 0.41 [0.30; 2.35] 0.0089* X Control 0.66 0.35 [-0.20; 1.53] 0.1600 A X 0.66 0.42 [-0.39; 1.72] 0.2832 KMW A Control 2.43 0.75 [0.56; 4.30] 0.0090* A X 1.37 0.72 [-0.42; 3.17] 0.1583 X Control 1.05 0.49 [-0.16; 2.27] 0.0995
FST = facial soft tissue level; KMW = keratinised tissue width between different time points (T0, baseline; T1, 6-weeks follow-up; T2, 6-month follow-up); Control = no graft group; X = xenogeneic dermal matrix group; A = autologous connective tissue graft group.
TABLE 6
BETWEEN-GROUP DIFFERENCES IN SECONDARY RADIOGRAPHIC OUTCOMES
Time Outcome Level -Level Mean Difference Standard error 95% CI P-value
DT2–T0 MBL X A 0.40 0.15 [0.01; 0.79] 0.0244*
Control A 0.47 0.16 [0.05; 0.89] 0.0430*
X Control 0.07 0.13 [-0.25; 0.40] 0.8485
MBL = mean of mesial and distal marginal bone loss between groups at different time points T0, baseline; T1, 6-weeks follow-up; T2, 6-month follow-up); Control = no graft group; X = xenogeneic dermal matrix group; A = autologous connective tissue graft group.
Mean differences, standard error, and as CI 95%, 95% upper and lower limits of confidence interval. Statistically significant p-values are marked with an asterisk(*).
TABLE 7
BETWEEN-GROUP DIFFERENCES IN SECONDARY AESTHETIC OUTCOMES AT T2 (6 MONTHS AFTER GRAFT SURGERY)
Outcome Level -Level Mean Difference Standard error 95% CI P-value
PES A Control 1.93 0.99 [-0.52; 4.38] 0.1436 A X 1.16 1.01 [-1.33; 3.66] 0.4914 X Control 0.77 0.87 [-1.39; 2.93] 0.6527 mIP A Control 1.07 0.42 [0.00; 2.13] 0.0485* A X 0.77 0.42 [-0.27; 1.82] 0.1813 X Control 0.29 0.34 [-0.56; 1.16] 0.6750 dIP A Control 1.15 0.39 [0.16; 2.14] 0.0195* A X 0.60 0.39 [-0.37; 1.58] 0.2939 X Control 0.55 0.32 [-0.25; 1.35] 0.2211 QA A Control 6.17 3.25 [-1.90; 14.25] 0.1595 A X 3.91 3.22 [-4.07; 11.90] 0.4555 X Control 2.26 2.64 [-4.29; 8.88] 0.6723 QB A Control 2.48 3.50 [-6.19; 11.16] 0.7595 X Control 1.80 2.84 [-5.24; 8.83] 0.8029 A X 0.68 3.46 [-7.89; 9.2] 0.9787 QC A Control 8.06 3.30 [-0.14; 16.26] 0.0549 X Control 4.83 2.68 [-1.82; 11.50] 0.1886 A X 3.22 3.27 [-4.89; 11.33] 0.5927
PES = pink aesthetic score; mIP and dIP = mesial and distal interdental papilla indices, respectivey; Q1–Q3 = questions 1–3 on patients’ aesthetic satisfaction questionnaire; Control = no graft group; X = xenogeneic dermal matrix group; A = autologous connective tissue graft group.
Mean differences, standard error, and as CI 95%, 95% upper and lower limits of confidence interval. Statistically significant p-values are marked with an asterisk(*).
DISCUSSION
The role of keratinised mucosa in maintaining soft tissue health was expressed early, in 1972, by Lang & Loe9. More recently, articles have correlated the presence of keratinised tissue with aesthetic value and soft tissue stability around dental implants23, even though Todisco et al. reported that the height of the keratinised mucosa does not seem to alter clinical outcomes
around implant sites6. That being said, In 2008, a systematic review concluded that although the presence of peri-implant keratinised mucosa does not seem to alter long-term implant survival, it can influence the biological outcome8. Recently, for example, Gobbato et al. highli-ghted the benefits of keratinised tissue in the prevention of plaque accumulation and inflam-mation of peri-implant mucosa24. This has been confirmed by some studies showing that ha-ving less than 2 mm of keratinised tissue is a risk for bleeding on probing, and is more likely to cause discomfort during home oral hygiene10,11.
Hence, our trial was designed to focus on determining the best strategy for improving the width of keratinised peri-implant soft tissues at second-stage implant surgery, whether au-tologous sub-epithelial connective tissue graft or xenogeneic dermal matrix, comparing with no-graft controls.
Our preliminary results revealed no differences between the xenograft and autologous tissue grafting in the width of keratinised mucosa around the implant, but that both yielded signifi-cant increases (1.05 and 0.80 mm), respectively from baseline to six-month follow-up. On the whole, these results are similar to those obtained in a previous RCT on sixty implants by Cairo et al. 201725, who reported increases in keratinised mucosa width of 1.1 and 0.9 mm for xeno-geneic collagen matrix and connective tissue graft groups, respectively.
Similarly, both test procedures in our RCT achieved similar facial soft tissue level increases (vertical), with no significant differences between groups. In particular, the autologous graft resulted in a mean 0.35 mm increase and the xenograft 0.32 mm after 6 months, in compari-son to the no-graft controls, which lost 0.95 mm after implant uncovering. This contrasts somewhat with findings from an RCT by Froum et al. 201526, who also found no statistical dif-ferences between peri-implant vertical soft tissue height, which, however, increased by 0.78 mm after xenogeneic matrix graft and 0.14 mm after no graft.
The importance of vertical soft tissue has been analysed by Puisys & Linkevicius27, who sugge-sted that a good quantity of vertical soft tissue may be significant in preventing bone resorp-tion around implants. This has been contrasted by findings by other authors, who reported that keratinised mucosa at vestibular and lingual sites is associated with an increased mar-ginal bone loss as compared to implants having at least one side without it6. Our RCT found no between-group differences in marginal bone loss, but this could be related to the short follow-up of six months covered by this preliminary report.
Furthermore, we detected no significant difference between groups at T2 in terms of either the Jemt papilla index28 or the pink esthetic score20 methods of papillae analysis. However, the autologous graft group showed better aesthetic outcomes, albeit not statistically so, from both the operator and patients’ perspectives, with VAS analysis by the latter confirming that soft tissue augmentation is related to good patient satisfaction28.
That being said, the aesthetic outcomes and overall satisfaction were very high in all three groups. Indeed, there were no significant differences between groups in this regard or in terms of soft tissue complications at six-month follow-up. This contrasts with findings from a split-mouth study by Wiesner et al., which reported that implant sites grafted with autologous connective tissue achieve significantly better aesthetic scores than the no grafted control group15.
Like in our study, however, other authors have reported patients being highly satisfied with final aesthetic outcomes across the board, with no significant difference between xenograft and autologous graft groups24. Nonetheless, it should be considered that, despite comparable clinical outcomes, autologous grafting involves harvesting tissues from the palate, and comes with the associated disadvantages, such as the need for a second surgical site, post-operati-ve pain18, and more time required for surgical procedures12,24,29.
CONCLUSIONS
The outcomes of the present study reveal that autologous connective tissue grafting can attain significant gains in facial soft tissue height and keratinised mucosa width as com-pared to no-graft controls at six months. Nonetheless, at this early stage, no clinical advan-tages of augmenting the soft tissues versus not doing so were apparent.
As regards limitations, this study was based on a small sample size and a short, albeit preli-minary, follow-up period. However, we plan to conduct longer-term patient follow-up over a period of three years. Other limitations were the absence of allocation concealment and a lack of calibration of the assessors from each centre. Moreover, two out of four centres did not provide any data for the 6-month analysis.
1. Nisapakultorn K, Suphanantachat S, Silkosessak O, Rattanamongkolgul S. Factors affecting soft tissue level around anterior maxillary single-to-oth implants. Clin Oral Impl Res 2010;21:662-70. 2. Bengazi F, Wennström JL, Lekholm U. Recession
of the soft tissue margin at oral implants. Clini-cal Oral Implants Research 1996;7:303-10. 3. Chang M, Wennstrom JL. Peri-implant soft
tis-sue and bone crest alterations at fixed dental prostheses: a 3-year prospective study. Clin Oral Implants Res 2010;21(5):527-34.
4. Belser UC, Grütter L, Vailati F, Bornstein MM, Weber HP, Buser D. Outcome evaluation of early placed maxillary anterior single-tooth implants using objective esthetic criteria: a cross-sectio-nal, retrospective study in 45 patients with a 2-to 4-year follow-up using pink and white esthetic scores. J Periodontol 2009;80:140-51. 5. Jung RE, Sailer I, Hämmerle CH, Attin T. In vitro
color changes of soft tissues caused by resto-rative materials. Int J Periodontics Restoresto-rative Dent 2007;27(3):251-7.
6. Linkevicius T, Apse P, Grybauskas S, Puisys A. The influence of soft tissue thickness on cre-stal bone changes around implants: a 1-year prospective controlled clinical trial. Int J Oral Maxillofac Implants 2009;24(4):712-9.
7. Todisco M, Buti J, Sbricoli L, Esposito M. On the role of keratinised mucosa at dental implants:
a 5-year prospective single-cohort study. Int J Oral Implantol (New Malden) 2019;12(1):13-22. 8. Grusovin MG, Coulthard P, Worthington HV,
Esposito M. Maintaining and recovering soft tissue health around dental implants: a Co-chrane systematic review of randomised con-trolled clinical trials. European Journal of Oral Implantology 2008;1:11-22.
9. Lang NP, Loe H. The relationship between the width of keratinized gingiva and gingival health. J Periodontol 1972;43:623-7.
10. Roccuzzo M, Grasso G, Dalmasso P. Keratinized mucosa around implants in partially edentu-lous posterior mandible: 10-year results of a prospective comparative study. Clin Oral Impl Res 2016;27:491-6.
11. Souza AB, Tormena M, Matarazzo F, Araújo MG. The influence of peri-implant keratinized mu-cosa on brushing discomfort and peri-implant tissue health. Clin Oral Impl Res 2016;27:650-5. 12. Bassetti RG, Stähli A, Bassetti MA, Sculean A.
Soft tissue augmentation procedures at se-cond-stage surgery: a systematic review. Clin Oral Investig 2016;20:1369-87.
13. Esposito M, Maghaireh H, Grusovin MG, Ziounas I, Worthington HV. Interventions for replacing missing teeth: management of soft tissues for dental implants. Cochrane Database of Syste-matic Reviews 2012;2:CD006697.
14. Cairo F, Pagliaro U, Nieri M. Treatment of gingi-val recession with coronally advanced flap pro-cedures: a systematic review. J Clin Periodontol 2008;35(Suppl 8):136-62.
15. Wiesner G, Esposito M, Worthington H, Schlee M. Connective tissue grafts for thickening peri-implant tissues at implant placement. One-year results from an explanatory split-mouth randomised controlled clinical trial. Eur J Oral Implantol 2010;3(1):27-35.
16. Zucchelli G, Mele M, Stefanini M, Mazzotti C, Marzadori M, Montebugnoli L, De Sanctis M. Patient morbidity and root coverage outcome after subepithelial connective tissue and de-e-pithelialized grafts: a comparative randomi-zed-controlled clinical trial. Journal of Clinical Periodontology 2010;37:728-38.
17. Cardaropoli D, Tamagnone L, Roffredo A, Gave-glio L. Treatment of gingival recession defects using coronally advanced flap with a porcine collagen matrix compared to coronally advan-ced flap with connective tissue graft: a ran-domized controlled clinical trial. J Periodontol 2012;83(3):321-8.
18. Fickl S, Nannmark U, Schlagenhauf U, Hurzeler MB, Kebschull M. Porcine dermal matrix in the treatment of dehiscence-type defects - An experimental split-mouth animal trial. Clin Oral Impl Res 2015;26:799-805.
19. Jemt T. Regeneration of gingival papillae after single-implant treatment. Int J Periodontics Re-storative Dent 1997;17(4):326-33.
20. Furhauser R, Florescu D, Benesch T, Haas R, Mailath G, Watzek G. Evaluation of soft tissue around single-tooth implant crowns: the pink esthetic score. Clin Oral Impl Res 2005;16:639-44.
21. Hartlev J, Kohberg P, Ahlmann S, Ander-sen NT, Schou S, Isidor F. Patient satisfaction and esthetic outcome after immediate pla-cement and provisionalization of single-to-oth implants involving a definitive individual abutment. Clin Oral Impl Res 2014;25:1245-50.
22. Sanz M, Lorenzo R, Aranda J, Martin C, Orsini M. Clinical evaluation of a new collagen matrix (mucograft prototype) to enhance the kerati-nised tissue width in patients with fixed pro-sthetic restorations: a randomized prospective clinical trial. Journal of Clinical Periodontology 2009;36: 868-76.
23. Tonetti MS, Jepsen S, Working Group 2 of the European Workshop on Periodontology. Clinical efficacy of periodontal plastic surgery proce-dures: Consensus report of Group 2 of the 10th European Workshop on Periodontology. Journal of Clinical Periodontology 2014;41:36-43. 24. Gobbato L, Avila-Ortiz G, Sohrabi K, Wang CW,
Karimbux N. The effect of keratinized mucosa width on peri-implant health: a systematic re-view. International Journal of Oral Maxillofacial Implants 2013;28(6):1536-45.
25. Cairo F, Barbato L, Tonelli P, Batalocco G, Pa-gavino G, Nieri M. Xenogeneic collagen matrix versus connective tissue graft for buccal soft tissue augmentation at implant site. A rando-mized, controlled clinical trial. J Clin Periodontol 2017;44:769-76.
26. Froum SJ, Khouly I, Tarnow DP, Froum S, Rosen-berg E, Corby P, Kye W, Elian N, Schoor R, Cho SC. The use of a xenogeneic collagen matrix at the time of implant placement to increase the volume of buccal soft tissue.
Internatio-nal JourInternatio-nal Periodontics Restorative Dentistry 2015;35(2):179-89.
27. Puisys A, Linkevicius T. The influence of muco-sal tissue thickening on crestal bone stability around bone-level implants. A prospective controlled clinical trial. Clinical Oral Implants Research 2015;26(2):123-9.
28. Cairo F, Cortellini P, Pilloni A, Nieri M, Cincinelli S, Amunni F, Tonetti MS. Clinical efficacy of coro-nally advanced flap with or without connective tissue graft for the treatment of multiple adja-cent gingival recessions in the aesthetic area: a randomized controlled clinical trial. Journal of Clinical Periodontology 2016;43(10):849-56. 29. Cortellini P, Tonetti M, Baldi C, Francetti L,
Ra-sperini G, Rotundo R, Pini-Prato GP. Does pla-cement of a connective tissue graft improve the outcomes of coronally advanced flap for coverage of single gingival recessions in upper anterior teeth? A multi-centre, randomized, double-blind, clinical trial. Journal of Clinical Periodontology 2009;36:68-79.