Sigla di identificazione Distrib. Pago
~
Ricerca Sistema Elettrico XCIRTEN- LP3 -005 LTitolo
Simulation activity in support of LlFUS 5 new test section's design and test conditions setup
Descrittori
Tipologia del documento: Rapporto tecnico
1
Collocazione contrattuale: Accordo di programma ENEA-MSE: tema di ricerca "Nuovo nucleare da fissione"
Argomenti trattati: Generation IV Reactor Reattori nucleari veloci Tecnologia dei metalli liquidi Termoidraulica
Sommario
di 27
This work represents a contribution to the design of a new test section for the LlFUS 5 facility and far the definition of possible experimental test conditions. The new test section is required to study the thermal hydraulic phenomena that are at the base of HLM-water interaction in an axial-symmetric geometrical configuration . The SIMMER III code has been chosen as the reference code to perform these simulations because it has been specifically developed to perform reactor safety analysis of core disruptive accidents for liquid metal cooled reactors with fast neutron spectrum. The new experimental campaign can therefore be finalized to qualify the SIMMER III code for such phenomena.
Two series of simulations were performed for the present work: the first was carried out by injecting water at the reference pressure of 40 bar (Iow pressure cases), while the second was performed with water at the reference pressure of 180 bar (high pressure cases). The effects of the variation of five different parameters are considered in detail for both the series: the cover-gas volume fraction in the reaction vessel, the orifice diameter, the inlet water temperature, the inlet water pressure and the LBE initial temperature.
The main results show that, especially far the cases run with high water pressure and with a large orifice diameter, a backflow can be observed in the pipeline that connects the water tank with the LBE tank; this backflow allows the possibility of LBE solidification inside the pipe. In addition, the calculated water injection mass flow rate gives an indication of the operating range of the sensor needed to measure this value correctly during experimental tests.
Note Il presente documento recepisce il doc. CIRTEN CERSE-UI\JIPI RL 1075/2010
Copia n. In carico a:
2 NOME
FIRMA
1 NOME
FIRMA
NOME NA ~tqfa9( Mqnti
2i/09/2010 NA
CIRTEN
CONSORZIO INTERUNIVERSITARIO PER LA RICERCA TECNOLOGICA NUCLEARE
UNIVERSITA’DIPISA
DIPARTIMENTODIINGEGNERIAMECCANICA,NUCLEAREEDELLA
PRODUZIONE
Simulation activity in support
of LIFUS 5 new test section's design
and test conditions setup
CIRTEN-UNIPI RL 1075/2010
AUTORI
ABSTRACT
This work represents a contribution to the design of a new test section for the LIFUS 5 facility and for the definition of possible experimental test conditions.
The new test section is required to study the thermal-hydraulic phenomena that are at the base of HLM-water interaction in an axial-symmetric geometrical configuration. The interaction between hot pressurised water and heavy liquid metals represents an important issue because it influences the safety, design and maintenance of LMFRs with a steam generator integrated in the main reactor vessel.
The SIMMER III code has been chosen as the reference code to perform these simulations because it has been specifically developed to perform reactor safety analysis of core disruptive accidents for liquid metal cooled reactors with fast neutron spectrum. The new experimental campaign can therefore be finalized to qualify the SIMMER III code for such phenomena.
Two series of simulations were performed for the present work: the first was carried out by injecting water at the reference pressure of 40 bar (low pressure cases), while the second was performed with water at the reference pressure of 180 bar (high pressure cases). The effects of the variation of five different parameters are considered in detail for both the series: the cover-gas volume fraction in the reaction vessel, the orifice diameter, the inlet water temperature, the inlet water pressure and the LBE initial temperature.
The main results show that, especially for the cases run with high water pressure and with a large orifice diameter, a backflow can be observed in the pipeline that connects the water tank with the LBE tank; this backflow allows the possibility of LBE solidification inside the pipe. In addition, the calculated water injection mass flow rate gives an indication of the operating range of the sensor needed to measure this value correctly during experimental tests.
INDEX
Abstract ... 2
1. Suggested improvements for the LIFUS 5 facility ... 4
2. Numerical simulations ... 7
2.1. SIMMER III model ... 7
2.2. Matrixes of the performed simulations ... 9
3. Obtained results... 11
3.1 Test A: cover-gas volume fraction... 11
3.2 Test B: orifice diameter... 17
3.3 Test C: inlet water temperature ... 20
3.4 Test D: inlet water pressure... 22
3.5 Test E: LBE temperature... 23
4. Conclusions ... 25
1. Suggested improvements for the LIFUS 5 facility
The current configuration of LIFUS 5 facility (shown in Fig. 1), used for “ELSY” and “DEMETRA” experimental tests [1-3], is characterized by geometrical features which originate evident asymmetries.
In order to reduce the uncertainties in the numerical simulation and to improve the qualification of the SIMMER III code [4-5], all the causes of asymmetry, like U-shaped tubes, expansion volume and the not axial-symmetry of the water injection device, present in the LIFUS 5 facility must be removed. In particular, U-shaped tubes should be removed and the water injection pipe should be placed along the axis of the S1 tank. Another cause of asymmetry is due to the plates which divide the vessel volume in four connected sub-volumes, already removed from the reaction vessel S1 during the second DEMETRA test.
Furthermore, the S3 vessel, currently directly connected to the S1 vessel by a 3'' pipe, should be removed preventing LBE and water passage from S1 to S3.
Another change on the facility configuration should be the reduction of the length of the ½'' pipe that connects the water tank S2 with the reaction vessel S1, in order to limit the pressure losses along this pipe.
Moreover, it is also advisable and recommended to improve the existing instrumentation. In particular, the measure of the mass flow rate of the water injected in the S1 vessel during the tests must be improved by the use of an un-intrusive sensor (e.g. an ultrasonic flow meter). In addition to this technique, an accurate measure of the water level in the S2 tank during the tests (e.g. using a differential pressure transducer) can give additional data that can be used to check the injected water flow rate.
A better disposition of the thermocouples inside the LBE pool will allow an accurate description of the LBE-water interaction phenomenon. From the analysis of the previous experimental tests (see e.g. Ref. [2]) a significant reduction of the LBE temperature in the region is evident where the LBE-water interaction occurs: a thin grid of steel can be used to support a set of thermocouples in the S1 vessel, in order to detect a better temperature distribution in it.
Two possible thermocouple dispositions are proposed in this work, as shown in Fig. 2. In the first configuration (see Fig. 2.a) the thermocouples are disposed in a radial and axial uniform manner, while in the second case (see Fig. 2.b) the thermocouples are radially refined near the axis of the vessel and of the injector device. Four levels of thirteen TCs are foreseen to monitor the LBE temperature in the S1 vessel. The set of TCs near the injector must be arranged in such a way as to allow different penetrations of the injection pipe itself inside the S1 vessel, in order to compare the effect of different pipe lengths on the LBE-water interaction.
Pressure is a particularly important parameter which can help us to understand what happens in the reaction vessel S1 during LBE-water interaction. By the analysis of the pressure trends as a function of time it can be observed how the pressure waves propagate themselves into the LBE in the first part of the interaction, and how water vapor, LBE and cover gas interact with each other during the transient. So, a correct displacement of pressure transducers must be provided both in vessel S1 and in the injection pipe. Concerning the injection pipe, one sensor is sufficient to measure the pressure and to investigate the physical phenomena which arise when the injector cap device breaks and when consequently the water starts to interact with the LBE. Although the disposition of pressure sensors used during the previous tests for the S1 vessel is accurate enough, an improvement in measurement accuracy can be reached increasing the number of transducers in order to obtain an axial-symmetric arrangement.
Concerning the water tank S2, it is important to measure the pressure trend as a function of time in the argon region, located, in the upper part of the vessel volume.
a) radially uniform TCs b) radially refined TCs Figure 2. Possible dispositions of the thermocouples for the new test section.
2. Numerical simulations
2.1. SIMMER III model
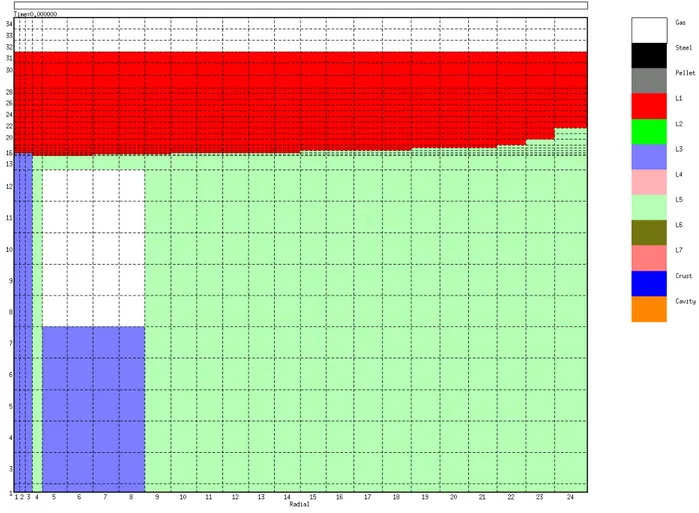
The 2D axial-symmetric domain, shown in Fig. 3, has been developed to model the new LIFUS 5 test section by the SIMMER III code.
The domain is composed of two main volumes, one for the LBE’s vessel S1 and the other for the water vessel S2. The two volumes are connected by an injection pipe which ends with an injector. Because of the cylindrical coordinates used in the code, the S2 vessel is modelled by an annular region having the same volume and height of the real vessel.
Figure 3. Computational domain for the new LIFUS 5 configuration.
Since the computational model adopted does not directly calculate pressure losses in the pipes, it was necessary to introduce adequate orifice coefficients to account the water pressure drop which takes place between S2 and S1 vessels:
2
orf
p C ρw
∆ = (1)
In the present model the orifice coefficients (Corf) are placed in two different positions: one on
the orifice cross section and the other in the three cells of the collector tube placed just upstream the orifice itself, respectively. The first coefficient is set equal to 0.7, while the second is set on a value of 1.0.
The locations where the values of pressure, temperature and mass flow rate are calculated are reported in Tab.1 and shown in Fig.4
X-cell Y-cell P1 and T1 4 19 P2 and T2 4 28 P3 and T3 4 34 P4 and T4 24 24 P5 and T5 24 32 P6 and T6 1 4
Water Mass Flow rate 1 – 2 – 3 10
Table 1. Location of the monitoring cells.
Figure 4. Domain with the indication of the monitoring cell positions for temperature (green), pressure (green) and mass flow rate (cyan).
2.2. Matrix of the performed simulations
The main goal of the performed analysis is to support and verify the choice of the experimental test conditions setup which will be adopted for the future experimental campaign, focusing the attention on the possible problems that may occur during the measurements, like excessive pressure values or backflow of LBE to the injection pipe. Two different matrices of simulations were considered: the first for high water pressure measurements (reference value of 180 bar), based on ELSY test parameters (see Tab. 2), and the second for low water pressure measurements (reference value of 40 bar), based on DEMETRA test parameters (see Tab. 3). For each matrix of simulations the effect of change of the following five parameters were analyzed:
1) Test A: cover-gas volume fraction; 2) Test B: orifice diameter;
3) Test C: inlet water temperature; 4) Test D: inlet water pressure; 5) Test E: LBE temperature.
Each matrix of simulations contains one “reference case” and five series of tests in which a physical parameter was changed as mentioned above. The LBE temperature chosen for the reference case is T = 400 °C for high pressure simulations and T = 350 °C for low pressure ones. For all the performed simulations the duration of the analysed transient is t = 3 s.
Simulation Inlet water pressure [bar] Inlet water temperature [°C] Cover-gas volume fraction [%] Orifice diameter [mm] LBE Temperature [°C] Reference 180 300 30 4 400 A1 180 300 20 4 400 A2 180 300 40 4 400 B1 180 300 30 8 400 B2 180 300 30 13 400 C1 180 270 30 4 400 C2 180 250 30 4 400 D1 150 300 30 4 400 D2 120 300 30 4 400 E1 180 300 30 4 350 E2 180 300 30 4 450
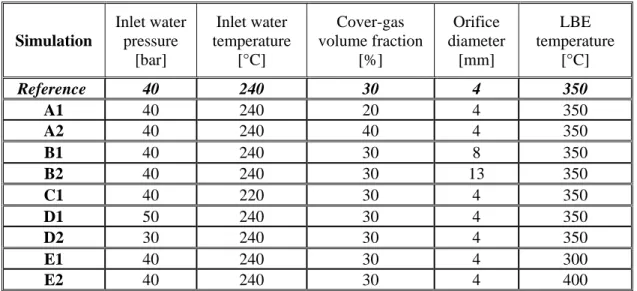
Simulation Inlet water pressure [bar] Inlet water temperature [°C] Cover-gas volume fraction [%] Orifice diameter [mm] LBE temperature [°C] Reference 40 240 30 4 350 A1 40 240 20 4 350 A2 40 240 40 4 350 B1 40 240 30 8 350 B2 40 240 30 13 350 C1 40 220 30 4 350 D1 50 240 30 4 350 D2 30 240 30 4 350 E1 40 240 30 4 300 E2 40 240 30 4 400
3. Obtained results
The main results obtained from the performed simulations are shown in this section, focusing the attention on the effects on the LBE-water interaction of changing each parameter considered, as explained above.
3.1 Test A: cover-gas volume fraction
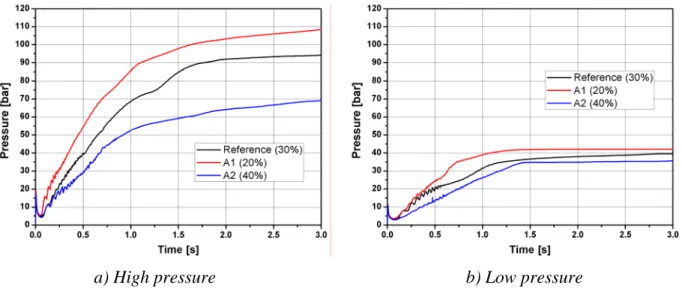
The cover-gas volume fraction is equal to 30% of the total S1 volume for the reference case, while it has been reduced to 20% for the case A1 and it has been increased up to 40% for the simulation A2. The pressure trends as a function of time, evaluated inside the LBE region (cell (4,19)) of the reaction vessel S1, for both the high pressure simulations and the low pressure ones are reported in Fig. 5. It can be noted that during the interaction increasing the cover-gas volume, the pressure values in the S1 vessel decrease. For the high pressure cases the value of the pressure is always under that of the water collected in the S2 tank, while for the low pressure cases, performed with the lowest argon volume, the S1 pressure overcomes pressure in S2.
a) High pressure b) Low pressure
Figure 5. Pressure trends as a function of time in the S1 vessel (cell (4,19), parameter: cover-gas volume fraction).
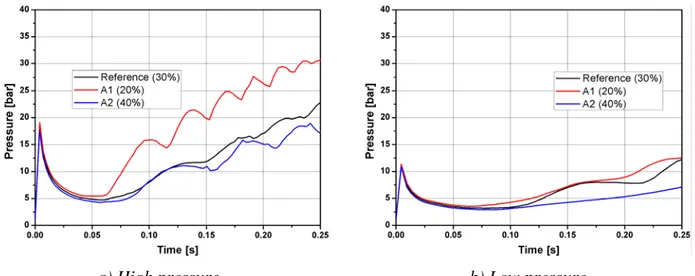
Analyzing the first part of the transient we see that in both low and high pressure simulations, the cover-gas volume fraction does not seem to have a great influence on the initial pressure peak (see Fig. 6); in this first phase the quick increase of the pressure in the LBE region is due to the impact of the water jet with the liquid metal. All the three simulations considered for the high pressure case (180 bar) show a pressure peak of about 18 bar, while the three simulations
water vapour produced during the interaction squeezed the LBE upward in the cover gas region, increasing S1 pressure and reducing the injection pipe’s water flow rate.
a) High pressure b) Low pressure
Figure 6. Pressure trends in the first part of the transient in the S1 vessel (cell (4,19), parameter: cover-gas volume fraction).
The pressure trends detected at three different points of the vessel for both the reference cases are shown in Fig. 7. In particular, the first point is close to the injector (cell (4,19)), the second is in the cover-gas (cell (4,34)) and the third is in the LBE region, near the vessel wall (cell (24,24)). The differences between the three pressure trends can be detected mainly in the first part of the transient, as can be seen from Fig. 7 and from Fig. 8; a good agreement between the trends can be observed at the first and at the second measure point, while fluctuating behaviour is noted in the first part of the transient for the pressure trend calculated for the cover-gas region (second measure point). This behaviour could be due to inertial effects related to LBE movement under action from both vaporized water near the injection region and the cover-gas, pressurized by the reduction of its volume. After about 0.5 s oscillations disappear because water vapour reaches the gas region and starts mixing with it.
It is interesting to observe that the first pressure peak presented in the LBE region, is otherwise absent in the gas region, as reported in Fig. 8. This peak, as previously mentioned, is expected to be a sort of shock wave that propagates itself inside the liquid metal region.
a) High pressure b) Low pressure
Figure 7. Pressure trends at different locations of the S1 vessel (reference case).
a) High pressure b) Low pressure
Figure 8. Pressure trends at different locations of the S1 vessel for the first part of the transient (reference case).
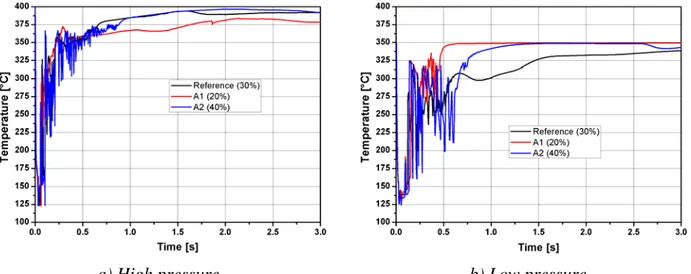
Concerning the temperature trends, the SIMMER code predicts a strong and quick decrease of LBE temperature in the first part of the transient, with a possibility for the Pb-Bi eutectic to reach solidification value (~124 °C), especially for high pressure cases, as reported in Fig. 9.a and in Fig. 9.b. The water, liquid at high pressure, evaporates immediately after injection in the S1 volume, coming into contact with melted LBE, which is at a lower pressure. The evaporation process starts cooling the LBE (see Fig. 10). After the water evaporation, the LBE temperature increases, showing oscillating behaviour and tending to reach its initial value, as reported in
a) High pressure b) Low pressure Figure 9. Temperature trends as a function of time in the S1 vessel
(cell (4,19), parameter: cover-gas volume fraction).
a) High pressure b) Low pressure
Figure 10. Temperature trends in the first part of the transient in the S1 vessel (cell (4,19), parameter: cover-gas volume fraction).
Temperature trends in the region involved by water-LBE interaction can be observed analysing the contour plot of the temperature of LBE in the S1 region of the domain, as shown in Fig. 11 for a time window of 0.01 s after the water injection, for both the reference pressure cases. It can be noted that there is not a great difference between the two cases: in the high pressure case there is a region affected by an interaction slightly more than in the low pressure case. After 0.05 s from the water injection (see Fig. 12) the differences are more evident than in the previous instant. In the high pressure case there is a larger expansion due to bigger S2 pressure which allows the injection of a greater amount of water in the S1 vessel.
After 0.1 s (see Fig. 13) the high pressure case shows the separation of a part of the fluid into a bubble which moves towards the vessel wall. The same behaviour occurs for the low pressure case but with a time delay respect to the high pressure simulation.
At 0.5 s (see Fig. 14) the vapour bubble reached the top of the vessel for the high pressure case, while in the low pressure case it was still at the surface detachment phase. Hence, it can be observed that the physical phenomena for the two configurations are basically the same but the same processes occur at different times for each configuration: this is probably due to the differences in the pressure values of the injected water for the two cases.
a) High pressure b) Low pressure
Figure 11. Contour plots of LBE temperature at 0.01s after the start of injection.
a) High pressure b) Low pressure
a) High pressure b) Low pressure
Figure 13. Contour plot of LBE temperature at 0.1 s after the start of the injection.
a) High pressure b) Low pressure
Figure 14. Contour plot of LBE temperature at 0.5 s after the start of the injection.
The flow rate of the injected water was also analysed. Important differences in the values of the injected mass flow rate between the high and low pressure simulations were detected and are shown in Fig. 15. Moreover, a backflow phenomenon was noted for the low pressure case, which is highly undesirable for the safety of the facility itself and to perform correct test measurements.
a) High pressure b) Low pressure Figure 15. Flow rate trends as a function of time in the S1 vessel (cell (4,19),
parameter: cover-gas volume fraction).
3.2 Test B: orifice diameter
For the reference case the orifice diameter was set equal to d = 4 mm. This diameter is equal to the orifice of the injectors used up to now for all the tests performed on DEMETRA and ELSY EU Projects (see Ref. [1-2]). For the B1 case the diameter was equal to d = 8 mm while for the B2 case the diameter was shifted to d = 13 mm. Obviously, a large orifice allows the passage of more water than a small one and this causes a higher pressurization inside the S1 tank (see Fig. 16). In particular, in low pressure cases (see Fig. 16.a) the pressure trends of the B1 and B2 simulations reach a pressure plateau at a higher value than the pressure of the injected water. This may be related to the large quantity of water injected in the initial part of the transient; the water, vaporizing in contact with molten LBE, can solidify liquid metal in the region close to the injector nozzle and consequently the section of passage can become smaller.
Analyzing the first part of the water injection time window it is possible to see that the orifice diameter also has an effect on the initial pressure peak: the bigger the orifice diameter, the greater the value of the pressure peak, as reported in Fig. 17.
The temperature trends, shown in Fig. 18 and in Fig. 19, are influenced more by this parameter in respect to the cover-gas volume fraction, because of the higher quantity of water injected from the bigger orifice diameter. Anyway, the solidification temperature is reached for a brief time period in the initial phase of water injection.
As expected from the data related to the pressure time trends, shown in Fig. 20, the injected mass flow rate shows a maximum which can reach the value of 8 kg/s in the B2 case characterized by an orifice diameter of 13 mm and a higher S2 pressure. For both B1 and B2 cases, the injected water flow rate changes of sign and then the LBE enters in the injection pipe solidifying inside it and thus blocking the water injection after about 0.5-1.0 s, confirming the considerations made above.
a) High pressure b) Low pressure
Figure 17. Pressure trends in the first part of the transient in the S1 vessel (cell (4-19), parameter: orifice diameter).
a) High pressure b) Low pressure
Figure 18. Temperature trends as a function of temperature in the S1 vessel (cell (4,19), parameter: orifice diameter).
a) High pressure b) Low pressure
Figure 19. Temperature trends in the first part of the transient in the S1 vessel (cell (4,19), parameter: orifice diameter).
3.3 Test C: inlet water temperature
The temperature of the injected water is an another parameter that has an wide influence in LBE-water interaction process. First of all, it must be highlighted that the values of temperature in the two configurations (high and low pressure simulations) are different, because the water saturation temperature changes with the pressure. So, for the reference cases, a temperature of T = 300 °C for the simulation at high pressure and a temperature of T = 240 °C for the low pressure simulation was considered, in agreement with previous tests performed with the LIFUS 5 facility.
For high pressure simulations two different deviations of temperature from the reference value were considered: T = 270 °C for the C1 case and T = 250 °C for the C2 case. On the contrary, for the low pressure simulations only one different temperature value was adopted, set equal to T = 220 °C for the C1 case.
Pressure levels reached in lower temperature cases are less than the reference one, especially for the high pressure series, as plotted in Fig. 21. This is probably related to the fact that low temperature water has a lower internal energy, and needs more energy to vaporize.
Analysing the first part of the transient (see Fig. 22) it can be noted that the temperature of the injected water had a negligible influence on the initial pressure peak. In addition, this parameter also had a negligible effect on the temperature trends of LBE, as shown in Fig. 23.
Concerning the mass flow rates of the injected water, it is observed that there are not relevant differences between the C1 and C2 cases through the whole transient, as reported in Fig. 24: only a small discrepancy between the trends were observed in the last part of the transient for the high pressure case.
a) High pressure b) Low pressure
Figure 21. Pressure trends as a function of time in the S1 vessel (cell (4,19), parameter: inlet water temperature).
a) High pressure b) Low pressure
Figure 22. Pressure trends in the first part of the transient in the S1 vessel (cell (4,19), parameter: inlet water temperature).
a) High pressure b) Low pressure
Figure 23. Temperature trends as a function of time in the S1 vessel (cell (4,19), parameter: inlet water temperature).
3.4 Test D: inlet water pressure
The effect of the variation of the pressure of the injected water was also analysed; in particular, this parameter had a wide influence on the interaction process between water and LBE. For the high pressure series (180 bar) two reductions of pressure value were considered; P = 150 bar and P = 120 bar for the D1 case and the D2 case, respectively. For the low pressure series (40 bar set as reference value), simulations at P = 50 bar and P = 30 bar for the case D1 and D2, respectively, were performed.
The pressure trends over a function of time are reported in Fig. 25. It is noted that S1 pressure is higher for cases performed with high pressure of injected water: consequently the injected water mass flow rate is higher, as is plotted in Fig. 26. For the low pressure simulations, differences in behaviour of the mass flow rate trends are evident for theD2 case, characterized by the lowest pressure, where the backflow phenomenon occurs, as reported in Fig. 26 b).
a) High pressure b) Low pressure
Figure 25. Pressure trends as a function of time in the S1 vessel (cell (4,19), parameter: inlet water pressure).
a) High pressure b) Low pressure Figure 26. Flow rate trends as a function of time in the S1 vessel
(cell (4,19), parameter: inlet water pressure).
3.5 Test E: LBE temperature
The temperature of LBE was the last parameter analysed in this work. For the injections performed at high pressure, a reference temperature of T = 400 °C was set for LBE; two variations of this value were considered, setting T = 350 °C for the E1 case and T = 450 °C for the E2 case. For the low injection pressure series the temperature of LBE was set at T = 350 °C for the reference case, while values of T = 300 °C for the E1 case and T = 400 °C for the E2 case were adopted.
The trends of the pressure as a function of time are reported in Fig. 27; a comparison between the simulated cases evidenced a higher pressure value in the S1 vessel for the case simulated with the higher LBE temperature: this behaviour is particularly clear in the last part of the transient. The high pressure values reached in the cases with higher LBE temperature causes as a consequence a reduction of mass flow rate injected from the nozzle (see Fig. 28). Moreover, it is noted that for the case E2, performed with at the lowest pressure and with the highest LBE temperature, the backflow phenomenon occurs. This is in agreement with what was observed about pressure values inside the S1 tank shown in Fig. 27, which match the pressure value of the injected water and consequently induce the backflow in the pipe.
a) High pressure b) Low pressure Figure 27. Pressure trends as a function of time in the S1 vessel
(cell (4,19), parameter: LBE temperature).
a) High pressure b) Low pressure
Figure 28. Flow rate trends as a function of time in the S1 vessel (cell(4,19), parameter: LBE temperature).
4. Conclusions
The goal of this work was to analyse new possible technical solutions to be adopted on the facility LIFUS 5 and to perform numerical simulations to analyse the interaction of LBE-water. Some suggestions concerning the new configuration of the reaction vessel S1 and water injection device in order to perform tests that may be more useful for the qualification of the SIMMER III code in the analysis and simulation of SGTR accidents for LMFRs were made.
Moreover, the computational simulations performed with SIMMER III code are shown. Attention was focused on the variation of five parameters of interest for the interaction LBE-water from their assigned reference values; the study observed the effects produced by the variation of different test boundary conditions. The main results concerning the simulation activity regards the possibility of a backflow inside the pipeline that links the water tank S2 with the reaction vessel S1. The backflow was observed in particular for the simulations series performed with a low reference pressure value (40 bar), where the pressure inside the S1 vessel was noted to overcome the pressure of injected water from the pipe. This effect becomes more important when increasing the orifice diameter and for high LBE temperature.
This suggests to perform the experimental tests possibly with the lowest orifice diameter available (4 mm) and with high water pressure (180 bar), gradually changing and adjusting these two parameters.
Moreover, the computational simulations made give preliminary information about the mass flow rate of water injected from the nozzle, which did not exceed, in any case, the value of 1.4 kg/s with an orifice diameter of 4 mm.
References
[1] A. Ciampichetti, P. Agostini, G. Benamati, G. Bandini, D. Pellini, N. Forgione, F. Oriolo, “LBE-water interaction in sub-critical reactors: first experimental and modelling results”, Journal of Nuclear Materials, Vol. 376, pp. 418-423, 2008.
[2] A. Ciampichetti, D. Pellini, P. Agostini, G. Benamati, N. Forgione, F. Oriolo, “Experimental and computational investigation of LBE–water interaction in LIFUS 5 facility”, Nuclear Engineering and Design, Vol. 239, pp. 2468-2478, 2009.
[3] D. Bernardi, A. Ciampichetti, N. Forgione, “Test parameters definition for SGTR experiments”, Technical Report – Doc 57, Task 6.3 of ELSY Project, 2010.
[4] K. Morita, A. Rineiski, E. Rineiski, E. Kiefhaber, W. Maschek, M. Flad, G. Rimpault, P. Coste, S. Pigny, S. Kondo, Y. Tobita, S. Fujita, “Mechanistic SIMMER III analyses of severe transient in Accelerator Driver Systems (ADS)”, Proc. 9th International Conference on Nuclear Engineering (ICONE 9), Nice Acropolis (France), April 8-12, 2001.
[5] Y. Tobita, Sa. Kondo, K. Morita, W. Maschek, et al., “The Development of SIMMER-III, An Advanced Computer Program for LMFR Safety Analysis”, Proc. IAEA/NEA Technical Meeting on Use of Computational Fluid Dynamics (CFD) Codes for Safety Analysis Reactors Systems Including Containment, Pisa, Italy, November 11-14, 2002.