Università degli Studi della Calabria
Dottorato di Ricerca in Ingegneria Chimica e dei Materiali
SCUOLA DI DOTTORATO " PITAGORA " IN SCIENZE INGEGNERISTICHE
Tesi
Membrane Distillation in Integrated Seawater
Desalination Systems
Settore Scientifico Disciplinare CHIM07 – Fondamenti chimici delle tecnologie
Supervisori
Candidato
Ch.mo Prof. Enrico DRIOLI
Xiaosheng Ji
Dott.Efrem CURCIO Ciclo XXIII
Il Coordinatore del Corso di Dottorato
Ch.mo Prof. Raffaele MOLINARI
INDEX
Summary
... 5Sommario
... 8 CHAPTER ONE ... 11 Membrane Desalination ... 11 1.1 Desalination ... 11 1.2 Desalination market ... 12 1.3 Desalination technology... 141.4 Membrane technology market ... 15
1.5 Reverse Osmosis ... 16
1.6 Limited of reverse osmosis ... 18
1.7 Potential of Membrane Distillation in Desalination ... 20
1.8 Principles of Membrane Distillation ... 22
1.9 Membrane Distillation Materials ... 23
References: ... 25
CHAPTER TWO ... 28
Membrane Distillation ... 28
2.1 Theoretical ... 28
2.2 Driving Force and Vapour-Liquid Equilibrium ... 28
2.3 Heat transfer ... 29
2.3.1 Heat transfer in boundary layers ... 31
2.3.2 Heat transfer across membrane ... 32
2.4 Mass transfer ... 34
2.4.1 Mass transfer in the boundary layers ... 34
2.4.2 Mass transfer across the membrane ... 35
References: ... 40
CHAPTER THREE ... 42
Membrane Fouling... 42
3.1 Introduction ... 42
3.1.1 Particulate and colloidal fouling (Suspended Solids) ... 43
3.1.2Scaling ... 44
3.1.3 Organic fouling ... 48
3.1.4 Microbial fouling / Biofouling ... 50
3.2 Fouling in Membrane Distillation ... 51
3.2.1 Scaling in MD ... 51
3.2.2 Natural organic matter (NOM) fouling ... 53
3.2.4 Wetting and cleaning ... 55
References: ... 57
CHAPTER FOUR ... 59
Experimental Activity on CaCO3 Scaling in Presence of Humic Acid ... 59
4.1 Introduction ... 59
4.2 Theory of CaCO3 scaling ... 60
4.3 Materials and methods ... 61
4.4 Results and discussion ... 64
4.5 Conclusions ... 73
References: ... 75
Appendix A ... 78
CHAPTER FIVE ... 81
The effect of sulfate in Nanofiltration-Membrane Crystallization system ... 81
5.1 Introduction ... 81
5.2 Materials and Methods ... 82
5.3 Results and discussion ... 84
5.4 Economical aspects ... 91
5.5 Conclusions ... 91
References: ... 92
CHAPTER SIX ... 94
Membrane Bioreactor For Water Treatment ... 94
6.1 Introduction ... 94
6.2 Compare MBR with CAS ... 94
6.3 MBR configuration ... 97
6.4 Membrane materials and modules ... 99
6.5 MBR Market Overview ... 99
6.6 Challenges for developing MBR technology ... 100
6.7 Objective ... 101
References: ... 102
CHAPTER SEVEN ... 103
Removal of the Organic matter by Submerged Ultrafiltration ... 103
7.1 Introduction ... 103
7.2 Materials and methods ... 104
7.3 Results and Discussions ... 107
7.4 Conclusions ... 118
References: ... 120
CHAPTER EIGHT ... 123
8.2 Theory ... 124
8.3 Materials and methods ... 126
8.4 Results and discussion ... 129
8.5 Conclusions ... 138
References: ... 139
Summary
The scarcity of fresh water is considered of vital importance by civil, industrial, and agricultural sectors nowadays. Pollution and exploitation of groundwater aquifers and surface water have led to a decrease in quantity and quality of available natural water resources in many regions. In addition, higher living standards, especially in industrial countries, result in higher per capita water consumption and intensified water scarcity. To solve these problems, some strategies could be used, such as sustainable water resources management, wastewater treatment and desalination technologies.
Membrane distillation (MD) is a thermal membrane separation process that involves transport of vapor through microporous hydrophobic membranes and operated on the principle of vapor-liquid equilibrium. The driving force of the process is supplied by the vapor pressure difference caused by temperature gradient imposed among the liquid-vapor interfaces. In particular, the MD process has many advantages over conventional desalination processes such as multi-stage flash (MSF), reverse osmosis (RO), and multiple effect distillation (MED). The advantages of MD compared with these processes are as follows:
(1) Lower operating temperature and vapor space required than MSF and MED. (2) Lower operating pressure than RO.
(3) 100% (theoretical) rejection of non-volatile solute.
(4) Performance not limited by high osmotic pressure or concentration polarization. Membrane fouling is a major obstacle for efficient use of membrane technology for natural waters treatment, and increases the use of cleaning chemicals (consequently introducing a waste problem), ultimately shortens membrane life. Membrane fouling is mostly due to specific adsorption, gel layer formation and membrane pore plugging. Gel or cake layer formation may be caused by a variety of particulate substances including inorganic precipitates such as CaCO3, CaSO4, and several metal hydroxides,
organic materials such as proteins, natural organic matter (NOM), colloids, humic acids and other macromolecular materials, and biological components such as micro-organisms and products of their metabolism. All of these components are
present, in various extents, into seawater.
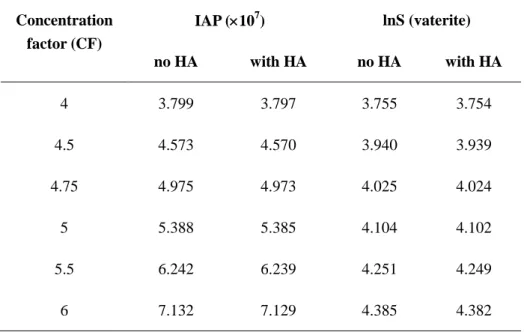
The results of experimental research emphasise the significant role played by microporous membranes in the heterogeneous nucleation mechanisms that control scaling in Membrane Distillation. For better understanding the complex phenomena of inorganic fouling, supersaturation, morphological and physicochemical properties of the membrane should be considered carefully. Supersaturation is mainly decided by the chemistry of the solutions and partially affected by concentration polarization phenomena. Induction times, determined by DLS measurements, will be significantly reduced if precipitation occurs in presence of membranes, thus CaCO3 nucleation
process will be accelerated.
DCMD tests, carried out on a semi-pilot plant for 35 h, demonstrated that scaling significantly reduced the transmembrane permeate flux by 33 %. With the help of humic acid at low concentration, the nucleation and growing rate of vaterite crystals were retarded, and supersaturation was also reduced. Besides, CaCO3 deposition on
the membrane surface (exacerbated at high ionic strength) also contributed – with minor extent with respect to scaling - to the decrease in the system performance.
Membrane Bioreactor (MBR), a compact-built purification system, combines the biological degradation step and the membrane separation step. Firstly, the influent is feed to the bio-reactor where the organic components are oxidized by the activated sludge at the same time. Then, the aqueous activated sludge solution passes through a membrane filtration unit and consequently the water is separated from the sludge. Finally, the sludge returns to the bio-reactor, while the permeate is discharged or re-used as particle-free effluent.
At the sole filtration stage, on the purpose of reducing flux value, TOC could be removed up to 63 % by using 70 kDa MWCO membrane, although polarization phenomena was in favor of the decrease in TOC rejection for higher trans-membrane fluxes. For this reason, removing TOC increased the overall efficiency of the proposed system by stimulating biodegradation before membrane filtration.
The study confirmed the ability of MDC to extremely concentrate RO brines which achieved a total water recovery factor above 90 % and an analogous volumetric
reduction of the waste to be discharged. Transmembrane fluxes in the order of 10-4 kg m-2s-1 reduced concentration polarization on membrane surface where heterogeneous nucleation took place. The possibility of preventing encrustations or irremovable deposits of solids due to uncontrolled supersaturation was recognized as a crucial task in order to achieve long-term stability of MDC.
All these results outline the potential impact of MDC on the economical and environmental aspects of membrane desalination industry, and more research efforts in this field should be encouraged.
Sommario
La scarsità di acqua dolce è considerata, al giorno d‘oggi, di vitale importanza per i settori civile, industriale, agricolo.L'inquinamento e lo sfruttamento delle falde acquifere sotterranee e di superficie hanno portato a una diminuzione della quantità e qualità delle risorse idriche naturali disponibili in molte regioni. Inoltre, gli standard di vita più elevati, soprattutto nei paesi industriali, provocano un aumento dei consumi pro capite di acqua e intensificato la scarsità d'acqua. Per risolvere questi problemi, alcune strategie potrebbero essere utilizzate, come la gestione sostenibile delle risorse idriche, trattamento delle acque reflue e le tecnologie di dissalazione.
La distillazione a membrana (MD) è un processo di separazione termica a membrana che comporta il trasporto di vapore attraverso membrane microporose idrofobiche ed è gestito secondo il principio di equilibrio liquido-vapore. La forza motrice del processo è fornita dalla differenza di pressione di vapore causata dal gradiente di temperatura imposto tra le interfacce liquido-vapore. In particolare, il processo di MD ha molti vantaggi rispetto aitradizionali processi di dissalazione, come flash multi-stadio (MSF), osmosi inversa (RO), e distillazione effetto multiplo (MED). I vantaggi di MD rispetto a questi processi sono i seguenti:
(1) bassa temperatura di esercizio e ridotto spazio necessario a vapore MSF e MED. (2) pressione di esercizio inferiore rispetto RO.
(3) 100% (teorico) la reiezione del soluto non volatile.
(4) Le prestazioni non limitate dalla alta pressione osmotica o dagli effetti di polarizzazione per concentrazione.
L‘intasamento delle membrane è uno dei principali ostacoli per un uso efficiente delle tecnologie a membrana per il trattamento naturale delle acque, e aumenta l'uso di prodotti chimici di pulizia (di conseguenza l'introduzione di un problema dei rifiuti), riducendo, in ultima analisi, la vita della membrana. Il fouling delle membrane è dovuto principalmente all‘ adsorbimento specifico, alla formazione di strato di gel e tamponamento dei pori della membrana. La formazione di strati di gel o di torta può essere causato da una varietà di sostanze tra cui il particolato di precipitati inorganici
come CaCO3, CaSO4, e idrossidi di metalli diversi, materiali organici come proteine,
la materia organica naturale (NOM), colloidi, acidi umici e altri materiali macromolecolari, e dei componenti biologici come microrganismi e prodotti del loro metabolismo. Tutte queste componenti sono presenti, in varia misura, nell‘ acqua di mare.
I risultati della ricerca sperimentale hanno teso a sottolineare il ruolo significativo svolto da membrane microporose nei meccanismi di nucleazione eterogenea che controllano the scaling nella distillazione a membrana. Per una migliore comprensione dei complessi fenomeni di sporcamento inorganico, sovrasaturazione, proprietà morfologiche e fisico-chimiche della membrana devono essere considerate con attenzione. La sovrasaturazione è principalmente controllata dalla chimica delle soluzioni e in parte influenzata da fenomeni di polarizzazione per concentrazione. I tempi di induzione, determinati mediante misurazioni DLS, saranno notevolmente ridotti se la precipitazione si verifica in presenza di membrane, quindi il processo di nucleazione CaCO3 sarà accelerato.
Le prove DCMD, effettuate su un impianto semi-pilota per 35 h, hanno dimostrato che lo scaling ha ridotto significativamente al 33% il flusso transmembrana permeato Con l'aiuto di acidi umici a bassa concentrazione, la nucleazione e la velocità di crescita dei cristalli di vaterite sono stati ritardati, e la sovrasaturazione è stato anche ridotta. Inoltre, la deposizione di CaCO3 sulla superficie della membrana (aggravato
ad alta forza ionica) ha contribuito anche - con misura minore rispetto alla rappresentazione in scala - alla diminuzione delle prestazioni del sistema.
Un bioreattore a membrana (MBR), che è un sistema di depurazione compatto , combina la fase di degradazione biologica e la fase di separazione a membrana. In primo luogo, è l'affluente è alimentato al bio-reattore in cui vengono ossidati i componenti organici del fango attivo. Quindi, la soluzione acquosa a fanghi attivi passa attraverso un gruppo di filtrazione a membrana e di conseguenza l'acqua viene separata dal fango. Infine, i fanghi vengono riciclati al bio-reattore, mentre il permeato viene scaricato o riutilizzato come effluente priva di particelle.
rimosso fino al 63% con una membrana 70 kDa MWCO, anche se i fenomeni di polarizzazione favore sono favoriti da maggiori flussi transmembrana Per questo motivo, la rimozione di TOC aumentata l'efficienza complessiva del sistema proposto, stimolando la biodegradazione prima della filtrazione a membrana.
Lo studio ha confermato la capacità di MDC di concentrare brine per un fattore di recupero di acqua superiore al 90% e una riduzione analoga volumetrica dei rifiuti da scaricare. I flussi transmembrana nell‘ ordine di 10-4 kg m-2s-1 riducono la polarizzazioneper concentrazione sulla superficie della membrana in cui la nucleazione eterogenea ha avuto luogo. La possibilità di prevenire incrostazioni o depositi inamovibili dei solidi a causa di supersaturazione incontrollata è stato riconosciuta come un compito cruciale per il raggiungimento di una stabilità a lungo termine di MDC.
Tutti questi risultati delineano l'impatto potenziale di MDC sugli aspetti economici e ambientali del settore dissalazione a membrana, maggiori sforzi di dovrebbero essere concentrati su questo filone di ricerca..
CHAPTER ONE
Membrane Desalination
1.1 DesalinationIn recent years, the scarcity of fresh water has been considered as a primary issue by civil, industrial, and agricultural sectors. Water scarcity, which occurs not only in arid regions, may be caused by mismatch between water supply and water demand: Pollution and exploitation of groundwater aquifers and surface water have led to the decrease in quantity and quality of available natural water resources in many regions. The ongoing growth of population, industry and agriculture further increases water demand. In addition, higher living standards, especially in industrial countries, result in higher per capita water consumption and intensified water scarcity. To overcome these obstacles, researchers are seeking some strategies such as sustainable water resources management, wastewater treatment and desalination technologies, etc [1].
Take China as an example, the total volume of water resource is 21,812.4 billion m3 (occupying the 6th place in the world), nevertheless the per-capita water resource volume is only 1/4 of that of the world average and serious summer drought conditions tend to occur in the northwest so much so that it is classified as one of the most poorest water shortage countries in the world. In more than 300 cities, water shortage has already become a serious problem, especially in the northern coastal area and several islands (like Tianjin, Beijing, Hebei, Shandong, Henan, Shanxi, Liaoning, Ningxia, etc).The coastal area occupies about 15 % of the whole country, has a coastline longer than 18,000 km, over 6,500 islands and population accounting for more than 40 % of the whole country, and is also the most developed economical area in China. Water shortage has already become the bottleneck on development of social progress and economy [2].
On the other hand, a low contamination use such as cooling water taken from rivers, which contributes highly to water abstraction figures in some countries such as China and India, may create much less water stress than agricultural or urban use.
Frequently, part of the water is less accessible or of lower quality. As soon as the convenient water resources are utilized, a hard competition for water arises between agriculture, industry and the public water users. This competition may lead to higher water prices, constricted economic development and social problems in regions with limited water access. As a result, the general welfare of a country under water stress conditions is threatened. Exploitation of natural fresh water resources combined with higher water demand has led to an increased demand for alternative fresh water resources. Since about 97.5 % of the water is present as oceans on the earth, desalination will unavoidably become a feasible method in the next decades. Desalination provides such an alternative source, offering water otherwise not accessible for irrigational, industrial and municipal use [1].
1.2 Desalination market
There are desalination facilities in more than 100 countries, especially in those oil-rich, water-poor countries in the Middle East, like Saudi Arabia, the United Arab Emirates and Kuwait. The continued proliferation of desalination facilities has built up a global market with more than $8 billion, with continued rapid growth rate. Two-thirds of the world‘s desalination plants are located in Gulf Cooperation Council (GCC) countries [3].
Desalination markets have expanded in the last decades. The global market for desalinating seawater and brackish water to generate new supplies of potable water will grow at a compound annual growth rate of 9.5 % over the next 10 years, effectively tripling the market in size to reach a capacity of 54 billion cu meters per year.
The market with the greatest installed capacity is the Gulf Region (Middle East), where low cost of fossil fuel led to preferred application of thermal desalination processes. The Mediterranean market follows, ahead of the American and Asian markets. The Gulf region will continue to be the greatest market for new desalination equipment because of a rapid growth in population and necessary replacement of
over-aged plants. A doubling in capacity until 2015 is expected. The countries around the Mediterranean Sea will experience the largest growth rate with a smaller expansion expected in Asia until 2015.
Asia will become a fast growing market in the long run, due to its enormous population and economic growth that will most likely lead to a water demand that cannot be satisfied with conventional water sources. According to the industrial tracking and survey results by Desalination Association of China in 2008, 56 seawater desalination plants were established in China till December in 2008 the total capacity is 276,100 m3/d. The gross desalination productivity in China has reached 295,000 m3/d, increased by 46 % compared with that in 2007. Moreover, the productivity of programs under construction has reached to 268,000 m3/d, in which 82,500 m3/d is in bidding progress or conceptual design. Productivity of desalination programs on plan in China has reached 200,000 m3/d.
A survey has been carried out of 46 desalination plants in Australia that have capacities greater than 10 kL/day. Operating plants, all except one utilising reverse osmosis (RO) as the desalination process, have a total output of 294 ML/day, while the outputs for plants under construction amount to 976 ML/day, and for proposed plants 925 ML/day. The total current desalted water usage is 153 ML/day for potable supplies and 141 ML/day for industrial purposes. By the year 2013 this will amount to 1,734 ML/day for potable and 461 ML/day for industrial supplies. The most dramatic increase is occurring in the major cities where the installed production capacity of seawater desalination will increase tenfold from 45 GL/year in 2006 to over 450 GL/year by 2013 [4].
The largest growth market will be the Mediterranean Rim, where Algeria, Libya, and Israel are anticipating capacity increases in excess of 300 %. With desalination back on the political agenda in Spain, the total increase in capacity in the Mediterranean region will be 179 %. For example, in Mallorca, desalination capacities expanded from 450,000 m3/y to 17,210,000 m3/y [5].
1.3 Desalination technology
Desalination processes were developed to obtain fresh water from the seawater. Desalination technologies can be classified into thermal and membrane based desalination by separation mechanism. Tradition desalination processes are mainly thermal based, including multi stage flash (MSF), multi effect evaporation (MEE) / multi effect distillation (MED), vapor compression (VC) and solar desalination. Membrane based separation processes include reverses osmosis (RO) and electro-dialysis (ED).
Thermal desalination separates salt from water by evaporation and condensation, whereas in membrane desalination water diffuses through a membrane, while salts are almost completely retained. An overview of available desalination techniques is given in Table 1.1.
Table 1.1 Applied desalination technologies
Thermal desalination technologies Membrane desalination technologies Multi-stage flash distillation (MSF) Reverse osmosis (RO)
Multi-effect distillation (MED) Nanofiltration (NF) Vapour compression distillation (VCD) Electrodialysis (ED)
Among these available technologies, MSF distillation and RO dominate the existing plants. Multi-stage flash distillation (MSF) is the most frequently applied and still preferred in the Middle East. Reverse osmosis is the most common membrane based desalination option in seawater and brackish water desalination, dominating in the area around Mediterranean Sea.
Thermal desalination is more energy intensive than membrane based desalination, but can better deal with more saline water and deliver even higher permeate quality. Table 1.2 demonstrates the differences in key operational data between thermal and membrane desalination technologies. Energy consumption of reverse osmosis is the lowest among all options for seawater desalination, making it most cost efficient in
regions with high energy cost. Especially in brackish water desalination, reverse osmosis offers great advantages over thermal desalination technologies due to its much lower energy consumption at low salt concentration. The variable cost of thermal desalination plants are almost independent of feed water salinity, while membrane process variable cost is nearly proportional to the feed water salinity and therefore lower in brackish water than in seawater desalination, making reverse osmosis and electrodialysis the most economic processes. For all desalination technologies, costs have steadily decreased in the last decades. Generally, thermal desalination is more cost intensive than reverse osmosis desalination. Comparing the thermal separation processes, the advantages of Membrane technology are operational simplicity, good compatibility and synergy between different membrane operations in integrated systems, low energetic requirements, good stability under a wide range of operative conditions, high eco-compatibility, easy control and scale-up, large flexibility. All these specialties make membrane technology as a powerful tool in the logic of the process intensification.
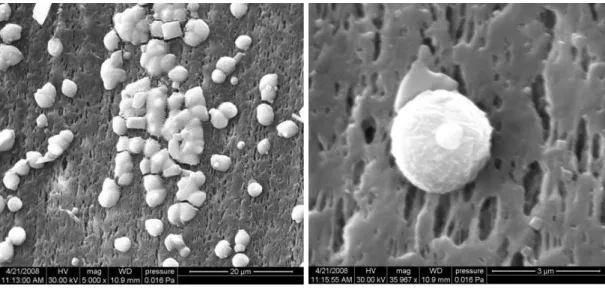
Table 1.2 Key operational data of thermal and membrane desalination technologies [5]
MSF RO Electrodialysis
Thermal energy consumption [kWh/m ³] 12 0 0
Electrical energy [kWh/m³] 35 0.4 –7 1
Typical salt content of raw water 30,000–100,000 1,000–45,000 100–3,000 Product water quality (ppm TDS) <10 <500 <500
1.4 Membrane technology market
The application of membrane desalination in seawater desalination has substantially increased in the last 30 years. The reverse osmosis membrane market is expanding at an annual rate in excess of 8% fueled by the intensifying worldwide water shortage and the need to preserve water resources from environmental
perspective. Today, more than 2,000 reverse osmosis (RO) installations are being operated worldwide, with an overall production higher than 800 MGD. The total worldwide market for RO membrane system was worth of 670 billion won as of 2008 and is growing at 10.3 % annually [6].
1.5 Reverse Osmosis
Reverse Osmosis is by far the most widespread type of membrane desalination process. It is capable of rejecting nearly all colloidal or dissolved matter from an aqueous solution, producing the brine and the permeation which consists of almost pure water.
Reverse Osmosis is a (differential) pressure driven separation technique. The membrane of Reverse Osmosis is based on a property of certain polymers called semi-permeability. By applying a pressure difference, the permeating component(s), in most applications nearly exclusively water, are forced through the membrane. In order to overcome the feed side osmotic pressure, fairly high feed pressure is required. In seawater desalination it commonly ranges from 55 to 68 bars. Operating pressures for the purification of brackish water are lower due to the lower osmotic pressure caused by lower feed water salinity. Besides its application for production of drinking water, reverse osmosis is also applied in the treatment of effluent water and separation of organic and inorganic compounds from aqueous solution for industrial applications. Although Reverse Osmosis has also been used to concentrate organic substances, its most frequent use lies in seawater desalination applications.
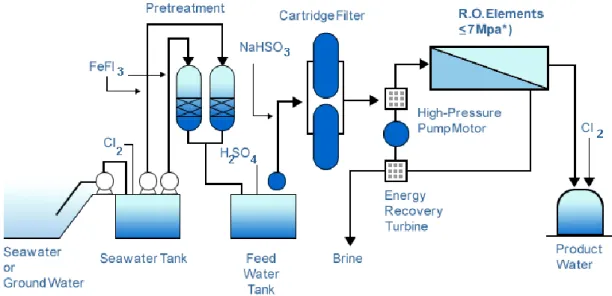
The Reverse Osmosis desalination plant process includes seven stages [7], they are: water abstraction, pre-treatment, pumping system, membrane separation unit, energy recovery system, post-treatment and control-system (see Figure 1.3 and Figure1.4).
Figure 1.3 Reverse Osmosis treatment process
Figure 1.4 Existing RO Plant [8]
In fact, pressure-driven membranes such as microfiltration (MF) and ultrafiltration (UF) are the new trends in designing the pretreatment systems for desalination plants and they can be used as a substitute for the conventional pretreatment technologies. MF can remove suspended solids and lower the silt density index (SDI) while in UF, not only suspended solids and large bacteria are retained, but also (dissolved) macromolecules, colloids and small bacteria. MF and UF pretreatment leaded to a better control of membrane biofouling, increased the membrane lifetime, and limited
the cleaning frequency of the plant. Furthermore, permeate fluxes measured at the successive high-pressure membrane filtration unit increase up to 30 %, thus resulting in higher reliability and better overall economics of the desalination system. In RO desalination, the capital and operating costs are the major drivers for process selection and due to relatively low water recovery in RO plants, any cost saving incurred in the pretreatment system will strongly affect the cost of water produced. Actually, the MF/UF was predicted to contribute for about 10 % reduction in the total water cost [9]. It has been reported that a reduction of 39 % in the operating and maintenance costs can be achieved when replacing the conventional pretreatment with MF or UF. Besides, the elimination of flocculation, recarbonation and filtration steps will decrease the power and chemical costs and reduce the plant space which leads to a significant reduction in the plant capital costs [10].
Moreover, nanofiltration (NF) is today used in softening, disinfection, and removal of organic materials and metals. The installation of NF as a pretreatment will lead to a breakthrough in the application of RO due to its capability of effectively removing dissolved organic compounds, scale forming hardness ions, and bivalent ions. As consequence, the osmotic pressure of RO feed and retentate streams is decreased, thus allowing the system to be operated at high water recovery factors (70 %) with minor scaling problems [11]. At this stage, the integrated pressure-driven membrane (MF/UF-NF-RO) system is characterized by global water recovery factors up to 50 %, energy saving of 25-30 %, less consumption of chemicals and additives, smaller land space, and less amount of discharged wastes [12, 13].
1.6 Limited of reverse osmosis
Currently, reverse osmosis (RO) is one of the most prevalent technologies for seawater desalination. Although the utilization of RO, also in combination with other pressure driven membrane operations such as microfiltration (MF), ultra-filtration (UF) and nano-filtration (NF) as pre-treatment to the RO stage, has led fundamental contribution in terms of overall process economics, one of the main problems still
open is the management of the salts concentrates. Recovery rates in brackish water reverse osmosis (BWRO) applications are limited by the risk of scale precipitation and are typically in the range of 75 %–80 %. In seawater reverse osmosis systems (SWRO) recovery rates may at most reach 60 % due to limited feed pressure and increased energy consumption at elevated salt concentrations. Feed pressure typically reaches 55-65 bars in SWRO and BWRO desalination uses moderate feed pressures of 10–15 bars. This would result in a significant residue of high concentrated solutions to be disposed-off. At present, the most frequent disposal practice for brines is a direct discharge into lakes, lagoons, rivers, ocean and sanitary sewer. Because disposal options are limited, disposal is associated with high additional costs and environmental damage has to be expected.
However, the promulgation of more and more stringent environmental protection regulations will preclude this low-cost possibility in the near future. In the last years, several process engineering strategies have been implemented in order to accomplish the concept of ‗zero-liquid‘ or ‗quasi-zero-liquid‘ discharge in seawater reverse osmosis desalination. Delivery of fresh water from seawater desalination plants demands piping and pumping systems to transport product water from coastal regions to residential areas, which increase cost. High availability of brackish water in residential areas makes expensive deli piping and pumping unnecessary. In this context, membrane contactors (MCs) technology is expected to offer alternative design-pathways for brine management [14].
Another crucial drawback of RO membranes is their weakness against fouling due to the presence of colloidal, particulate, dissolved organics and inorganic matter in feed water, as well as biological growth in the RO system. Therefore, it is required to install a pretreatment step for the feed water before going to the RO unit. The conventional pre-treatment were based on mechanical treatment (media filters, cartridge filters) followed by extensive chemical treatment like flocculation, coagulation, acid treatment and disinfection. The main problems in using the conventional pretreatment is that it does not represent a complete barrier to colloids
addition, this pretreatment is known to be complex, labor intensive and space consuming. Furthermore, it consumes large amount of chemicals which are used for coagulant dosages to provide surface charge neutralization, chlorination to limit biological growth, and flocculation-sedimentation sequences.
1.7 Potential of Membrane Distillation in Desalination
Membrane distillation (MD) is a methodology having a great potential as concentration process carried out at low temperature. MD is not affected by concentration polarization phenomenon, whereas it represents the critical limit for pressure driving processes such as NF or RO. Production of high purity distillate, absence of limitation caused by fouling, lower energy consumption with respect to conventional evaporation or distillation operations are additional advantages of this technique, especially when coupled with solar energy or utilizing low-grade heat source [15-17]. MD systems powered by solar energy have been shown cost competitive with reverse osmosis in remote areas [18, 19].
In 2004, researchers at the University of Texas at El Paso (UTEP) in collaboration with the Swedish firm SCARAB DEVELOPMENT AB studied methods coupling solar pond technology with desalination to create a zero discharge system, and MD was one of the technologies that were investigated as part of the zero discharge concepts [20, 21]. Moreover, when combine MSF and MED modes into one air gap membrane distillation module. The process promised to decrease desalination costs to 0.26 $/m3, using low-grade waste steam or heat as driving force. For comparison, the unit cost of water produced by conventional thermal desalination is around 1.00 $/m3 for MED and 1.40 $/m3 for MSF, while it is around 0.5 $/m3 for RO [22-24].
The Configurations of MD integrated pressure-driven membranes system is illustrated in Figure 1.5:
from RW tank MF reject NF Lime/soda CaCO3 RO MC Salts+Brine re te n . Desalted water Heat exchanger reject EDR
Figure 1.5 MD integrated pressure-driven membranes system
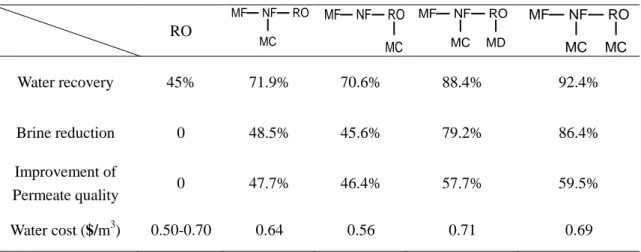
Configurations of MD integrated pressure-driven membranes system are summarized in Table.1.6. It demonstrated that integrated membrane system will offer essential improvements in efficiency, water cost and environmental impact. The total water cost decreased as the water recovery was increased due to the fact that smaller intake/discharge facilities and lower membrane surface area were required since higher flux values were obtained at higher recoveries.
Table 1.6 Several integrated membranes systems RO Water recovery 45% 71.9% 70.6% 88.4% 92.4% Brine reduction 0 48.5% 45.6% 79.2% 86.4% Improvement of Permeate quality 0 47.7% 46.4% 57.7% 59.5% Water cost ($/m3) 0.50-0.70 0.64 0.56 0.71 0.69
Membrane distillation (MD) is a thermal membrane separation process that involves transport of vapor through microporous hydrophobic membranes and operated on the principle of vapor-liquid equilibrium as a basis for molecular separation. The driving force of the process is supplied by the vapor pressure difference caused by temperature gradient imposed between the liquid-vapor
MF NF RO MC MC MF NF RO MC MF NF RO MC MF NF RO MC MD
interfaces. In particular, the MD process can be used as a substitute for conventional desalination processes such as multi-stage flash (MSF), reverse osmosis (RO), and multiple effect distillation (MED). The advantages of MD compared with these pro-cesses are as follows:
(1) lower operating temperatures and vapor space required than MSF and MED; (2) lower operating pressure than RO;
(3) 100 % (theoretical) rejection of non-volatile solute;
(4) performance not limited by high osmotic pressure or concentration polarization. Since MD is a thermally driven process, operating pressures are generally on the order of zero to a few hundred kPa, relatively low compared to pressure driven processes RO. Lower operating pressures translate to lower equipment costs and increased process safety. Another benefit of MD stems from its efficiency in terms of solute rejection. Since MD operates on the principles of vapor-liquid equilibrium, 100 % (theoretical) of ions, macromolecules, colloids, cells, and other non-volatile constituents are rejected; RO is not to achieve such high levels of rejection. When applied to desalination, a well designed MD system typically achieves water fluxes as high as 75 kg/m2/h, which is comparable to RO. Since MD operates at pressures significantly lower than those encountered in the pressure-driven processes, the mechanical demands on these micro-porous membranes is greatly reduced.
1.8Principles of Membrane Distillation
MD processes have several configurations depending on the way by which the vapor is recovered in the permeate side. In general, MD systems may be classified into four different categories as follows [25–31]:
(1) An aqueous solution colder than the feed solution is maintained in direct contact with the permeate side of the membrane giving rise to the configuration known as direct contact membrane distillation (DCMD). The transmembrane temperature difference induces a vapor pressure difference. Consequently, volatile molecules evaporate at the hot liquid/ vapor interface, cross the membrane in vapor phase and
condense in the cold liquid/vapor interface inside the membrane module.
(2) A stagnant air gap is interposed between the membrane and a condensation surface. In this case, the evaporated volatile molecules cross both the membrane pores and the air gap to finally condense over a cold surface inside the membrane module. This MD configuration is called air gap membrane distillation (AGMD).
(3) A cold inert gas sweeps the permeate side of the membrane carrying the vapor molecules and condensation takes place outside the membrane module. This type of configuration is termed sweeping gas membrane distillation (SGMD).
(4)Vacuum is applied in the permeate side of the membrane module by means of a vacuum pump. The applied vacuum pressure is lower than the saturation pressure of volatile molecules to be separated from the feed solution. In this case, condensation occurs outside of the membrane module. This MD configuration is termed vacuum membrane distillation (VMD).
Among the other MD configurations DCMD is simplest to operate - does not require vacuum pump as in vacuum membrane distillation (VMD), nor condenser as in sweep gas membrane distillation (SGMD) or cooling surface as in air gap membrane distillation (AGMD) - and the distillation process can be carried out in any desired membrane configuration (flat sheet, spiral wound, capillaries or hollow fibers). Thus, DCMD can be conveniently applied for investigations in which water is the major fluxing component, such as in desalination [32–35].
1.9 Membrane Distillation Materials
The main requirements for MD process are that the membrane must not be wetted and only vapor and noncondensable gases are present within its pores. The pores size of the membranes used in MD lies between 10 nm and 1um. To avoid pore wettability, the membrane material must be hydrophobic with high water contact angle and small maximum pore size. Hydrophobic microporous membranes such as those made from polypropylene (PP), polyethylene (PE), polytetrafluoroethylene (PTFE), and polyvinylidene fluoride (PVDF) meets these requirements. However pore wettability
may occur and permeate quality may be affected if solutions with surface active components are brought in direct contact with the membrane surface or if the transmembrane hydrostatic pressure exceeds the liquid entry pressure (LEP), which is characteristic of each membrane. MD is therefore, a process mainly suited for applications in which the major component is water [36].
References:
[1] E. El-Zanati, K.M. El-Khatib. Integrated membrane based desalination system. Desalination, 2007, 205: 15.
[2] Congjie Gao, Jia Xu. Development of seawater desalination technology in China. EU-CHINA WORKSHOP 2009.
[3] Water desalination report, 2008. IDA Desalination Year Book 2007-2008.
[4] Manh Hoang, Brian Bolto, Carolyn Haskard, Olga Barron, Stephen Gray, Greg Leslie. Desalination in Australia report 2009.
[5] C. Fritzmann, J. Löwenberg, T. Wintgens and T. Melin. Desalination, 2007, 216 (1-3, 5): 1-76. [6]Membrane Separation Technologies 2009, Global Industry Analysts, Inc.
[7] www.biosystemsasia.com
[8] www.ci.wellington.fl.us/html/Departments/Util.
[9] M. Wilf and M.K. Schierach. Improved performance and cost reduction of RO sweater systems using UF pretreatment. Desalination, 2001, 135: 61.
[10] G.L. Leslie et al., Proc. AWWA. Water Reuse Conference, Florida, 1998.
[11] N. Hilal et al. A comprehensive review of nanofiltration membranes: treatment, pretreatment modeling, and atomic force microscopy. Desalination, 2004, 170: 281.
[12] M.M. Nederlof, J.C. Kruithof, J.S. Taylor, D. van der Kooij and J.C. Schippers. Comparison of NF/RO membrane performance in integrated membrane systems. Desalination, 2000, 131: 257.
[13] E. Drioli, A. Criscuoli, E. Curcio. Integrated membrane operations for seawater desalination. Desalination, 2002, 147: 77.
[14] E. Curcio, E. Drioli. Membrane distillation and related operations. Separation & Purification Reviews, 2005, 34: 35.
[15] F. Banat, R. Jumah and M. Garaibeh. Exploitation of solar energy collected by solar stills for desalination by membrane distillation. Renewable Energy, 2002, 25: 293.
[16] Z. Ding, L. Liu, M.S. El-Bourawi and R. Ma. Analysis of a solar-powered membrane distillation system. Desalination, 2005, 172: 27.
[17] J. Koschikowski, M. Wieghaus and M. Rommel. Solar thermal-driven desalination plants based on membrane distillation. Desalination, 2003, 156: 295.
[18] G.L. Morrison, Sudjito, A.G. Fane and P, Hogan. Solar heated membrane distillation, Proc. of the Biennial Congr.of the Int. Solar Energy Soc., Sydney, Australia, Pergamon, 1992: 2329-2334.
[19] P.A. Hogan, Sudjito, A.G. Fane and G.L. Morrison. Desalination by solar heated membrane distillation. Desalination, 1991, 81: 81-90.
[20] www.scarab.se
[21] J. Walton, H. Lu, C. Turner, S. Solis and H. Hein. Solar and waste heat desalination by membrane distillation. 98-FC-81-0048, DWPR n. 81, El Paso TX, 2004.
[22] J.H. Hanemaaijer, J. van Medevoort, A.E. Jansen, C. Dotremont and E. van Sonsbeek. Memstill membrane distillation - a future desalination. Desalination, 2006, 199: 175. [23] B. Van der Bruggen. Desalination by distillation and by reverse osmosis – trends towards the
future. Membrane Technology, February/2 (2003) 6.
[24] C. Fritzmann, J. Löwenberg, T. Wintgens and T. Melin. State-of-the-art of reverse osmosis desalination. Desalination, 2007, 216: 1.
[25] K.W. Lawson, D.R. Lloyd. Membrane distillation. J. Membrane Sci., 1997, 124: 1-25. [26] J.I. Mengual, L. Pe˜na. Membrane distillation. Colloid Interf. Sci., 1997, 1: 17-29.
[27] R.W. Schofield, A.G. Fane, C.J.D. Fell. Heat and mass transfer in membrane distillation. J. Membrane Sci., 1987, 33: 299–313.
[28] M. Khayet, M.P. Godino, J.I. Mengual. Theory and experiments on sweeping gas membrane distillation. J. Membrane Sci., 2000, 165: 261-272.
[29] F.A. Banat, J. Simandl. Theoretical and experimental study in membrane distillation. Desalination, 1994, 95: 39-52.
[30] S. Bandini, C. Gostoli, G.C. Sarti. Separation efficiency in vacuum membrane distillation. J. Membrane Sci., 1992, 73: 217-229.
[31] S. Kimura, S.I. Nakao, S.I. Shimatani. Transport phenomena in membrane distillation. J. Membrane Sci., 1987, 33 (3): 285–298.
[32] K.W. Lawson and D.R. Lloyd. Membrane distillation. II. Direct contact membrane distillation. J. Membrane Sci., 1996, 120: 123.
[33] B. Li and K.K. Sirkar. Novel membrane and device for direct contact membrane distillation-based desalination processes. Ind. Eng. Chem. Res., 2004, 43: 5300.
[34] L. Martínez-Díez, M. I. Vázquez-González, F. J. Florido-Díaz. Study of membrane distillation using channel spacers. J. Membrane Sci. 1998, 144: 45.
[35] E. Drioli, E. Curcio, A. Criscuoli, G. Di Profio. Integrated system for recovery of CaCO3,
NaCl and MgSO4·7H2O from nanofiltration retentate. J. Membrane Sci., 2004, 239: 27.
[36] A. Gabelman and S.-T. Hwang. Hollow fiber membrane contactors. J. Membrane Sci., 1999, 159: 61.
CHAPTER TWO
Membrane Distillation
2.1 TheoreticalIn MD, mass transfer of water vapor through a micro-porous hydrophobic membrane coupled with heat transfer through the membrane and heat transfer to and from the membrane surfaces. The separation process in MD is characterized by both simultaneous heat and mass transfer, since mass (vapor) transport through membrane pores occurs as a result of the difference in temperature and composition between the feed and the permeate.
2.2 Driving Force and Vapour-Liquid Equilibrium
For small changes of the number of moles in the two phases (caused by the mass transfer across the membrane), the variation of the Gibbs free energy (G) is:
( ' i'') i'
i
i u dn
u
dG
(2.1) Equation (2.1) expresses a general concept: the driving force for the mass transport of a component from one phase to the other is given by the difference in the chemical potential of the two phases caused by changes in temperature, pressure and activity. In equation (2.2), ni is the mole of i-th component transferred and is related totransmembrane flux Ji by:
i
i AJ
dt dn
(2.2) where t indicates the time and A the membrane area. As previously stated, the hydrostatic pressure gradient across the membrane is negligible in MD, and the driving force of process is the partial pressure difference across the membrane, established by a temperature difference between the two contacting solution, or by vacuum, air gap, or sweep gas in the permeate side. In the frequent case of non-ideal mixtures, the vapour-liquid equilibrium is mathematically described in terms of partial pressure (pi), vapour pressure of pure i (pi 0), and activity coefficient ji,
according to the well-known thermodynamic relationship:
pi Pyi pi0ai pi0ixi (2.3) In equation (2.3), P is the total pressure, ai the activity, and xi and yi are the liquid
and vapour mole fraction, respectively. The vapour pressure p0 of a pure substance varies with temperature according to the Clausius-Clapeyron equation:
2 0 RT dT dp (2.4)
where λ is the latent heat of vaporization (λ =9.7 cal/mol for water [1]), R the gas constant, and T the absolute temperature. At the pore entrance, the curvature of the vapour-liquid interface is generally assumed to have a negligible effect on the equilibrium; however, possible influences on the vapour pressure value can be estimated by the Kelvin equation:
r c R T p p L a c e c o n v e x s u r f 2 e x p 0 0 (2.5) where r is the curvature radius, γ L the liquid surface tension, and c the liquid molar density. The expression for activity coefficient in diluted aqueous ionic solutions can be derived from the Debye-Hückel theory:
log ZZ I (2.6) Here is the activity coefficient of the electrolyte, ψ is a constant that depends on the temperature and solution permittivity, z is the ion valence, and I the ionic strength of the solution given by:
i i iC Z I 2 2 1 (2.7) In an aqueous solution at 25℃ the constantψ is 0.509 (mol kg-1)1/2 [2].2.3 Heat transfer
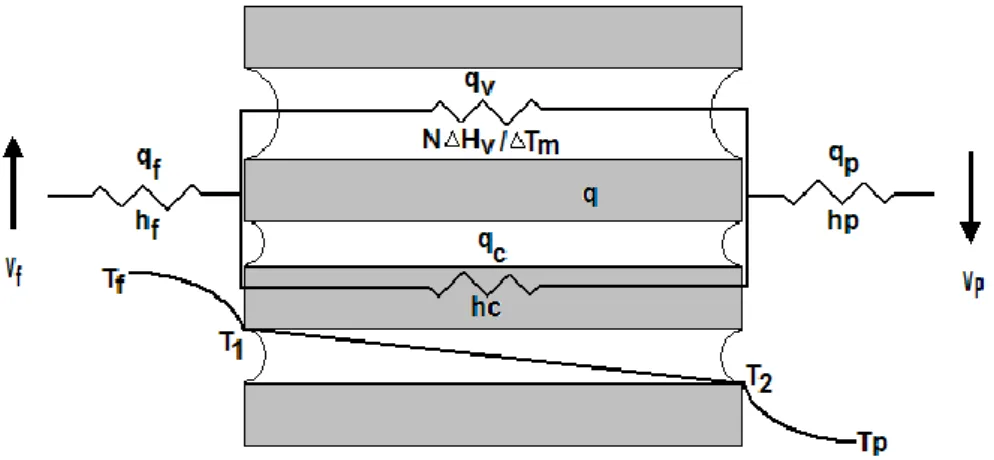
Figure 2.1 Heat transfer resistances in DCMD
Heat transfer in MD processes is always coupled with mass transfer. Heat transfer processes is divided into three parts [3]:
(1) first, heat is transferred from the heated feed solution across the thermal boundary layer to the membrane surface qf;
(2) second, the heat passes through the membrane in the form of vapor latent heat
qv and heat conduction qc through the membrane structure;
(3) finally, the heat is removed from the cold permeate side of membrane surface through the boundary layer qp.
The boundary layers next to the membrane surface may contribute significantly to overall heat transfer resistance [4-7].
The heat transfer processes equations for three steps in heat flows in and around the membrane are [8]:
along the module at feed and permeate sides:
Qf cpf
mf NA
Tf (2.8.a)
p
ppp
p c m NA T
Q (2.8.b)
across the membrane:
C V
m Q+Q
Q (2.9) within the boundary layers at feed and permeate sides:
T T1
h
p
p
p h T T
Q 2 (2.10.b)
overall heat balance at the steady state:
p m
f Q Q
Q (2.11)
Hence, the total heat transferred across the membrane is expressed as [4]:
T H
Q (2.12) The overall heat transfer coefficient of the MD process is given by:
1 1 / 1 1 p m v c f h N H T h h H (2.13)
where each h represents the corresponding heat transfer coefficient shown in Figure 2.1, N is the molar flux, Hv is the heat of vaporization.
2.3.1 Heat transfer in boundary layers
The liquid heat transfer coefficients depend on the physical properties of the solution as well as on the hydrodynamic conditions acting on the MD system. It is important to minimize the boundary layer resistances by maximizing the boundary layer heat transfer coefficients hf and hp. This is to allow the MD system to supply large quantity of heat to the surface of the membrane to vaporize the liquid. In MD processes, the interfacial temperatures (T1 and T2) are often differ significantly from the measured temperatures of bulk solutions at the feed and permeate sides (Tf and Tp). This phenomenon is called the temperature polarization [8, 9]. It causes reduction in the driving force of the MD process due the decrease in the vapor pressure difference across the membrane. The interfacial temperatures (T1 and T2) cannot be measured directly, and they are significantly affected by applied membrane physical properties and interfacial film heat transfer coefficient (hf and hp). The temperature polarization coefficient (TPC) is used to evaluate the efficiency of MD systems by quantifying the magnitudes of the boundary layer resistances relative to the total heat transfer resistance of the MD system. The TPC is defined as [4, 7]:
p f T T T T TPC 1 2 (2.14)
The recommended TPC range is from 0.4 to 0.7 for satisfactory designed system [4]. The boundary layer heat transfer coefficients may be measured experimentally or they often estimated from empirical correlations based on dimensionless numbers, like Nusselt (Nu), Reynolds (Re) and Prandtl (Pr) numbers. The most often relationships is: i h T i i i c m b b a d k Nu h and C Nu Pr Re (2.15)
where C, a, b and c are the coefficients depending on the channel configuration of the heat exchanger and flowing character of the streams [8].
2.3.2 Heat transfer across membrane
The heat transfer across the membrane is two parts [9]:
(1) qc transferred by both conduction through the membrane material.
(2)qv the latent heat of vaporization associated with the vapor flowing through the membrane.
Heat transfer models for calculating membrane interfacial temperatures T1 and T2 were developed on the assumptions of linear temperature distribution across the membrane and an associated isenthalpic flow of vapor in early literature [6, 10]. In these models, the total heat flux through the membrane Qm is the sum of the heat conduction qc and the latent heat of vaporization qv is:
T1 T2 s k H N Q m T m (2.16)Hence, combination of equation (2.3) with equation (2.13) to measure the interfacial temperatures:
m
f T f f f p m h s K NH T h T T s K T 1 / / 1 (2.17.a)
m
p T p p p f m h s K NH T h T T s K T 1 1 2 1 / / (2.17.b) With α =hf /hpFrom above equations, latent heat of vaporization is promoting the permeate flux, whereas heat conduction across the membrane is considered as heat loss since there is no corresponding mass transfer. It was shown that 20-50 % of the total heat transferred in MD process is lost by conduction in literature [11]. The conduction heat transfer coefficient km is usually estimated from vapor and solid phase thermal conductivities as:
km kv
1
ks (2.18)where ks and kv are the heat transfer coefficients of the solid membrane material and the vapor within the membrane pores, respectively and ks is generally one order of
magnitude greater than kv [10].Therefore, heat loss by conduction can be reduced by increasing the porosity.
MD heat transfer models are based on the assumptions of nonlinear temperature distribution across the membrane and non-isenthalpic flow of vapor [7]. Therefore, the total heat flux through the membrane is given by:
dx dT k NH
Qm TV m (2.19)
where HTV is the transporting vapor enthalpy at a temperature T, and x is the distance to the direction of vapor flux. Since the temperature inside the membrane in MD changes within a range of few degrees and assuming the condensation temperature of vapor T2 as reference temperature, the enthalpy at temperature T can
be written in the form:
T2 C
T T2
h
HTV v p (2.20)
where hv{T2} is the heat of vaporization measured at T2 and Cp is the specific heat of the vapor. Substituting equation (2.20) into equation (2.19) with separation of variables and integration yields:
NCs k
v p m Nh T T NC q 1 / 2 (2.21)2.4 Mass transfer
Mass transfer in MD is achieved by convective and diffusive transport of water vapor across the microporous hydrophobic membrane for which the driving force is the difference in water vapor pressure on either side of membrane. The possible mass transfer resistances in MD by using an electrical analogy are illustrated in Figure 2.2 [12]:
Figure 2.2 Mass transfer resistances in DCMD
The mass transport phenomena including two transportation steps [13]: (1) mass transport through boundary layers on both sides of membrane. (2) mass transport through the membrane structure.
2.4.1 Mass transfer in the boundary layers
It is often convenient to operate MD with pure water in order to minimize the boundary layers resistances to mass transfer. However, the presence of concentrated feed layer along the surface of the membrane can scientifically affect the global resistance to mass transfer. This phenomenon is called concentration polarization which results in reduction of the driving force across the membrane [18]. A mass balance across the feed side boundary layer gives the relationship between molar flux
membrane interface cm and at the bulk location cb: b m f C C k N ln (2.22) The boundary layer mass transfer coefficient kf can be obtained by experiments or be estimated using empirical correlation of dimensions less numbers like Sherwood (Sh), Reynolds (Re) and Schmidt (Sc) numbers. These empirical relationships and usually expressed in the form:
D Sc d D d k Sh with Sc b Sh f h h b m b b b 1Re , Re , 4 3 2 (2.23)
where dh is the hydraulic diameter, D the binary diffusion coefficient in the liquid, v the fluid velocity, the fluid density, the dynamic viscosity of the fluid. These correlations are still applicable for the case of a non-circular flow channel, by using equivalent diameter of the flow channel de defined as in [4]:
de 4S/Lp (2.24) where S is the cross-sectional area and Lp is the length of wetted perimeter of the flow channel.
2.4.2 Mass transfer across the membrane
Resistances to mass transfer within the membrane structure are three species [8]: (1) viscous or momentum resistance, due to transfer of momentum through the indirect contact with capillary walls via molecule-molecule collision terminating at molecule-wall collision.
(2) molecular resistance, from collision of a diffusing molecule with other molecules.
(3) Knudsen resistance, collisions between molecules and membrane walls.
A major difference among MD models which Modeling of mass transfer within the membrane pores was described in many experimental and theoretical studies found in the literature [4.6.7.11] is in the arrangement of the transport resistances in the circuit. In most cases, one or more of the resistances may be omitted. The vapor transport in
MD processes is related to the kinetic theory of gases. Accordingly, the vapor transport mechanism depends upon the mean free path length, which can be calculated based on the average process operating conditions (pressure and temperature), and the mean diameter of the membrane pores dp. The value of , defined as the average distance the molecule of diffusing species travels between two successive collisions, can be calculated from the kinetic theory of gases [15]:
2 2 B B P T k (2.25)
where kB is the Boltzmann constant (1.38110-23 J/K) and B is the collision diameter of the molecule. For the binary mixture of water vapor and air, the mean free path of water in air w-a may be evaluated at the average membrane temperature Tm as in using:
w a
w a
m B a w M M P T k / 1 1 2 / 2 (2.26)where w and a are the collision diameters for water vapor (2.64110-10 m) and air (3.71110-10 m) [16], and Mw & Ma the molecular weight water and air. The mean free path in the DCMD experiments at a typical operating temperature of 40oC calculated using equation (30) is 0.11 m. Compare the above equations, the mass transfer efficient will be reduced by the air trapped within the membrane pores.
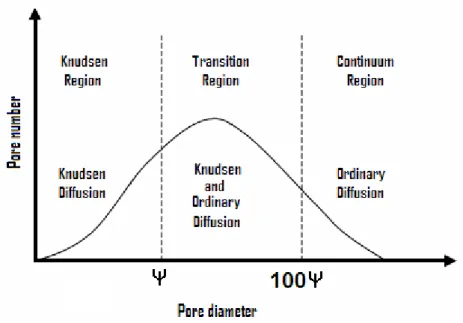
Generally, the mass transport across the membrane occurs in three regions as shown in Figure 2.3 [7]:
Figure 2.3 Mass transport regions and associated transport mechanisms with pore size distribution.
Mass transport regions including: (1) Knudsen region/ Knudsen diffusion; (2) Transition region/ Molecular diffusion; (3) Continuum region/ Poiseuille flow.
The predominance, coexistence or transition between all of three regions can be estimated by comparing the mean free path of the diffusing molecules to the mean pore diameter dp of the membrane [7].
In Knudsen region (dp < ), the molecule-wall collisions dominate over the molecule-molecule collisions and the mass transport mode is Knudsen diffusion.
In Transition region ( < dp < 100), mass transport takes place within the combination on Knudsen and ordinary molecular diffusion.
In Continuum region (dp > 100), the average membrane diameter is large compared to the free mean path of the vapor and the molecule-molecule collision are dominant. Thus, the transport mechanism is the classical viscous (Poiseuile) diffusion. In this region, the membrane pores may contain air. The presence of air in the pores hinders the diffusion of vapor and results in lower flux than the maximum achievable flux for the particular membrane and conditions.
Therefore, substantial increase in flux can be achieved by removing the air from the feed (de-aeration) or reducing the pressure of the liquids boundering the membrane (i.e. limiting the total vapor pressure in the pores) [15]. The basic models used to describe water transport in MD system relate the mass flux (N) to the driving force represented by the vapor pressure difference at both liquid-vapor interfaces, via proportionally coefficient (C) as in [4.11.17].
pTfm pTpm
C
N (2.27)
where p(Tfm) and p(Tpm) are the vapor pressure of transporting fluid at the membrane feed and permeate sides, respectively, and C is the membrane distillation coefficient which is a function of membrane physical properties ( pore size, porosity, thickness, and membrane pore tortuosity), transporting fluid physical properties (molecular weight and diffusivity), and operating temperature. There are mainly two different models that describe the vapor flux across the membrane; i.e. the Dusty-Gas Model (DGM) [4] and the model proposed by Schofield et al [11]. The DGM will be used in this study for its simplicity because it is based on the well-developed kinetic theory rather than the arguments required by the momentum transfer method. The complete form of the DGM takes into account surface, Knudsen and viscous diffusions. The DGM, without the surface diffusion, as the following expression [18-20]:
1 2 0 2 / 1 1 0 1 0 8 3 2 , 8 , 1 K r B r K M T R K D ID K D I T R B p X p T R D X p X p D X o i G o k e ij ij G o i V i i G n i j ij D j i D i j k e D i (2.28)where p the partial pressure, Mi the molecular weight, the vapor viscosity, r the pore radius, ε the membrane porosity, τ the membrane tortuosity and RG is the gas constant. Ko and Bo are constants that can be calculated based on membrane properties or obtained from gas permeation experimental data of non-condensable pure gas such
as hydrogen, helium or air.
The average pore diameter of the membranes used in this study was 0.2 m, and thus comparable to the mean free path of water vapor molecules (0.1 m at 40°C as calculated earlier). Therefore, the reduced Knudsen-molecular diffusion transition form of the Dusty-Gas Model (DGM) was applied for describing the vapor flux of pure water across the membrane [10]:
M p D p D D D RT N k w a a w a w k w avg 0 0 1 (2.29.a) with: M T R r Dwk a v g 8 3 2 (2.29.b) and Dw0 a 4.46 10 6 Tavg2.334 (2.29.c) where Dow-a is the pressure independent binary diffusion coefficient of water-air [21], Tavg is the average membrane surface temperature on the feed and permeate sides, and p, the partial pressure gradient of water through both membrane surfaces
generated by a temperature gradient and/or a concentration difference, is the driving force to mass transfer in DCMD.
References:
[1]. Reid, R.C., Prausnitz, J.M., and Sherwood, T.K. The properties of gases and liquids, 3rd ed.; McGraw-Hill: New York, 1997.
[2]. Atkins, P.W. (1990) Physical Chemistry, 4th ed.; Oxford University Press:Oxford.
[3] S. Bandini and G.C. Sarti. Heat and mass transport resistances in vacuum membrane distillation. AIChEJ, 1999, 45(7): 1422-1433.
[4] K.W. Lawson and D.R. Lloyd. Membrane distillation. II. Direct contact membrane distillation, J. Membrane Sci., 1996, 120: 123.
[5] B. Li and K.K. Sirkar. Novel membrane and device for direct contact membrane distillation-based desalination processes. Ind. Eng. Chem. Res., 2004, 43: 5300.
[6] Z. Ding, R. Ma, A.G. Fane. A new model for mass transfer in direct contact membrane distillation. Desalination, 2002, 151: 217.
[7] J. Phattaranawik, R. Jiraratananon, A.G. Fane. Heat transport and membrane distillation coefficients in direct contact membrane distillation. J. Membrane Sci., 2003, 212: 177. [8] A.O. Imdakm, T. Matsuura. Simulation of heat and mass transfer in direct contact membrane
distillation (MD): The effect of membrane physical properties. J. Membrane Sci., 2005, 262: 117.
[9] A. Gabelman, S.-T. Hwang. Hollow fiber membrane contactors. J. Membrane Sci., 1999, 159: 61.
[10] E. Curcio, E. Drioli. Membrane distillation and related operations - a review. Separation & Purification Rev., 2005, 34: 35.
[11] R.W. Schofield, A.G. Fane, C.J.D. Fell. Gas and vapour transport through microporous membrane. II. Membrane distillation. J. Membrane Sci., 1990, 53: 173.
[12] L. Martínez-Díez, M. I. Vázquez-González, F. J. Florido-Díaz. Study of membrane distillation using channel spacers. J. Membrane Sci., 1998, 144: 45.
[13] E. Drioli, E. Curcio, A. Criscuoli, G. Di Profio. Integrated system for recovery of CaCO3,
NaCl and MgSO4·7H2O from nanofiltration retentate. J. Membrane Sci., 2004, 239: 27.
distillation using asymmetric membrane. J. Membrane Sci., 2000, 173: 107. [15] R.D. Present. Kinetic Theory of Gases. McGraw-Hill, New York, 1958. [16] R.A. Albert, R.J. Silbey. Physical Chemistry, 2nd ed. Wiley, New York, 1997.
[17] L. Martínez-Díez, F. J. Florido-Díaz. Theoretical and experimental studies on desalination using membrane distillation. Desalination,2001, 139: 373.
[18] C.M. Guijt, I.G. Racz, J.W.v. Heuven, T. Reith, A.B.d. Haan. Modeling of a transmembrane evaporation module for desalination of seawater. Desalination, 1999, 126: 119.
[19] K.W. Lawson, D.R. Lloyd. Membrane distillation. J. Membrane Sci., 1997, 124: 1-25. [20] R.W. Schofield, A.G. Fane, C.J.D. Fell. Gas and vapour transport through microporous
membrane. II. Membrane distillation. J. Membrane Sci., 1990, 53: 159-171.
[21] R.H. Perry, D. Green, Perry's Chemical Engineers' Handbook, 6th Edition, McGraw Hill, New York, 1984.
![Table 1.2 Key operational data of thermal and membrane desalination technologies [ 5]](https://thumb-eu.123doks.com/thumbv2/123dokorg/2881568.10371/15.892.148.768.706.888/table-key-operational-data-thermal-membrane-desalination-technologies.webp)