e dell’Informazione “Guglielmo Marconi”
Dottorato in Bioingegneria Ciclo XXIX
09/G2 - Bioingegneria; ING-INF/06
AUTOMATIC COMPUTATION OF LIVER AND
LUNG PERFUSION PARAMETERS THROUGH
THE ANALYSIS OF CT IMAGE SEQUENCES
Silvia Malavasi
Coordinatore del corso di Dottorato
Prof. Elisa Magosso
Relatore
Prof. Alessandro Bevilacqua
Co-Relatore
Prof. Giampaolo Gavelli
Engineering “Guglielmo Marconi”
Doctorate in Bioengineering Cycle XXIX
09/G2 - Bioengineering; ING-INF/06
AUTOMATIC COMPUTATION OF HEPATIC AND
LUNG PERFUSION PARAMETERS THROUGH
THE ANALYSIS OF CT IMAGE SEQUENCES
Silvia Malavasi
Coordinator
Prof. Elisa Magosso
Tutor
Prof. Alessandro Bevilacqua
Co-Tutor
Prof. Giampaolo Gavelli
PhD course: January 1, 2014 - December 31, 2016 Final exam: May 12, 2017
Punta sempre in alto, male che vada
avrai camminato tra le stelle.
Prof. Claudio Lamberti, University of Bologna, Italy, email: [email protected]
External reviewer:
Prof. Val´erie Vilgrain,
Beaujon Hospital, Clichy, France, Paris 7 University, France,
IMAGE PROCESSING
SIGNAL ANALYSIS
QUANTITATIVE IMAGING
BIOMEDICAL IMAGING
MULTI-CENTRE STUDY
CANCER
Computed Tomography perfusion (CTp) is a functional imaging technique that has aroused a lively interest in oncology in the recent years mainly be-cause it is a very promising approach for early assessment of the effectiveness of the new anti-angiogenic therapies for cancer treatment. Nonetheless, some difficulties to achieve standardized, repeatable and reproducible results have slowed down its application in the daily clinical practice. This Thesis work ad-dresses three important issues that needed to be faced to advance CTp towards standardization: the lack of methods to measure the reliability of results, the clinical relevance of the global perfusion parameter values commonly utilised, a critical revision of protocols of the multi-centre studies, essential to assess CTp reproducibility. In this work, lung and liver CTp examinations have been considered, since they are among the most studied sites in oncology.
First, through a voxel-based spatio-temporal signal analysis, I set up an error index capable to measure the quality of perfusion results and validated it using examinations whose signals was degraded by different patient motion degrees. After proving the effectiveness of the index to detect unreliable perfu-sion values on single voxels, structured regions affected by noise (e.g. artefacts) or representing semantic patterns undesirable in CTp studies (e.g. vessels or bronchi) have been looked for on whole slices. Exploiting the voxel-based anal-ysis and the same error index, an adaptive algorithm developed on purpose has allowed detecting all those regions automatically, and to exclude their per-fusion values from either any subsequent processing or clinical consideration.
The common practice in CTp perfusion studies is providing one averaged value only for each perfusion parameter, computed on the whole tumour, with the main purpose of reducing the effects of data variability, but at the expense of tumour heterogeneity, a key feature that is neglected. Accordingly, whole lung lesions were considered to inquire into the clinical representativeness of global perfusion values. After removing all perfusion errors, and proposing a statistical index to quantify tumour functional heterogeneity, the use of one
European liver CTp multi-centre study. Some algorithms for signal enhance-ment to improve the accuracy of perfusion results were developed so as to make CTp examinations of different Centres more comparable. Some mean-ingful results regarding baseline and blood flow values of liver are reported and discussed, highlighting whether and to what extent different CT scanners affect CTp outcomes. Starting from an extensive analysis regarding the great number of differences in the actual execution protocols, acquisition parameters and information storing, tentative guidelines are provided to help considering all the concealable sources of heterogeneity in advance, before planning the multi-centre protocols.
La Tomografia Computerizzata perfusionale (TCp) `e una tecnica di imaging funzionale che negli ultimi anni ha suscitato un crescente interesse nel campo oncologico, in quanto ha dimostrato di essere una tecnica molto promettente per la valutazione precoce dell’efficacia delle nuove terapie anti-angiogeniche per il trattamento dei tumori. Ci`o nonostante, la sua applicazione nella pratica clinica `e stata rallentata a causa della difficolt`a nel conseguire risultati stan-dardizzati, ripetibili e riproducibili. Questa Tesi tratta tre importanti aspetti che dovevano essere affrontati per far avvicinare la TCp alla standardizzazione: la mancanza di metodi per misurare l’affidabilit`a dei risultati, la rilevanza clin-ica dei parametri perfusionali globali comunemente utilizzati in letteratura ed una revisione critica dei protocolli degli studi multicentrici, essenziali per la valutazione della riproducibilit`a della tecnica. Questo lavoro tratta esami TCp polmonari ed epatici in quanto fegato e polmone sono tra gli organi maggior-mente esposti all’insorgenza dei tumori.
Innanzitutto, attraverso un’analisi spazio temporale del segnale basata su singolo voxel, `e stato messo a punto un indice di errore in grado di misurare la qualit`a dei risultati perfusionali. Tale indice `e stato inoltre validato utilizzando esami i cui segnali apparivano alterati da differenti gradi di movimento del paziente. Dopo aver provato l’efficacia dell’indice nel rilevare singoli voxel associati a valori perfusionali non affidabili, sono state cercate su intere slice regioni affette da rumore strutturato, quali artefatti, o rappresentanti strutture fisiologiche, quali vasi e bronchi, normalmente escluse negli studi perfusionali. Sfruttando l’analisi orientata al voxel ed il medesimo indice di errore, `e stato sviluppato un algoritmo adattativo specifico che ha consentito di rilevare tutte quelle regioni in modo automatico e di escludere i loro valori perfusionali da qualsiasi successiva elaborazione o considerazione clinica.
`
E pratica comune negli studi TCp fornire un unico valore mediato calco-lato sull’intero tumore per ogni parametro perfusionale con lo scopo principale di ridurre l’incertezza dei dati ma con l’effetto secondario di trascurare la
rappresentativit`a clinica dei valori perfusionali globali, sono state considerate lesioni tumorali complete ed `e stato proposto un indice statistico in grado di identificare l’eterogeneit`a funzionale. Dopo aver rimosso tutti i valori perfu-sionali non affidabili, `e stato dimostrato come un unico valore globale non possa essere rappresentativo ed anzi, possa fuorviare le conclusioni cliniche.
Infine, l’ultima parte della Tesi riguarda le attivit`a portate avanti nel con-testo del pi`u ampio studio multicentrico europeo di TCp epatica. Innanzitutto vengono proposti diversi algoritmi sviluppati per il miglioramento del seg-nale e dell’accuratezza dei risulti perfusionali, cos`ı da rendere maggiormente comparabili gli esami TCp effettuati in Centri differenti. In seguito, vengono riportati e presentati alcuni interessanti risultati riguardanti i valori epatici di
baseline e di blood flow, discutendo quanto diversi scanner TC possano
even-tualmente influenzare la riproducibilit`a dei risultati perfusionali. A partire da un’analisi approfondita riguardante l’elevato numero di differenze riscon-trate nei protocolli effettivi di esecuzione degli esami TCp nei parametri di acquisizione e nella memorizzazione dell’informazione sono state infine fornite delle linee guida preliminari con lo scopo di aiutare a considerare in anticipo, prima della pianificazione dei protocolli multicentrici, tutte le possibili fonti di eterogeneit`a, comprese quelle implicite.
Abstract (English version) xiii
Abstract (Italian version) xv
Contents xvii
1 Introduction and Thesis overview 1
2 Background and state of the art 7
2.1 Tumour angiogenesis and imaging biomarkers . . . 7
2.2 Perfusion parameters in CTp . . . 11
2.2.1 The perfusion parameters . . . 15
2.2.2 Methods based on IDT . . . 17
2.2.3 Methods based on the PCM . . . 23
2.3 Clinical Application of CT perfusion in oncology . . . 30
2.3.1 Correlation of CTp parameters with tissue angiogenesis . 31 2.3.2 The use of CTp parameters in diagnosis . . . 31
2.3.3 The use of CTp in therapy monitoring and survival pre-dicting . . . 34
2.4 Open issues in CTp . . . 36
2.4.1 Lack of standardization . . . 36
2.4.2 Radiation dose and Acquisition parameters . . . 37
2.4.3 Repeatability and reproducibility . . . 38
2.4.4 The problem of motion . . . 40
2.4.5 Signal post-processing . . . 40
2.4.6 Methods and models to compute perfusion parameters . 41 2.4.7 The analysis of results . . . 43
3 Computation of CTp parameters 45 3.1 From image sequence to TCC . . . 45
3.1.3 The fitting model . . . 47
3.2 Goodness of fit: some error indexes . . . 51
3.2.1 Temporal error indexes . . . 52
3.2.2 Spatio-temporal error indexes . . . 57
3.3 Automatic error thresholding . . . 59
3.4 Quantitative assessment of perfusion local spatial coherence . . 65
3.5 Quantitative measurement of functional heterogeneity . . . 67
4 A method to assess perfusion values reliability 71 4.1 Background . . . 71
4.2 Validation of the temporal error index µϵ . . . 77
4.2.1 CTp examinations . . . 78 4.2.2 Acquisition protocol . . . 79 4.2.3 Image alignment . . . 80 4.2.4 Validation procedure . . . 81 4.2.5 Statistical analysis . . . 83 4.2.6 Experimental results . . . 84 4.2.7 Concluding remarks . . . 91
4.3 An automatic method to detect unreliable perfusion values . . . 92
4.3.1 CTp examinations . . . 93
4.3.2 Acquisition protocol and data processing . . . 93
4.3.3 Manual annotation . . . 93
4.3.4 Comparison between annotated slices and thresholded error masks . . . 94
4.3.5 Statistical analysis . . . 95
4.3.6 Experimental results . . . 96
4.3.7 Concluding remarks . . . 101
5 Multi-slice analysis of BF values 103 5.1 Background . . . 103
5.2 CTp examinations . . . 105
5.3 Acquisition protocol and data processing . . . 105
5.4 Statistical analysis . . . 106
5.5 Experimental results . . . 107
5.5.1 Baseline CTp . . . 107
6 PIXEL: a muti-centre study 115
6.1 The need for multi-centre studies . . . 115
6.2 Technical issues in multi-centre studies . . . 120
6.3 PIXEL data: early analysis . . . 123
6.3.1 The DICOM files . . . 124
6.3.2 The dataset . . . 125
6.3.3 Volume slices: number and thickness . . . 125
6.3.4 Pixel size . . . 126
6.3.5 Acquisition protocol and time information . . . 127
6.3.6 Tube current and voltage . . . 130
6.3.7 Radiation dose . . . 130
6.3.8 Administration of the contrast agent . . . 131
6.3.9 CT scanners . . . 132
6.3.10 Resuming of the acquisition parameters used in the dif-ferent Centres . . . 132
6.4 Assessment of image quality . . . 134
6.4.1 Frequency domain . . . 135
6.4.2 Temporal domain . . . 137
6.5 Some hints to set up of a CTp multi-centre study . . . 146
6.5.1 Planning phase . . . 147
6.5.2 Calibration phase . . . 148
6.5.3 Training of medical and technical staff . . . 148
6.5.4 Check of CTp examinations . . . 148
6.5.5 Data analysis . . . 149
7 PIXEL: a muti-centre study 151 7.1 Summary . . . 151
7.2 Early prototype of rigid registration algorithm . . . 157
7.3 Baseline . . . 170
7.3.1 TACs computing methods . . . 171
7.3.2 Baseline value computation . . . 172
7.3.3 Baseline algorithm: preliminary test . . . 177
7.3.4 Baseline values in a single Centre . . . 184
7.3.5 Multi-centre study of baseline values . . . 186
7.4.2 Dual input BF values in normal liver . . . 197
7.4.3 Multi-centre study on single-input BF values . . . 204
7.4.4 Multi-centre study on dual-input BF values . . . 207
7.4.5 Concluding remarks . . . 213 8 Conclusions 215 Appendix 219 List of Abbreviations 223 List of figures 227 List of tables 233 Bibliography 235
Introduction and Thesis
overview
Cancer is among the leading causes of death worldwide [1]. Only in Italy, the Italian Association of Cancer Registries (AIRTUM) has forecasted 365000 new tumour diagnoses in 2016 alone (i.e., about 1000 subjects per day) [2]. In particular, over the world the most common site of diagnosed cancer is lung, followed by breast and colonrectum [3]. Lung cancer is also the most common cause of tumour death [4], followed by liver cancer [3]. A peculiarity of this last kind of tumour is that, in the liver, metastatic cancers are more common than primary cancers. For instance, the liver is the most common site of metastasis from colorectal cancer (CRC) [5].
In the last few years, the worldwide risk of dying from cancer is globally decreased [6]. This improvement is also attributable to the introduction of the new anti-angiogenic therapies that, administered in combination with con-ventional chemotherapy (i.e., cytostatic drugs) and radiotherapy, have shown to increase patients survival in several cancer types [7]. Differently from con-ventional anti-cancer therapies, the effects of anti-angiogenic treatments are visible earlier on tissue functional behaviour (i.e., the vascular network of the tumour) and only later in time on morphology [8]. As a result, a lively interest has aroused around new perspective biomarkers, useful to monitor the sta-tus of tissue neovascularization and to evaluate the effects of anti-angiogenic therapies.
Computed Tomography perfusion (CTp) is an imaging technique that thanks to its wide availability, low invasivity, and capability to provide images with a high spatio-temporal resolution, results to be one of the most promising methodologies for the earlier assessment of the efficacy of the anti-angiogenic
therapies [9]. Through the analysis of the CTp sequences acquired, it is possi-ble to compute perfusion parameters owing information regarding tissue vas-cularization. In particular, these perfusion parameters have shown to be useful to evaluate tumour neovascularization, characterize and differentiate tissues, monitor anti-angiogenic therapies, and predict patient survival in several can-cer types [8, 10].
Despite the high potential shown by CTp in both cancer diagnosis and prognosis, there are still some open issues that have prevented the use of this technique in the standard clinical practice [8]. In this Thesis, I focus my attention on three topics related to the keywords reliability, standardization, and reproducibility of perfusion results. The first issue regards the lack of methods to evaluate perfusion results’ accuracy and to detect the presence of non-systematic errors. In the literature, all the perfusion values achieved have always been considered reliable, even when affected by errors (e.g. caused by the presence of noise or artefacts), this constituting an obstacle for the achievement of repeatable perfusion results. The second issue is related to the low reproducibility of perfusion values, mainly caused by the huge amount of variability sources affecting CTp data and results. To face this problem, many authors have used global perfusion parameters, often computed as the average of voxel-based perfusion values found on a single tumour section or on the whole tumour. However, the higher reproducibility achieved by global values with respect to voxel-based ones is due to the averaging operation, that reduces sensibility of results to all the variability sources, tissue heterogeneity included, this weakening, if not jeopardizing the clinical relevance of results. The third and last issue regards the lack of standardization in both the acquisition and data processing protocols. This problem has been an obstacle to the set-up of multi-centre studies which are fundamental to introduce an imaging technique as a standard to be used in the clinical routine. Actually, the huge amount of inhomogeneities between data has even prevented the evaluation of perfusion values reproducibility computed on examinations acquired by using different Computed Tomography (CT) scanners.
The goal of my PhD activities was to face these issues to allow improv-ing the CTp techniques to come to a more and more quantitative imagimprov-ing (Chapter 3). In particular, the first issue has been faced by developing an automatic method to identify and exclude from the analysis those perfusion values computed on data particularly affected by noise or artefacts and thus considered to be unreliable. To this purpose, a fine-to-coarse strategy has been developed, which starting from the quantitative analysis of the signal coming
from the single voxel, was extended first to the single tumour section (Chap-ter 4) and finally to the whole lesion (Chap(Chap-ter 5). This technique, that has been applied to CTp examinations acquired in the same Centre and pertaining to patients with liver and lung cancer, permitted to obtain better perfusion results (i.e., more reliable and repeatable) on which drawing clinical evalua-tions. The second issue has been faced by carrying out a deep analysis about the representativeness of global perfusion values used in the literature. To this purpose, a three step statistical analysis has been carried out to evaluate the representativeness of tumour and single section global perfusion values. In addition, an indicator of tumour functional heterogeneity has been proposed to evaluate whether perfusion values equivalences found out with statistical tests were numerical only or also owned a clinical significance (Chapter 5). The third issue was faced by deeply analysing data coming from the first CTp multi-centre study on liver and by carrying out a preliminary perfusion analysis. Through the analysis of the almost 400 examinations acquired in 15 different Centres, it was possible to identify all the intra- and inter-centre sources of variability affecting CTp data (and outcomes, accordingly) and to provide a sort of guidelines to correctly set-up this kind of studies (Chapter 6). In addition, data of different Centres acquired by using the same acquisition protocol were analysed to evaluate whether the use of different CT scanners could affect perfusion results (Chapter 7).
Besides the present introductory Chapter, this Thesis is organized in seven Chapters, all treating different aspects of the same matter. Accordingly, the experimental results are presented in Chapters 4, 5, 6, 7, pertaining to the specific topic of the related Section. The content of this Thesis is organized as follows:
• Chapter 2 contains the background and the state of the art regarding the
use of CTp in oncology. Starting from the description of angiogenesis (i.e., the key process driving tumour growth), it is possible to under-stand the increasing need for the assessment of anti-angiogenic therapies efficacy and why dynamic contrast enhanced (DCE) imaging techniques have become so important in oncology. A comparison between different DCE techniques is carried out to motivate why CTp represents one of the most suitable techniques for the evaluation of therapies‘efficacy and of cancer’s diagnosis and prognosis. Then, a summary of the main clin-ical results achieved through the analysis of CTp perfusion parameters is reported, with particular attention to lung cancers and liver tumours.
Finally, the most relevant open issues still delaying the use of CTp in the clinical practice are discussed.
• Chapter 3 starts going into the matter of this Thesis work and presents
the main methods used to process and analyse temporal tissue signals. First of all, a discussion about the strategies selected to post-process CTp images and the extracted voxel-based signal which perfusion parameters are computed on is reported. Four temporal error indexes to evaluate the signal quality are then proposed and compared, motivating the reasons standing behind the choice of the error index selected for our studies. After that, two different methods to automatically find out a cut-off value between “good” signals and “bad” signals are presented. Finally, an index to assess tumour functional heterogeneity is proposed.
• Chapter 4 describes the analysis that has been carried out first on the
sig-nal of single voxels and, subsequently, on tumour sections. In particular, the temporal error index selected in Chapter 3 is validated as a marker of perfusion values unreliability. This has been done by exploiting signals of a different known quality that were achieved by building four different sequences for each patient, according to as many alignment methods for motion correction. Therefore, the analysis of CTp voxel-based signals has been shifted to slice level. The two automatic thresholding methods presented in Chapter 3 have been applied to the error values computed on the signals of whole tumour sections so as to find out the unreliable voxels to be excluded from the analysis. In particular, this procedure has shown to be able to automatically detect and exclude all those structures (e.g. bronchi, vessels, and artefacts) usually jeopardizing qualitative and quantitative perfusion analysis.
• In Chapter 5, the analysis carried out on the single tumour section has
been extended to the whole lesion. A deep study regarding tumour het-erogeneity representativeness of global and single-slice perfusion values used in the literature is carried out. In particular, the error and per-fusion parameters are computed on each slice of the tumour, as well as the index presented in Chapter 3 and representing the tumour functional heterogeneity. Then, a three step analysis is carried out. First of all, the representativeness of the global perfusion values computed on the whole lesion with respect to those computed on the single slices was evaluated to verify whether and to what extent, the use of global perfusion values
could be representative of tumour single section. After that, the equiv-alence between perfusion of different sections of the same tumour was evaluated to verify to what extent single tumour sections could be rep-resentative of the whole tumour. Finally, spatial perfusion distribution is compared in tumours having the same global perfusion value to assess whether the use of one perfusion value computed over the whole tumour could be effective in clinical decision making.
• Chapter 6 deals with the analysis of data collected in the first CTp
multi-centre study on liver. All the standardization issues related to the acquisition protocol are analysed as well as the intra- and inter-centre variability sources that could affect perfusion analysis. In particular, the implication of using different CT scanners or the variability introduced by different operators are discussed. Besides that, a quality image anal-ysis of the CTp sequences acquired in different Centres is carried out for an early assessment of the possible inhomogeneities introduced by differ-ent CT scanners or acquisition parameters. Finally, a draft of possible guidelines regarding how a CTp multi-centre study should be carried out is presented.
• Chapter 7 describes all the methods that have been implemented to
improve data and perfusion computation of multi-centre examinations to evaluate how the use of different CT scanners affect perfusion results. In particular, the algorithm to compute perfusion has been improved and adapted to the analysis of CT examinations of normal liver. An algorithm for liver ROIs registration on CT images has been implemented in its early stage. In addition, a method to correctly compute baseline values (i.e., the tissue density value before the arrival of contrast agent), which are of a fundamental importance to achieve accurate perfusion values has been developed and tested against the most common methods used in the literature. After that, baseline values of examinations acquired in different Centres have been computed and compared to evaluate whether and to what extent the use of different CT scanners affects baseline values. Finally, tests on perfusion values computed on patients of a single Centre and of different Centres have been carried out to assess and analyse single and dual-input hepatic perfusion values in patients with CRC and to evaluate whether the use of different CT scanners affects the computed results.
• Concluding remarks and hints for possible future works are reported and
discussed in Chapter 8.
The work developed in this Thesis has been carried out within the:
• Computer Vision Group (CVG), Advanced Research Center on
Elec-tronic Systems (ARCES), University of Bologna, Italy. Director: Prof. Alessan-dro Bevilacqua
in partnership with the following institutions:
• Diagnostic Imaging Unit, Istituto Romagnolo per lo Studio e la cura dei
Tumori (IRCCS-IRST), Meldola (Forl´ı-Cesena), Italy. Director: Dr. Domenico Barone
• Department of Radiology, Beaujon Hospital, Clichy, France, Director:
Prof. Val´erie Vilgrain
The activities discussed in this Thesis pertain to two projects:
• PERFECT - Automatic analysis of hepatic and lung PERFusion through
the usE of CT-4D image reconstruction
• PIXEL - Perfusion IndeX: Evaluation for Liver metastases
In particular, I spent the first two years to implement and validate the error indexes and the thresholding methods presented in Chapter 3 and discussed in Chapter 4 that permitted to achieve reliable perfusion values. During the second year I also started working on the analysis regarding the representa-tiveness of global perfusion values often adopted in the literature with respect to tumour heterogeneity. Instead, during the last year I mainly focused my attention on data regarding the multi-centre study and carried out analyses and experiments presented in Chapters 6 and 7 to evaluate whether the use of different CT scanners affects the outcomes of perfusion examinations. The methods developed and the results obtained have been partly published in four scientific journals, five international and four national conference proceedings. In addition, they have been also presented in three oral communications.
My 3-year PhD programme in Bioengineering was granted by the Italian Minister of Education, Universities and Research (in Italian, MIUR).
Background and state of the art
Tumour angiogenesisis is the hallmark of cancer capability to develop and metastasize. In the last few years, several tumour anti-angiogenic drugs have been developed, arousing interest around minimally invasive imaging tech-niques that have shown promising capability to assess the effects of these new therapies. CTp is one of the imaging techniques mostly investigated to this purpose. The analysis of the signal that can be extracted from each tissue voxel of the CT image sequence allows the computation of perfusion parameters con-nected to tissue angiogenesis. Despite the clinical usefulness of CTp has been demonstrated in several studies, some open issues prevent its application in the clinical practice.
In the next paragraphs of this Chapter, all these aspects will be taken into account and discussed to allow a better understanding of this PhD Thesis work.
2.1
Tumour angiogenesis and imaging
biomark-ers
The term “angiogenesis” is used to describe the process of new vessels for-mation that is essential for the embryologic development, the normal tissue growth, and tissue reparation [11]. Angiogenesis regularization happens at a molecular level and is driven by several factors, the principal of which is the vascular endothelial growth factor (VEGF) [12].
Some pathologies, such as cancer, are able to interfere with the cellular an-giogenesis regularization factors giving origin to abnormal vascular networks. Gene mutations inside tumour cells indeed, cause the release of new
regular-ization factors that perturb the regular angiogenesis process [13] entailing the creation of new vessels that are more dilated, tortuous, and permeable than the normal ones [14]. Moreover, the coexistence of multiple cancer genetic subpopulations provokes variable degrees of neovascularization in different tu-mour types [15]. All these features contribute to improve the degree of tutu-mours heterogeneity that has a deep influence on lesion’s growth and response to anti-cancer therapies (i.e., chemotherapy, radiotherapy, and immunotherapy) [14, 16].
Angiogenesis has become the hallmark of tumour capability to develop and metastasize and the target for the production of new anti-cancer thera-pies [17]. Anti-angiogenic drugs able to inhibit vascular tumour growth (i.e., anti-VEGF) have been then widely developed in the last few decades [7]. The administration of these therapies also in combination with conventional chemotherapy and radiotherapy have shown to increase patients survival for several cancer types. A positive impact on patients overall survival (OS) and progression-free survival (PFS) has indeed been found in cancer of the lung [18, 19], liver [20, 21], colon-rectum [22, 23], kidney [24, 25], breast [12, 26], and ovary [27, 28]. Despite these encouraging results, there are also some studies that did not observe any significant improvement in survival due to anti-angiogenic drugs administration. This is the case of breast cancer [29] and CRC [30, 31]. Moreover, there are some tumour sites such as pancreas, prostate, and skin in which anti-angiogenic therapies have only a limited im-pact on OS [32]. Several studies have thus been carried out to try understand-ing the mechanism which anti-angiogenic drugs are based on and improvunderstand-ing their efficacy accordingly [33, 34]. At the beginning, it was hypothesized that anti-angiogenic agents would have destroyed tumour vessels, depriving can-cer from oxygen and nutrient necessary to its growth [35, 36]. However, this would have also prevented drugs to reach the tissue, this yielding an increasing tumour hypoxia, a well-known marker of poor response to therapies [37] and patient OS [38]. Further on, it was found that anti-angiogenic drugs act as a vascular normalization factor, remodelling the network of vessels to a normal vasculature, hence permitting a higher drug delivery [33]. Anyway, the mech-anism by which the anti-angiogenic therapies are able to improve survival over chemotherapy alone is still not fully clear [39].
The development of anti-angiogenic drugs brings about the need for biomark-ers able to evaluating the status of the tissue neovascularization process and to monitoring the effects of anti-angiogenic therapies. The most widely used methods to assess the efficacy of chemoterapeutic agents are the Response
Evaluation Criteria in Solid Tumour (RECIST) [40] and RECIST 1.1 [41], be-sides the World Health Organization (WHO) criteria [42]. All these criteria are uniquely based on the evaluation of changes on lesions number and size, by measuring the long-axis of the lesion in one (in case of RECIST or RECIST 1.1) or two (in case of WHO) dimension. Anyway, due to their non-cytotoxicity, the anti-angiogenic drugs aim at normalizing the vascular network of cancers without necessarily influencing tumour size and affect morphology quite a long time after functional changes happened [8]. This is the reason why the con-ventional criteria characterizing treatment response may not be effective and there is a need for new and more effective biomarkers [15, 43].
The invivo biomarkers that can be used to evaluate angiogenesis can be of two types: direct or indirect ones [44, 45]. An ideal direct biomarker would be the microvessel density (MVD) that has shown a good correlation with poor prognosis and tumour metastases [46]. However, biopsy requires taking a tissue sample, an invasive procedure of limited applicability and effectiveness to provide a direct measure of biomarkers. In fact, due to its invasiveness, biopsy cannot be used with the frequency needed to monitor angiogenesis and to assess therapies effects [47]. In addition, only a very small portion of tissue is analysed,thus making biopsy prone to error sampling and inter-observer variability and not suitable for the analysis of highly heterogeneous tissues, accordingly [48]. The need of more appropriate and accurate biomark-ers aroused interest towards indirect biomarkbiomark-ers, in particular derived from DCE imaging techniques, which are able to provide perfusion parameters cor-related to the tissue vascular characteristics. DCE imaging techniques are indeed non-invasive methods able to assess the microcirculatory function of the investigated tissues [49, 50] and the tumour response to therapies, earlier than permitted with techniques based on morphological changes only [8]. All the DCE imaging techniques are based on the same principle, that is the mea-surement of tissue and vascular enhancement over time obtained by acquiring images of the same sample before, during, and after the administration of a contrast agent (CA). Finally, the application of apposite kinetic models, and methods, on the signal extracted from the images allows computing perfu-sion parameters [51]. More details regarding the perfuperfu-sion parameters and the methods used for their computation are provided in Sects. 2.2.1 and 2.2.2, respectively.
The main DCE imaging techniques that have been used in the characteri-zation and assessment of tumour angiogenesis are:
• DCE CT
• DCE magnetic resonance imaging (MRI) • DCE ultrasound (US)
• Positron-emission tomography (PET)
The main features of these imaging techniques are resumed in Table 2.1.
Dynamic imaging techniques
Technique Morphologic Functional Availability Cost Other features information information
DCE-CT Very good Very good High Medium
Exposure to ionizing radiation Toxicity of CA
Attenuation proportional to CA concentration DCE-MRI Very good Very good Low High Versatility in pulse sequences
DCE-US Medium Good Very high Low Highly operator dependent Limited depth of penetration PET Very bad Good Very low High
Radiation exposure High toxicity of CA
Emission proportional to CA concentration
Tab. 2.1: Main features characterizing the most used functional imaging tech-niques.
DCE-CT is undoubtedly one of the most used imaging techniques for an-giogenesis evaluation. The main strong point of this technique is its capability of providing high spatial-temporal resolution data, this favouring the achieve-ment of high quality morphological and functional information [9]. Moreover, the wide availability and the low-cost of this technique has fostered its spread and use [49]. Despite its lower availability and higher costs, DCE-MRI is an-other widely used technique. Similarly to DCE-CT, DCE-MRI provides very high spatial-temporal data, but without exposing patients to ionizing radia-tions [52]. Nonetheless, DCE-MRI is a highly versatile technique since it allows choosing between several pulse sequences. As drawbacks, this methodology re-sults to be very complex and the signal provided is not directly proportional to CA concentration inside tissue [9]. Another used imaging technique is the DCE-US. This low-cost and widely available technique also provides functional information without releasing any ionizing radiations [52]. However, besides suffering from intra- and inter-observer variability, DCE-US suffers from tech-nical limitations such as the low depth of tissue penetration and a lower quality
of the morphologic information provided [53]. As regards nuclear medicine, one technique used is PET, that is high sensitive to signal variations even with very low quantities of CA, is capable to provide metabolic information and provides a signal that is directly proportional to the concentration of CA inside tissue. Nevertheless, this technique has many drawbacks such as high cost, radiation exposure, technical complexity, and lack of morphological information [9]. In addition, differently from the imaging techniques previously discussed, PET does not directly investigate the vascular system. This causes in some cases apparent divergent assessments of tumour physiology with respect to perfu-sion parameters obtained using DCE-CT, DCE-MRI, or DCE-US [54]. To overcome some of the above mentioned drawbacks, the use of combined PET and DCE-CT is discussed in the literature more and more frequently. In fact, joining together morphological and functional information of DCE-CT with metabolic one provided by PET, it is possible to gather these complemen-tary information in one, very effective, tool [55]. However, the very long time needed for examinations and the extremely high costs [16] limit its use.
2.2
Perfusion parameters in CTp
Perfusion has been defined as the transport of blood to a unit volume of tissue per unit of time [56]. The first publication regarding the use of DCE-CT to quantify perfusion (i.e., CTp) dates back to 1980 [57]. In that study, the au-thor proposed for the first time a method to compute the blood flow (BF ) of the brain in healthy patients. However, in those years both image acquisition and data processing were too slow to allow the technique to become widely accepted. At the beginning, CTp has been used only in perfusion studies of the myocardial and the kidney [51]. The turning point arrived with the in-troduction of two technical innovations: the use of multiple detector rows and of slip rings. The former allowed improving the z -coverage of the analysed tissue for each gantry rotation [58], while the latter allowed continuous rota-tion of the x-ray tube by removing all the fixed connecrota-tions of the rotating components. These innovations permitted faster image acquisitions and the introduction of the helical (or spiral) scan mode. Differently from the “classic” acquisition modality (the axial mode), where the image acquisition occurs in static conditions, in the helical scan mode the patient table is continuously moved while the image acquisition goes on, allowing the acquisition of a tis-sue volume rather than separate tistis-sue slices [59]. The spread of CT systems
equipped with multiple detector rows and slip rings allowed the diffusion and the use of CTp in several diseases with particular success in acute stroke and oncology [54].
To enable the computation of perfusion parameters, CTp relies on four principles:
• the repetition of image acquisition of the same tissue portion • the administration of a “short and sharp” bolus of iodinated CA • the selection of at least one vessel supplying the analysed input
• the application of proper methods and kinetic models to extract signal
and compute perfusion parameters
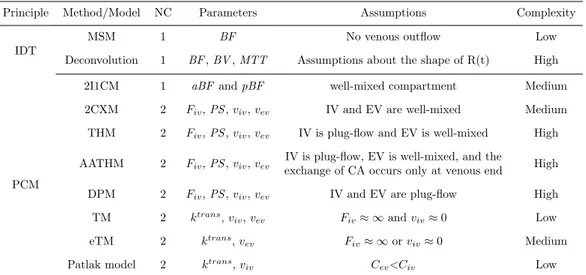
The repetition of image acquisition of the same tissue portion before, during, and after the administration of CA shows the attenuation changes caused by CA arrival which are related to tissue perfusion [60]. In particular, by using a iodinated CA the tissue attenuation changes are directly proportional to CA concentration inside tissue that are thus easily measurable [61]. At the beginning, tissue contrast enhancement is mainly due to the arrival of CA in the intravascular (IV) space. As time goes on, CA gradually moves by passive diffusion from the IV to the extravascular (EV) and the extracellular spaces, and the tissue contrast enhancement is due to the presence of CA within both the blood vessels and the interstitial space [13]. These two phases can be observed in the tissue signal that can be extracted from the CTp image sequences. By placing a region of interest (ROI) on the analysed tissue, it is then possible to extract a time concentration curve (TCC) from each voxel of the ROI. Therefore, this time signal is composed by the density values, expressed in Hounsfield Units (HU), assumed by a specific voxel of the ROI in different time instants. Since the HU values are directly proportional to the quantity of CA within the IV and the EV space of a voxel in a specific time instant, the shape of the TCCs reflects the passage of CA inside tissue [62].
CA has to be administrated in a small quantity and at a high flow rate in order to obtain a “short and sharp” bolus [63], needed to allow a more accurate computation of perfusion parameters [61]. Moreover, the increase of the iodine delivery rate helps reducing the dose and, in case of organs with a dual blood supply (e.g liver and lung), permits to better identify the two tissue enhancement portions of the signal caused by CA bolus coming from the two different vascular input [64].
The third requirement of CTp is the selection of at least one vessel nour-ishing the analysed tissue. By placing a ROI inside the selected input vessel (usually an artery such as the aorta), and by averaging the density values in-side the ROI of each acquisition time instant, it is possible to obtain a single TCC that will be “compared” with the tissue TCCs in order to compute perfu-sion parameters [8]. Several recommendations about the correct choice of the input vessel and the positioning of the ROI have been made in the literature. The selection of a feeding vessel big enough to prevent partial volume effects causing the underestimation of the input signal, is highly recommended [63]. Moreover, originally it was suggested to place the arterial ROI as close as pos-sible to the analysed tissue in order to reduce time delay effects and achieve more accurate perfusion parameters. However, recently several algorithms have been developed in order to correct for this delay and this requirement is thus not so mandatory [65]. In organs characterized by a dual-input blood supply such as liver and lung, it is possible to place a ROI on each vascular input. This means that in the liver it is possible to draw a ROI on the aorta (or on an hepatic artery) and one on the portal vein [8], while in the lung it is possible to place one ROI on the aorta and a second one on a pulmonary artery [66]). In Figure 2.1, there is an example of the ROIs that can be drawn
Fig. 2.1: A liver CTp image with ROIs placed on aorta (in the red colour), portal vein (in the blue colour), and spleen (in the green colour) (a) and the averaged TCCs extracted from each ROI (in the same colours) (b).
in the liver in order to consider a dual vascular supply. In these organs, the use of a single input instead of two means assuming that the tissue vascular supply is predominantly arterial and accepting that a systematic underesti-mation of perfusion values occurs (as it is reported in [67] for the lung and in [68] for the liver). The use of two input allows improving the
reproducibil-ity of perfusion results, the characterization of tissues, and the assessment of treatment response. Indeed, in a study of 7 patients with liver tumours it was observed that perfusion results obtained by using two input were more repro-ducible than those computed by considering a single input only [68]. Moreover, the computation of perfusion parameters achievable only by considering two vascular input allowed to differentiate malignant and benign lung lesions [69] and to distinguish hepatic tumour from normal liver tissue [70, 71]. Perfusion parameters achieved with dual-input were also used by Ohno et al. in order to predict response to chemio and radiotherapeutic treatments and the OS of 53 [72] and 66 [73] patients with non-small cell lung cancer (NSCLC). Or else, by analysing these parameters, Wei-Fu et al. [74] found a threshold value able to predict patient survival after therapies administration. However, the possi-bility to consider a dual-input blood supply in the perfusion analysis strictly depends on the z -coverage of the CT system and on the acquisition protocol adopted. Indeed, as reported in [75] for liver and in [76] for lung, by using a narrow volume coverage or an inappropriate field of view (FOV), it is not always possible to acquire in the same image both the tissue being studied and the two vascular input. If the two input vessels are not present in the CT images, one input only has to be considered.
The last principle which CTp is based on is the application of apposite kinetic models and methods to the arterial and the tissue TCCs in order to compute perfusion parameters [52]. All the models applied assume that the tissue behaves as a linear and time-invariant system. This means that the output of the system (i.e., the tissue) to multiple stimuli (i.e., the arrival of CA bolus from different input) is equal to the sum of the tissue response to the single stimuli separated. Moreover the response of the system is considered constant in time, independently from the time instant in which the stimulus is applied. On the base of these assumptions, two different theoretical concepts on which the models and the methods to compute perfusion parameters are based, have been developed [61]: the indicator dilution theory (IDT) and the pharmacokinetics compartment models (PCM).
In the next paragraph (Sect. 2.2.1), a summary of the physical and bio-logical meaning of the main used perfusion parameters is reported. Instead, Sects. 2.2.2 and 2.2.3 report the principal methods and models used to compute perfusion parameters on the base of IDT and of PCM principles.
2.2.1
The perfusion parameters
CTp permits the calculation of several perfusion parameters, depending on the kinetic model or method applied to the signal. By assuming that CA does not diffuse from the IV space (i.e., modelling tissue as a single-compartmental model) it is possible to measure the BF , the blood volume (BV ), and the mean transit time (MTT ). On the contrary, by assuming that CA can join the EV space (i.e., apply a model with more than one compartment) it is also possible to assess the permeability surface (PS ), the extraction fraction (EF ), and the ktrans. The way by which each of these parameters is related to the pathology features of tumour angiogenesis and to the effects that the anti-angiogenic drugs have on the vascular network is complex [8]. In this paragraph, the main quantitative perfusion parameters used in literature are summarized as well as their physical meaning and how they are supposed to enable the assessment of tumour angiogenesis and the evaluation of tumour response to therapies.
BF has been defined as the transport of blood to a unit volume of tissue
per unit of time and is expressed in ml/min/100ml or in ml/min/100g [52]. Its value tends to increase with the increase of MVD [60]. In organs characterized by a dual vascular supply, it is possible to compute BF values separately for the two contributions. For instance, in the liver there are the arterial BF (aBF ) and the portal BF (pBF ) while in the lung there are the bronchial BF and the arterial BF . The total BF value can then be achieved as the sum of the two partial BF values and a perfusion index (PI ) can be computed to quantify the influence of the two blood supplies over the total BF [77].
BV measures the volume of blood flowing in the tissue, including blood
in-side arteries, arterioles, capillaries, venules and veins. BV is usually measured in ml/100ml or ml/100g [52]. As BF , the BV value increases with higher MVD [60].
MTT represents the mean time taken by the blood to transit through the
tissue vascular network (from arteries to veins) and it is expressed in seconds (s) [60]. This parameter is not directly extracted from the kinetic models, but it is derived from BF and BV values (see Sect. 2.2.2).
PS measures the product between the permeability and the total surface
of the capillary endothelium in a unit mass of the tumour and is expressed in
ml/min/100 ml [78, 79]. As reported in Sect. 2.1, abnormal vessels generated
after a gene mutation show a poorly formed vascular basement membrane characterized by a high permeability [14].
EF has the same unit of measure as PS , but it represents the fraction of
CA arriving at the tissue that leaks into EV space in a single passage through the vasculature. Like PS , EF is directly related to the permeability of the analysed vessels to CA [78, 79].
Finally, ktrans is the constant flow rate of CA from IV to EV space and is
expressed in min−1 [78, 80].
The combination of these parameters allows making important evaluations about the analysed tissues. For instance, the increase of BF and BV values can point out the presence of newly formed vessels if PS assumes high values, or the presence of mature vasculature if PS value is normal or low. On the contrary, low BF and BV values can indicate the presence of necrosis or inflammation, whether they are coupled with low or high PS values, respectively [81].
All these parameters are usually represented through the use of colorimetric perfusion maps, such as that reported in Figure 2.2 (c) together with a full
Fig. 2.2: Lung CTp image (a), the lesion magnified (b), and relative BF colori-metric map (c).
slice (a) and the magnified lung lesion (b). Here, blue colours are used to highlight the regions with the lowest perfusion while red colours indicate the highest perfused areas. Instead, the pink colour is used to point out unreliable
BF values (Sect 4.2). This way of visualizing results is particularly useful since
it permits a first visual analysis of the perfusion parameters and the assessment of spatial correlation and functional heterogeneity.
Another category of perfusion parameters providing semi-quantitative mea-sures exists and are sometimes adopted in perfusion studies. For instance, the “area under the curve” (AUC) is related to BF and the quantity of CA admin-istered, and it is computed as the integral of the tissue TCC. Also, the “peak enhancement” is connected to BV and corresponds to the peak of the tissue
TCC, while the “time to peak” is related to BF and represents the lag between CA administration and the peak enhancement [82]. However, these measure-ments are very sensible to differences in iodine sensitivity of CT systems and depends upon several factors such as the arterial input function, patient’s cen-tral hemodynamics, and their weight [83]. Quantitative measurements such as those discussed above are consequently often preferred.
2.2.2
Methods based on IDT
IDT considers tissue as a “black box” and consequently analyse the system without making any morphological or physiological assumption [84, 85]. In general, the output of a system can be described by the convolution between the input function and the impulse response function of that system. By con-sidering the organ or the tissue investigated as the system, its input and output functions correspond to the concentration of CA in the arterial inflow Ca(t) (in
mg/ml ) and the venous outflow Cv(t) (in mg/ml ), respectively. Instead, h(t)
is the probability density function of CA particles and, in practice, represents the distribution of transit times required by the molecules of CA to move from the entrance to the exit of the system, by whatever path. The relation between
Cv(t) and Ca(t) can thus be described as in Eq. 2.1:
Cv(t) = h (t)⊗ Ca(t) =
∫ ∞
0
h (t− τ) Ca(τ ) dτ (2.1)
Since, for the principle of mass conservation, all tracer particles entering the system sooner or later leave it, the AUC of h(t) is unitary, as reported in
Eq. 2.2: ∫
∞
0
h (t) dt = 1 (2.2)
Moreover, since h(t) is the frequency function of transit times, by definition,
MTT is given as its first moment, as described in Eq. 2.3 [61]: M T T =
∫ ∞
0
th (t) dt (2.3)
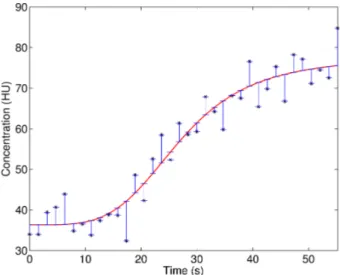
However, since usually there are no a-priori information about the vascular network, h(t) is unknown and MTT cannot be computed directly from Eq. 2.3. In the particular case of a system with a single input and a single output, as that depicted in Figure 2.3, it is possible to apply the Fick principle, describing the law of mass conservation. In particular, the Fick principle states that Q(t),
C
a(t)
C
v(t)
Biological
system
Fig. 2.3: Outline of a single input and single output mono-compartmental model.
the rate at which the quantity of CA (expressed in mg) accumulating in an organ at any time t, depends on the organ BF , Ca(t) and Cv(t) [47], and it is
described by Eq 2.4:
dQ (t)
dt = BF · Ca(t)− BF · Cv(t) (2.4)
However, venous outflow cannot be correctly measured by DCE imaging tech-niques since the outflow vessels are too small if compared with the spatial resolution of CT scanners. The measurement of Cv(t) would then be an
un-derestimation of its true value, due to partial volume effect [61, 86]. Therefore, since the use of DCE imaging techniques only permits to measure regional BF within a tissue or an organ, the Fick principle has to be reinterpreted. In par-ticular, Q(t) is the mass concentration of CA in tissue (expressed as percentage in mg/g) and BF is the specific BF of that tissue (in ml/min/g).
In order to compute BF parameters, two methods exist. While the first one is based on the use of an additional assumption, the second one directly faces the convolution problem through the use of Eq. 2.1. Both these methods are presented below.
After the injection of CA, there is a period of time during which CA remains inside tissue. During this period, it is possible to make the assumption of no venous outflow (i.e., Cv(t) = 0), and this is the assumption which the first
method is based on to compute perfusion parameters. Hence, Eq. 2.4 can be rewritten as follows:
dQ (t)
dt = BF · Ca(t) (2.5)
and consequently, assuming that the rate of tracer accumulation is maximal when the arterial concentration is maximal, we can write Eq. 2.6:
[ dQ (t) dt ] M ax = BF · [Ca(t)]M ax (2.6)
With the acquisition of rapid series of CT images, it is possible to extract BF from Eq. 2.6 and compute it as the rate between the maximum slope of the tissue TCC (computed on the increasing portion of the TCC identified during the first pass phase) and the peak height of the arterial TCC as shown in Eq. 2.7 [61]: BF = [ dQ(t) dt ] M ax [Ca(t)]M ax (2.7) This method to compute BF is known as the maximum slope method (MSM) or simply slope method and has been validated in liver [87, 88], kidney [89], pancreas [90], and brain [91, 92]. Figure 2.4 shows ideal aortic
Time (s)
Concentration (HU)
Aortic TCC Tissue TCC
Fig. 2.4: Representation of the aortic TCC (in the red colour) and of a tissue TCC (in the blue colour). The red star indicates the aortic peak while the blue circle highlights the point of maximum slope of the tissue TCC.
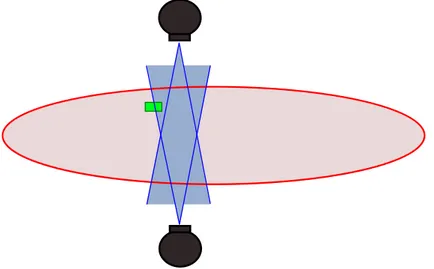
and tissue TCCs with two markers in correspondence of the time points where the parameters needed by the MSM (i.e., the aortic peak and the maximum slope) have to be computed. The MSM can be applied also in biological systems with a dual-input supply as the one schematized in Figure 2.5. In these cases, the MSM is applied two times, by considering the contribution of the two input functions separately. For instance, as regards the hepatic district, while CA brought by the arterial input directly flows into the liver, CA arriving through the portal vein arrives later, since it passes through the spleen first. Therefore, usually the peak time of the splenic TCC is considered as the separating time threshold between the two different TCC portions. Indeed, while the enhancement of the tissue TCC before the splenic peak is
C
a(t)
C
v(t)
Biological
system
C
p(t)
Fig. 2.5: Representation of a dual-input and a single-output mono-compartmental model.
considered to be caused predominantly by the arterial input, the part after is mainly attributed to the portal vein. MSM is then applied twice according to what depict in Figure 2.6. The first time, it is carried out on the first part of
Fig. 2.6: Typical tissue TCC of a dual-input system with the two portions sepa-rated by the dotted vertical line and the two maximum slopes highlighted by the red lines.
the tissue TCC by using the aorta or an hepatic artery as the vascular input, and the second time on the second part of the tissue TCC using the portal vein as the vascular input [8]. The same procedure can be used in the lung by considering the left atrium peak as the time separator of the two tissue TCC portions: the pulmonary portion before the peak, and the bronchial portion after [76].
The main strong points of MSM are the mathematical, numerical and con-ceptual simplicity. Nevertheless, the assumption of no venous washout does not hold any more at the time instant when the tissue maximum slope is com-puted. In fact, in some cases where the tissue is highly perfused and lowly vascularized or the administered bolus of CA is not “short and sharp”, it may
happen that part of CA starts leaking from the tissue before the maximum slope time instant. In these cases, if the venous outflow is relevant, BF will be underestimated [61, 86]. However, thanks to its easy implementation and to its versatility, this method has been implemented in several commercial soft-ware [52] and it is currently widely applied to several body districts such as lung [73], liver [93], kidney [94], and pancreas [95].
The second method based on IDT and known as deconvolution method, avoids the assumption of no venous outflow by solving the inverse process of convolution. To well understand this method, the impulse residual function
R(t) has to be introduced. R(t) (represented in Figure 2.7) is a function
Time (s)
R(t)
Fig. 2.7: Input residual function R(t).
describing the quantity of CA still inside tissue at time t and can be written through Eq. 2.8:
R(t) = 1−
∫ t
0
h (τ ) dτ (2.8)
By considering Eqs. 2.1 and 2.4 and thanks to R(t), it is possible to express the relation between Ca(t) and the tissue concentration Ct(t) through Eq. 2.9
(see Appendix 8 for more details):
Ct(t) = BF · R (t) ⊗ Ca(t) (2.9)
When CA is still in the IV network it is possible to solve the deconvolution problem and extract the flow-scaled R(t), that is the product BF · R(t) [47]. The value of BV and BF can be extracted as the area and the maximum height of the kernel BF · R(t), respectively [61, 86]. By applying the central volume
principle [84], it is finally possible to compute MTT as the rate between the area and the maximum height of the flow scaled R(t):
M T T = BV
BF (2.10)
Like MSM, the deconvolution technique allows considering the dual vascular input. This can be done by describing the vascular input as the combination between the two blood supplies. In particular, by introducing PI , the total input of the system BF · Ca(t) can be written as described in Eq. 2.11:
BF · Ca(t) = P I · Ca(t) + (1− P I) · Cp(t) (2.11)
Therefore, Eq. 2.9 can be rewritten as in Eq. 2.12:
Ct(t) = [P I· Ca(t) + (1− P I) · Cp(t)]⊗ R(t) (2.12)
where Cp(t) is the concentration of the second vascular input [77].
Although the deconvolution method has been validated in cerebral stud-ies both against microspheres [96] and stable xenon [96, 97], it presents sev-eral drawbacks due to its numerical properties. Indeed, while the convolution operation gives a unique result, the inverse problem is ill-posed and returns multiple solutions, all mathematically approximating the result of the convo-lution between Ct(t) and Ca(t), but with some of them having no physiological
meaning and without knowing the right one [86]. To solve this problem, ad-ditional assumptions on the shape of R(t) or correction methods have to be applied. Several methods have indeed been proposed to achieve more cor-rect results [98, 99]. The most spread in literature include the use of Wiener filter on the Fourier transform of the deconvolution problem [100] and the application of regularization methods such as the truncated singular value de-composition [101, 102] and the Tikhonov regularization method [102, 103]. A further problem of deconvolution is due to its sensitivity to bolus dispersion and delay. Indeed, to reach the tissue analysed, CA has to pass through vessels and microvessels of different dimension and length, this causing a delay and a dispersion of the bolus measured inside the arterial input. Therefore, since the shape of the function R(t) extracted from deconvolution reflects properties of both vasculature and tissue, CA delay and dispersion will affect R(t) shape and in turn the obtained perfusion values [104, 105]. Many studies have thus been conducted in order to reduce the side effects of this issue and to permit
a more accurate estimation of perfusion parameters [106, 107]. Despite decon-volution approach is complex and still shows some limitations, this technique has been widely implemented and it is currently adopted in several perfusion studies [108, 109, 110].
2.2.3
Methods based on the PCM
The alternative method to IDT to analyse the tracer kinetic is PCM. While in IDT the tissue is considered as a black box, in PCM, some assumptions about the physiology of the analysed tissues are taken into account.
To better understand this part and the terminology used, it is important to have clear in one’s mind the tissue physiological fluids and their classification, represented in Figure 2.8. Indeed, fluids can be subdivided in the two
macro-Intra-cellular space Extra-cellular space Extra-vascular space Intra-vascular space Interstitial space Transcellular space TISSUE
Fig. 2.8: Classification of the fluids inside a physiological tissue.
categories of intra- and extra-cellular fluids. Moreover, the extra-cellular fluids in their turn can be subdivided in IV and EV fluids. IV fluid is constituted by blood plasma, while EV fluid is made of the interstitial and the transcellular fluids. However, since the volume of the transcellular fluid is very low and often negligible, EV space can be considered as made by the interstitial fluid only. For this reason, EV is often called interstitial space.
Differently from IDT, in PCM tissue is described by several interacting compartments, each reflecting a different state of the administered CA. Each compartment is characterized by the same kinetic status as CA [105] and it can be assumed as being either well-mixed or plug-flow. In the first case, the
concentration within the compartment is assumed to be spatially uniform at any given time (Figure 2.9 (a)), meaning that CA spreads and diffuses inside
(a) (b) x 0 L x 0 L (c) x 0 L dx dx dx dxdx dxdx
Fig. 2.9: Example of a well-mixed (a) and a plug-flow (b) compartment, referred to a generic time instant ti where CA is distributed uniformly and following a
gradient (from x = 0 to x = L), respectively. Finally, the plug-flow compartment in (b) has been further subdivided in infinite single compartments, each having a different constant spatial concentration (c).
the compartment instantaneously. On the contrary, in case of a plug-flow compartment, the concentration of CA is considered to be spatio-temporally variant, following a gradient (Figure 2.9 (b)). In particular, it is assumed that CA is carried on through a tube, whose length is parametrised by x (i.e., ranging from x = 0 to x = L). For instance, this assumption may hold when describing the status of CA inside the capillary bed, whose diffusion from arteriole to venule takes a finite time and is not uniform immediately along the whole vessels path [62, 111]. The concentration inside the compartment is both temporally and spatially-dependent. Therefore, in order to mathematically describe the system, the tube is subdivided into a series of small cylindrical sections discs with infinitesimal height dx → 0, that are rings with an inner constant spatial concentration (i.e., practically discs), so as that each disc can be considered as a single compartment (Figure 2.9 (c)) [111].
In the following paragraphs, the main PCM used in the literature to eval-uate perfusion parameters are briefly described. Starting from the single-compartment model, the next paragraphs consider models composed by even more compartments, up to four. However, this section is mainly focused on the single- and two-compartment models which are those mostly used in the literature.
The dual-input single-compartment model (2I1CM) is characterized by one well-mixed compartment, two vascular input and a single output
(Fig-ure 2.5). This model can be described by the following differential equation:
dCt(t)
dt = k1a· Ca(t) + k1p· Cp(t)− k2· Ct(t) (2.13)
where the parameters k1a and k1p represent the arterial and the portal inflow
rate constant, respectively, and k2 is the outflow rate constant of the system.
By solving Eq. 2.13 for Ct(t), it is possible to write Eq. 2.14:
Ct(t) =
∫ t
0
[k1a· Ca(T − τa) + k1p· Cp(T − τp)]· e−k2·Ct(t−T )dT (2.14)
where τa and τp are the delay parameters representing the transit time of CA
from aorta and portal vein to the tissue, respectively. By fitting tissue TCCs with the model described in Eq. 2.14 and exploiting a minimization of the fitting errors to achieve the best fitting, it is possible to compute the values of the parameters k1a, k1p and k2 for that fitting curve. aBF , pBF , and MTT
can thus be achieved according to Eqs. 2.15, 2.16, and 2.17:
aBF = k1a EF (2.15) pBF = k1p EF (2.16) M T T = 1 M T T (2.17)
Since EF in the liver can be assumed as being unitary [112], aBF and pBF correspond to k1a and k1p, respectively. This model has been validated against
microspheres by Materne et al. [112] in the liver and has been used in several hepatic perfusion studies, such as [113, 114]. However, 2I1CM could be used also in case of a single vascular input, by assuming k1p= 0. Therefore, starting
from Eq. 2.14, it is possible to obtain the following model:
Ct(t) =
∫ t
0
k1a· Ca(T − τa)· e−k2·Ct(t−T )dT (2.18)
Therefore, in this case, aBF represents the total BF value of the organ and corresponds is equal to k1a. Nevertheless, this model has been mainly applied
to dual input systems.
The two-compartment exchange model (2CXM) describes the plasma and the interstitial spaces as two well-mixed compartments (Figure 2.10). Since it is assumed that EV exchanges CA with IV only, to fulfil the mass
F
ivPS
v
ivv
evFig. 2.10: Schematic representation of 2CXM, where Fiv is the plasma flow, viv
and vev are the volume of the plasma and the interstitial space, respectively and PS is the permeability surface between the two compartments.
conservation principle (stating that no CA accumulates in the system), the exchange of CA between the two compartments is the same in both directions. The equation of the model can be then written according to Eq. 2.19:
vev·
dCev(t)
dt = P S· Civ(t)− P S · Cev(t) (2.19)
where Cev and Civ represent CA concentration in EV and IV, respectively,
and vev is the EV volume. This model has been first applied to CT perfusion
studies [115], but recently its application has been extended to MRI perfusion studies [116, 117].
The tissue homogeneity model (THM) is similar to 2CXM, but it de-scribes the plasma space as a plug-flow system (Figure 2.11). However, this model has not been widely adopted since the differential equations defining the model does not have a time-domain solution [111]. To solve this problem, the
adiabatic approximation to the tissue homogeneity model (AATHM)
has been proposed by Lee [118]. The only difference between this model and THM is the assumption that CA cannot pass through the capillary walls (i.e.,
PS = 0) in all spatial points other than x = L (as shown in Figure 2.12). IV
and EV can thus be respectively described by the two following differential equations (Eq. 2.20 and Eq. 2.21):
viv L ∂Civ(x, t) ∂t =−Fiv· ∂Civ(x, t) ∂x (2.20)
F
ivPS
v
ivv
evFig. 2.11: Schematic representation of THM. Here, the plasma compartment is represented as a plug-flow system.
F
ivPS
v
ivv
ev x 0 LFig. 2.12: Schematic representation of AATHM. The plasma compartment is represented as a plug-flow system and CA exchange occurs only at x = L.