UNIVERSITÀ DEGLI STUDI DI ROMA
“TOR VERGATA”
FACOLTÀ SCIENZE MATEMATICHE FISICHE E NATURALI DOTTORATO DI RICERCA IN SCIENZE CHIMICHE XXII CICLODifferent mechanisms of action of
antimicrobial peptides: insights
from fluorescence spectroscopy
BARBARA ORIONI
Supervisor: Prof. Lorenzo Stella Ph. D. School Coordinator: Prof. Bruno Crociani A. A. 2009/2010ABSTRACT
Antimicrobial peptides (AMPs) are natural oligopeptides endowed with a strong bactericidal activity. Most of them kill bacteria by interacting with their membranes and perturbing their permeability. Due to this mechanism of action, which apparently does not induce bacterial resistance, they are investigated as promising candidates for the development of new antibiotic drugs to face the insurgence of multidrug resistant bacteria. Several different models have been proposed for their mechanism of membrane perturbation, but the molecular details of this process are still debated. Therefore, structural data on their interaction with lipid bilayers are essential for a detailed understanding of their mechanism of membrane destabilization, and for the rational design of new, potent and selective peptidomimetic analogues.
In this work, Dluorescence spectroscopy was employed, together with other physico‐chemical techniques, such as neutron reDlectivity, Langmuir‐Blodgett Dilm balance and molecular dynamics simulations, to characterize the mechanism of action of PMAP‐23, chosen as a typical example of cationic, helical AMPs. In order to discuss the different mechanisms of action of AMPs, and to evidence the potential of spectroscopic methods to discriminate between the different models, the results obtained with PMAP‐23 were systematically compared with those previously reported for the peptaibol trichogin GA IV.
Both experimental and theoretical data indicate a PMAP‐23 location just below the polar headgroups of the membrane, with an orientation essentially parallel to the bilayer plane. These Dindings, together with experimental results on peptide‐induced leakage from large and giant vesicles, lipid Dlip‐Dlop and peptide exchange between vesicles, support a mechanism of action consistent with the “carpet” model. According to this model, peptide accumulation in the outer leaDlet of the bilayer causes a difference in surface tension between the two layers of the membrane, which is then released though the formation of defects, thus inducing membrane leakage. Further experiments excluded the speciDic role of some PMAP‐23 residues in its membrane‐perturbing activity .
Finally, a kinetic model describing the kinetics of vesicle leakage induced by antimicrobial peptides was proposed and discussed. The leakage kinetics are usually very slow, requiring minutes to hours for complete release of vesicle contents, and exhibit a biphasic behavior. In this thesis, all the possible options for the rate‐limiting step of the slow leakage process were systematically studied. Fluorescence experiments demonstrated that all processes involved in peptide‐membrane interaction (peptide‐membrane association, peptide aggregation and peptide translocation) take place in a time‐scale much shorter than the leakage kinetics. However, peptides are continually exchanging among vesicles, and this necessarily causes Dluctuations over time in the number of peptide molecules bound to each liposome, and in the formation of pores. Due to the relatively small size of the vesicles, the number of bound peptides can be rather small, and its Dluctuations
signiDicant. Therefore, according to our model, the fast initial leakage is caused by those vesicles which, after the initial random distribution of peptides among liposomes, already contain at least one pore, while the slower release is associated to the time needed to occasionally reach the critical number of bound peptides necessary for pore formation in an intact vesicle. Fluctuations due to peptide exchange among vesicles are therefore the rate‐limiting step of such a slow mechanism, that ultimately leads to the leakage of all the loaded vesicles.
Chapter 1
INTRODUCTION
1.1. Bacterial resistance
Antibiotic drugs, discovered during the 20th century, have substantially reduced the problems caused by infectious diseases. The use of these "wonder drugs", combined with improvements in sanitation, housing, and nutrition, and the advent of widespread immunization programs, has led to a dramatic drop in deaths from diseases that were previously widespread, untreatable, and frequently fatal. Over the years, antimicrobials have saved the lives and eased the suffering of millions of people. By helping to bring many serious infectious diseases under control, these drugs have also contributed to the major gains in life expectancy experienced during the latter part of the last century.
These gains are now seriously jeopardized by the emergence and spread of microbes that are resistant to these drugs. Figure 1.1 shows, as an example, the incidence of drug resistant Staphylococcus aureus in different countries. The bacterial infections which contribute most to human disease are also those in which emerging and microbial resistance is most evident.
Figure 1.1. Proportion of invasive S. aureus isolates resistant to oxacillin (MRSA) in 2006. Countries shown in white didn’t report any data or reported less than 10 isolates. [EARSS Annual Report 2006]
The consequences are severe. Infections caused by resistant microbes fail to respond to treatment, resulting in prolonged illness and greater risk of death. Treatment failures also lead to longer periods of infectivity, which increase the numbers of infected people moving in the community and thus expose the general population to the risk of contracting a resistant strain of infection.
Resistance to antimicrobials is a natural biological phenomenon that can be ampliDied or accelerated by a variety of factors, including human practices. Self‐medication, the use of an antimicrobial for any infection, real or feared, in any dose and over any time period, forces microbes to either adapt or die in a phenomenon known as "selective pressure". The microbes which adapt and survive carry genes for resistance, which can be passed on. Antibiotic drugs normally act by penetrating into the microorganisms and by interacting with speciDic
targets, leading to inhibition to cell wall, DNA or protein biosynthesis in growing cells. Therefore, mechanisms of bacterial resistance include modiDication of the molecule targeted by the drug, development of alternative metabolic pathways which do not involve the enzyme targeted by the antibiotic, reduction of porin expression or development of active pumps to reduce the intracellular concentration of the drug, and enzymatic degradation of the antibiotic (Figure 1.2).
Figure 1.2. Mechanisms of bacterial resistance [http://www.microbiologia.unige.it].
Bacteria are particularly efDicient at enhancing the effects of resistance, not only because of their ability to multiply very rapidly but also because they can transfer their resistance genes, which are passed on when the bacteria replicate. When antimicrobials are used incorrectly ‐ for too short a time, at too low a dose, at inadequate potency; or for the wrong disease ‐ the likelihood that bacteria and other microbes will adapt and replicate rather than be killed is greatly
enhanced. Veterinary prescription of antimicrobials also contributes to the problem of resistance.
For all these reasons, development of alternative drugs and/or the recovery of natural molecules that would allow the consistent and proper control of pathogen‐caused diseases is extremely urgent.
1.2. Antimicrobial Peptides
Antimicrobial peptides (AMPs) are small molecular weight proteins, which are a component of the innate immune system, They have been isolated from a wide range of living organisms, such as bacteria, plants, insects, mammals and amphibians, and they are active against a large spectrum of microorganisms, including bacteria and Dilamentous fungi. They exhibit a remarkable diversity of structures and conformations, including α‐helices, β‐sheets, cyclic structures, or even extended conformations, with an amphiphilic character as the only general feature.
The mechanism of action of AMPs differs from those of conventional antibiotics: they simply bind aspeciDically to the bacterial membrane and alter its permeability, leading to cell death [Sitaram and Nagaraj, 1999]. The lack of a protein target is conDirmed by studies showing that enantiomers of lytic peptides, composed solely of D‐amino acids, possess a biological activity which is indistinguishable from that of the parent molecules [Blondelle et al., 1999; Juvvadi et al., 1996 and Papo and Shai, 2003]. For this reason most bacterial resistance
mechanisms are ineffective against AMPs, that therefore constitute a very promising target for the development of new antimicrobial agents to Dight the problem of drug‐resistance.
Notwithstanding the absence of speciDic binding, many AMPs can selectively target the membranes of microbes instead of those of mammals. This selectivity is probably due to the different lipid composition of the membranes involved (Figure 1.3): the outer layer of mammalian cells is mainly constituted of neutral and zwitterionic phospholipids and cholesterol, while the bacterial membrane contains phosphatidylglycerol or in general anionic lipids [Zasloff, 2002; Epand and Vogel, 1999 and Matsuzaki, 1998].
The spectrum of activity of antimicrobial peptides varies signiDicantly: some of them are toxic only against Gram‐positive bacteria (e. g. cecropins), others against both Gram‐positive and Gram‐negative bacteria (e.g. magainins and dermaseptins); some peptides can be active solely on fungi or toward both bacteria and fungi (e. g. cathelicidins).
Figure 1.3. Bacterial and eukaryotic cell membrane composition. PC, phosphatidylcholine, PE, phosphatidylethanolamine and SM, sphyngomyelin are zwitterionic phospholipids, PG, phosphatidylglycerol is an anionic molecule, C is cholesterol, LPS and DPG are lipopolysaccaride and diphosphatidylglycerol or cardiolipin, respectively.
1.2.1. Mechanism of action and models
The study of peptide‐membrane interactions is a fundamental step to understand the biological activity of AMPs, but the molecular details of their mechanism of membrane perturbation are still debated, and several models, summarized in Figure 1.4, have been proposed [Shai, 2002; Matsuzaki, 2001; Yang et al., 2001; Huang, 2000 and Pouny and Shai, 1992].
In the “barrel stave” model, peptides form a transmembrane pore, with the peptide chains aggregated laterally to form a cylindrical, barrel‐like superstructure around a water‐Dilled pore, so that their
hydrophobic surfaces interact with the lipid core of the membrane and their hydrophilic surfaces point towards the aqueous interior of the pore [Chugh and Wallace, 2001; Ludtke and Huang, 1996; Spach et al., 1989 and Schwarz et al., 1987]. The barrel‐stave mechanism involves three major steps: binding of the monomers to the membrane in a helical structure, insertion into the membrane and the progressive recruitment of additional monomers to form the pore [Oren and Shai, 1998].
In the “carpet” or SMH mechanism, proposed by Shai, Matsuzaki and Huang [Ludtke et al., 1997; Matsuzaki et al., 1994 and Gazit et al. 1996], peptides bind onto the surface of the membrane and cover it in a carpet‐like manner, laying parallel to the bilayer surface (with the hydrophobic face pointing towards the lipid core, and the hydrophilic face to water). Their accumulation on the membrane surface causes a tension between the two leaDlets of the bilayer, which above a threshold concentration is released by forming local defects which cause leakage. In contrast to the barrel‐stave mechanism, the peptide doesn’t insert into the hydrophobic core of the membrane, but it remains always associated to the phospholipid headgroups. According to some authors, the membrane defects formed according to the carpet mechanism, might be toroidal (or worm‐hole) pores [Oren and Shai, 1998; Matsuzaki, 2001; Gazit et al., 1995; Ludtke et al., 1997], characterized by the lipid bilayer bending back onto itself in a toroidal shape.
Figure 1.4. Possible mechanisms of action of antimicrobial peptides. Cylinders represent peptides; the hydrophilic and hydrophobic parts are reported in blue and in red, respectively.
In the ‘‘leaky slit’’ model [Zhao et al., 2006], peptides are oriented perpendicularly to the membrane, but, rather than forming a circular pore, they aggregate side to side to form an amphipathic ribbon. The hydrophobic face of the ribbon is oriented towards the hydrocarbon chains of the bilayer, while toxicity is caused by the hydrophilic face, as this side of the ribbon cannot seal with the opposing contacting bilayer by hydrophobic interactions. As a consequence, lipids are forced to adopt a highly positive curvature, causing the membrane to bend onto itself.
According to another model, peptides could act as “ion‐carriers”, binding a ion or a molecule to be transferred across the membrane, and exposing their hydrophobic residues towards the outside, thus facilitating the translocation of hydrophilic species across the
et al., 1994]. The “sinking‐raft” model is another hypothesis [Pokorny et al., 2002] in which several peptides form an aggregate, which can
diffuse through the membrane, allowing the concomitant leakage of cell contents.
1.3. Two classes of AMPs
Even though, AMPs exhibit a wide variety of sequences and of secondary structures, helical peptides are one of the most common and best characterized groups of AMPs. However, even among helical, amphiphilic AMPs, profound differences can be observed. For instance, two of the most studied classes of helical AMPs are cathelicidins and peptaibols.
Cathelicidins are the major AMPs in mammals, and most of them are linear peptides of 20‐40 amino acid residues, and it is now well established that these peptides exhibit a structural transition from an extended coil to a well‐deDined helical structure upon binding to membrane surfaces [Shai, 1999 and Epand and Vogel, 1999]. They have a strong cationic character, and this likely explains the fact that these peptides exhibit a strong afDinity for bacterial membranes but little or no binding to zwitterionic phospholipids, which are the major component of the outer leaDlet of eukaryotic cells [Oren and Shai, 1998; Matsuzaki, 1999 and Lohner and Prenner 1999].
Peptaibols, on the other hand, are linear peptides isolated from soil fungi, mainly of the genus Trichoderma, and are 11‐20 aminoacids
in length. They contain a C‐terminal alcohol group, an N‐terminal acetyl group, and, most importantly, the Cα,α‐disubstituted aminoacid Aib
(aminoisobutiryc acid), [Chugh and Wallace 2001; Benedetti et al., 1982 and Auvin‐Guette et al., 1992]. The presence of geminal dialkyl substituents at the tetrahedral C(α)‐atom in Aib imposes major steric restrictions on the energetically accessible conformational space [Karle and Balaram, 1990; Pispisa et al., 2000a and Pispisa et al., 2000b], and therefore all peptaibols are mostly helical even in solution. By contrast to cathelicidins, peptaibols are usually neutral, strongly hydrophobic and do not exhibit selectivity in their membrane‐perturbing activity.
Two representative examples of AMPs belonging to the class of cathelicidins and peptaibols, respectively, are illustrated below.
1.3.1. PMAP23
PMAP‐23 is a member of the cathelicidin family, it was isolated in pigs [Zanetti et al., 1994], and it shows a broad spectrum of antimicrobial activity against both Gram‐positive and Gram‐negative bacteria, as well as fungi, while it has no hemolytic activity, even at a concentration of 100 μM [Zanetti et al., 1994 and Kang et al., 1999]. Indeed, its potency and selectivity make PMAP‐23 a highly attractive candidate for the development of new antibiotic drugs.
Its sequence is 23 residues long and is reported below, with charged residues shown in red and hydrophobic residues in blue. It
contains two Trp residues which endow the peptide with intrinsic Dluorescence.
ArgIleIleAspLeuLeuTrpArgValArgArgProGlnLysProLysPheValThrValTrpValArg
Recent NMR and CD spectroscopic studies showed that PMAP‐23 is disordered in solution, but in membrane‐mimetic environments it adopts a helix‐hinge‐helix structure, consisting of N‐terminal (residues 1‐10) and C‐terminal (residues 17‐23) α‐helical regions connected by a Dlexible hinge segment containing the two Pro residues [Park et al., 2002] (Figure 1.5).
The mechanism of membrane‐destabilization by PMAP‐23 is still undetermined, and it is the object of the present work.
Figure 1.5. Ribbon‐model representation of the backbone structure of PMAP‐23 in membrane mimicking micelles, as determined by NMR. The peptide has a helix‐hinge‐helix structure with an overall amphipathic arrangement of the side‐chains.
1.3.2. Trichogin GA IV
Trichogin GA IV is the main component of the lipopeptaibol family and was Dirst isolated in 1992, by Bodo and coworkers [Auvin‐Guette et al., 1992] from the soil fungus Trichoderma longibrachiatum. It exhibits signiDicant activity against S. aureus, but it is also hemolytic [Toniolo et
al., 1994]. It is only 11 residues long and its sequence is OctAibGlyLeuAibGlyGlyLeuAibGlyIleLol where Oct is n‐octanoyl, and Lol is leucinol. The structure of trichogin GA IV was widely studied in methanol solution using CD, EPR and NMR data, while the crystal structure of the peptide was determined using a centro‐symmetric space group obtained by co‐crystallization of racemic crystals [Toniolo et al., 2001; Auvin‐Guette et al., 1992; Locardi et al., 1998; Monaco et al., 1998; Toniolo et al., 1994 and Toniolo et al., 1996]. All of these studies suggest that the peptide adopts a Dlexible, right‐handed, mixed 310/α helical structure, even in solution. More importantly, they suggest the structure of trichogin to be amphiphilic, with all of the hydrophobic groups (n‐ octanoyl and Leu, Ile and Lol aliphatic side chains) on one helix face and the four glycine residues form the hydrophilic face [Epand et al., 1999]. This conformation is shown in Figure 1.6.
Figure 1.6. Model of a membrane‐bound conformation of trichogin GA IV [Epand et al., 1999].
The mode of action of this peptide has been characterized in detail by spectroscopic studies, supporting the idea that trichogin induces membrane permeability by forming channels, rather than acting as an ion‐carrier or perturbing the bilayer [Mazzuca et al., 2005]. More in detail, these studied indicated that in the membrane trichogin undergoes a cooperative transition, driven by the concentration of bilayer‐bound peptide, from a monomeric state, which is inactive and is associated at the surface of the membrane, parallel to its plane, to an aggregated state, which is inserted into the bilayer and causes membrane permeability.
1.4. Aim of the present work
As evidenced by the variety of models put forward, and described in Section 1.2, the actual mechanism of membrane perturbation by AMPs
in general is still strongly debated. This is mainly due to the difDiculty in obtaining atomic‐resolution structural data on peptide‐membrane systems by the most powerful structural techniques (X‐ray crystallography and NMR) [Lacapère et al., 2007]. Hence, alternative approaches for gaining structural information in membranes would be desirable.
Optical spectroscopies, and particularly Dluorescence techniques, can be easily applied to model membrane systems, and even to live cells. They can provide a wealth of information on peptide–membrane interactions, peptide location and orientation in the bilayer, and its effects on membrane structure and integrity [Stella et al., 2004; Mazzuca et al., 2005; Gatto et al., 2006; Stella et al., 2007; Loura et al., 2003; Stella et al., 2008 and Johnson, 2005]. In this thesis, these methods were applied, together with molecular dynamics simulations, Langmuir‐Blodgett and neutron reDlectivity experiments, to characterize the mechanism of action of PMAP‐23, chosen as a typical example of cationic, helical peptides belonging to the cathelicidin family.
In order to discuss the different mechanisms of action of AMPs, and to evidence the potential of spectroscopic methods to discriminate between the different models, the results obtained with PMAP‐23 were systematically compared with those previously reported for the peptaibol trichogin GA IV.
Furthermore, a kinetic model describing the kinetics of peptide‐ induced vesicle leakage was proposed and discussed.
1.4.1. Peptide analogues
In the present work two single tryptophan analogues of PMAP‐23 have been employed, in addition to the natural peptide. They are indicated as PMAP‐W7 and PMAP‐W21, to specify the position of the remaining Dluorophore. Moreover, other analogues were synthesized by substituting Arg 10 or Lys14 with alanine. The amino acid sequences of the PMAP‐23 analogues are reported below.
PMAPW7
ArgIleIleAspLeuLeuTrpArgValArgArgProGlnLysProLysPheValThrValPheValArg
PMAPW21
ArgIleIleAspLeuLeuPheArgValArgArgProGlnLysProLysPheValThrValTrpValArg
Arg10Ala
ArgIleIleAspLeuLeuTrpArgValArgArgProGlnLysProLysPheValThrValTrpValArg
Lys14Ala
ArgIleIleAspLeuLeuTrpArgValArgArgProGlnArgProLysPheValThrValTrpValArg
All PMAP‐23 analogues were synthesized at the Research Center for Proteineous Materials (Chosun, Republic of Korea), which is involved in a joint project with our group, devoted to the determination of the mechanism of action of AMPs.
In order to perform Dluorescence experiments on trichogin GA IV, which is not intrinsically Dluorescent, the Dluorescent analogue F10 was designed and synthesized in the laboratory of Prof. Toniolo at the
University of Padua. The Dluorescent label Dluorene was introduced at position 10:
OctAibGlyLeuAibGlyGlyLeuAibGlyDab(Fmc)LeuOMe Fmc is Dluorenyl‐9‐methylcarbonyl, linked to the side chain of 2,4‐ diaminobutyric acid (Dab) (Figure 1.7).
Chapter 2
MATERIALS, METHODS AND TECHNIQUES
2.1. Peptides synthesis
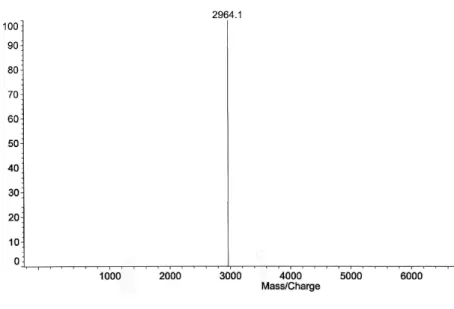
2.1.1. PMAP23 PMAP‐23 and its analogues were synthesized at the Research Center for Proteinous Materials (RCPM, Korea), by standard solid‐phase synthesis [MerriDield, 1986].The synthetic peptides were puriDied by RP‐HPLC on Shimadzu LC‐6AD and Shimadzu LC‐10Avp systems using an ODS column (4.6 x 250 mm). The puriDied peptides were shown to be homogeneous (>98%) by analytical HPLC. The molecular weight of all synthetic peptides was conDirmed using Kratos Kompact matrix assisted laser desorption/ionization time‐of‐Dlight mass spectrometry (MALDI‐TOF MS, Shimadzu, Japan). In Figures 2.1 and 2.2 HPLC and mass spectra, performed at RCPM , are shown.
Figure 2.2. Mass spectrum of peptide PMAP‐23.
2.1.2. Trichogin GA IV
Synthesis of trichogin analogues Tric‐OMe and F10, used for Dluorescence experiments, was performed in the laboratory of Professor C. Toniolo at the University of Padua.
Synthesis was carried out in solution using the fragment condensation approach. Peptide coupling reactions were performed by either the 1‐(3‐dimethylaminopropyl)‐3‐ethylcarbodiimide (EDC)/ HOBt (1‐hydroxy‐1,2,3‐benzotriazole) or by the EDC/HOAt (7‐aza‐1‐ hydroxy‐1,2,3‐benzotriazole) method. The Fmc group was introduced into the Dab side chain using EDC/HOAt. Details of the synthesis and
characterization of peptide F10 were reported elsewhere [Didoné, 2001].
2.2. Reagents
All phospholipids were purchased from Avanti Polar Lipids (Alabaster, AL, USA). 5,6‐CarboxyDluorescein, N‐acetyl‐tryptophan‐amide (NATA), poly‐L‐lysine, Triton X‐100, Sephadex G‐50, polyethylenimine (PEI), polystyrene sulphonate (PSS), poly(allylamine hydrochloride) (PAH), tetramethyl methoxysilane, Sigmacote® and trypsin were purchased
from Sigma (St. Louis, MO). Inorganic salts and spectroscopic grade solvents (Carlo Erba, Milano, Italy) were used. Polyvinyl alcohol (PVA), average M.W. 22000, 88% hydrolyzed was purchased from Acros (Geel, Belgium). 6‐Dodecanoyl‐N,N‐dimethyl‐2‐naphthylamine (Laurdan) and diphenyl hexatriene (DPH) from Fluka (Buchs, Switzerland).
In Figure 2.3 the chemical structures of some Dluorophores employed in the present study are shown.
2.3. Methods
2.3.1. Liposomes as membrane models
Liposomes are closed phospholipid membranes of spherical shape, separating a water compartment from the bulk water.
They are considered a good model of biological membranes, since phospholipids are the main constituents of cellular membranes. The most common phospholipids are phosphatidylcholine molecules (PC), amphipathic molecules in which a glycerol bridge links two hydrophobic acyl hydrocarbon chains to an hydrophilic polar headgroup, phosphocholine [New, 1990]. PC, also known as “lecithin”, can be derived from natural sources such as egg yolk (ePC) or synthesized. The phosphatidylcholine extracted from natural sources is, actually, a mixture of phosphatidylcholines, with chains of different lengths and varying degrees of saturation.
Another important phospholipid found in nature (which has also been employed in this work) is phosphatidylethanolamine (PE), characterized by having a primary, instead of quaternary, ammonium headgroup and, consequently, a pH‐dependent charge state. In order to mimic bacterial membranes, the anionic phosphatidylglycerol (PG) was mixed with the zwitterionic lipids. Figure 2.4 shows the structures of all phospholipids employed.
Moreover, sterols, and in particular cholesterol (henceforth abbreviated as Chol), are other important components of most natural membranes. Due to the rigidity of their structure, their incorporation in
the lipid bilayer can bring about major changes in the properties of the membranes, such as a reduction in the freedom of motion of the fatty acyl chain carbon atoms. Being an amphipathic molecule, cholesterol inserts into the membranes with its hydroxyl groups oriented towards the aqueous surface and the aliphatic chain aligned parallel to the acyl chains in the center of the bilayer [New, 1990].
In this thesis work, only unilamellar vesicles have been used, i.e. liposomes constituted by a single phospholipid bilayer.
Liposomes can be classiDied on the basis of their dimension: they are called small unilamellar vesicles (SUVs), large unilamellar vesicles (LUVs) and giant unilamellar vesicles (GUVs) if their diameters are approximately in the range 15‐50 nm, 100‐400 nm and 1‐200 μm, respectively. LUVs and GUVs were employed in our experiments.
In order to perform some Dluorescence experiments, labeled liposomes are necessary: labeled phospholipids used in the present work are shown in Figure 2.4B.
POPC
A
POPG DMPC DMPG DOPC DOPG DOPE Figure 2.4A. Chemical structures of phospholipids.N‐NBD‐PE
B
C6‐NBD‐PC N‐Rho‐PE 5‐Doxyl‐PC TEMPO‐PC Figure 2.4B. Chemical structures of labeled phospholipids.2.3.2. Preparation of large unilamellar vesicles
LUVs were prepared by dissolving ePC and ePG (2:1 molar ratio) in a chloroform/methanol solution (2:1 v/v). This lipid mixture has been widely used to mimic bacterial membranes; even though PC is not a bacterial lipid, this composition reproduces the content of zwitterionic and anionic lipids in the cytoplasmic membrane of bacteria. LUVs containing ePC/Cholesterol (1:1 molar ratio) were employed in the experiments with trichogin GA IV.
Methanol was added to the solvent mixture to slow down evaporation, favoring the formation of a thin and homogeneous lipid Dilm on the Dlask walls. Organic solvents were evaporated under reduced argon atmosphere until the Dilm formed. Complete evaporation was ensured by applying a rotary vacuum pump for 2 hours.
Lipids were hydrated in a 10 mM phosphate buffer (pH=7.40) containing 140 mM NaCl and 0.1 mM EDTA. For release experiments a 30 mM carboxyDluorescein solution (pH 7.0) was used to hydrate lipid Dilm. The solution, containing large multilamellar vesicles (LMVs), was vigorously stirred and subjected to 10 freeze and thaw cycles, to achieve a better separation between lipid bilayers in LMVs.
The liposomes suspension was extruded for 31 times through two stacked polycarbonate membranes with 100 or 200 nm pores. The extruder (Avestin, Inc., Ottawa, ON, Canada) is shown in Figure 2.5. All these processes must be performed at a temperature above the melting temperature of the lipid used.
Figure 2.5. LiposoFast extruder by Avanti Polar Lipids, scheme (A) and image (B).
In the case of carboxyDluorescein loaded vesicles, the unencapsulated Dluorescent molecules was separated from the liposomes by gel Diltration on a Sephadex G‐50 medium column.
NBD‐LABELED LIPOSOMES
Liposomes containing the Dluorescent lipid 1‐palmitoyl‐2‐[6‐((7‐ n i t r o b e n z ‐ 2 ‐ o x a ‐ 1 , 3 ‐ d i a z o l ‐ 4 ‐ y l ) a m i n o ) c a p r o y l ] ‐ L ‐ α ‐ phosphatidylcholine phosphatidylcholine (C6‐NBD‐PC) were prepared as follows [Mazzuca et al., 2005]: symmetrically labeled vesicles were obtained by adding 5% (mol/mol) C6‐NBD‐PC to the starting chloroform solution. Liposomes containing the Dluorescent label only in the internal layer were obtained by chemically quenching with
dithionite the external NBD of symmetrically labeled vesicles [McIntyre and Sleight, 1991]. The quenching reaction was performed by adding an aliquot of a 1 M dithionite solution in a Tris buffer (pH 10.0) to a 4 mM liposome solution (with a 1500:1 dithionite:NBD molar ratio). The kinetics of NBD quenching was followed by measuring Dluorescence intensity. After a plateau value was reached (in 1 min), excess dithionite was removed by gel Diltration. The dithionite concentration used was chosen to have a rapid reaction time, to minimize dithionite diffusion across the lipid bilayer. Complete quenching of external NBD was conDirmed by the absence of a further Dluorescence reduction after a second addition of dithionite to the Dinal liposome solution. The Dluorescence emission of the Dinal internally labeled liposomes was approximately 40% of the emission intensity of the starting symmetrically labeled vesicles.
Liposomes labeled only in the external layer were prepared by adding an aliquot of a concentrated ethanolic solution of C6‐NBD‐PC to preformed, unlabeled vesicles, to obtain a 2.5% label molar fraction [Matsuzaki et al., 1996]. The Dinal ethanol concentration was always below 1%vol/vol. The same procedure was carried out in the preparation of outer labeled vesicles containing (1,2‐dioleoyl‐sn‐ glycero‐3‐phosphoethanolamine‐N‐(7‐nitro‐2‐1,3benzoxadiazol‐4‐yl) (N‐NBD‐PE).
DOXYL‐LABELED LIPOSOMES
The degree of labeling of nitroxide‐containing lipids (1‐palmitoyl‐ 2‐ stearoyl(n‐doxyl)‐sn‐glycero‐3‐phosphocholine, with n=5, 7, 10, 12, 14,
16, and 1,2‐diacyl‐sn‐glycero‐3‐phosphotempocholine), employed for depth‐dependent quenching studies, was determined by double integration of electron paramagnetic resonance (EPR) spectra [Chattopadhyay and London, 1987]. Nitroxide‐labeled liposomes were produced by adding the labeled lipids to the initial chloroform solution (7% molar fraction). Spin label content was controlled directly on the Dinal liposomes by double integration of the EPR spectra of an aliquot of the liposomes dissolved in isopropanol. EPR experiments were performed in the laboratory of professor Jens Z. Pedersen, department of biology at University Tor Vergata in Rome. All liposome preparations contained the same amount of spin labels, within a 10% error.
2.3.3. Preparation of giant unilamellar vesicles
GUVs are characterized by a diameter 1 μm or higher, very similar to those of cells.
Due to their size, they can be directly visualized under an optical microscope. This property gives rise to multiple applications of GUVs. For instance, it is possible to isolate a speciDic vesicle under the microscope, and/or to perfuse a membrane‐active agent in the proximity of that liposome in order to visualize its effects.
GUVs were prepared by the electroformation method. To this end, a cell formed by two glass slides, covered by a thin layer of electrically conducting indium tin oxide (ITO), separated by a 1.5 mm thick silicon spacer, was employed (Figure 2.6B). A lipid Dilm (ePC/ePG/ Rho‐PE 66:33:1) was formed by spin coating a solution of the lipids in
chloroform/acentonitrile (95:5 vol/vol) on one of the two ITO slides (600 rpm, 5 minutes; Figure 2.6A).
Complete evaporation of the solvents was ensured by applying a rotary vacuum pump for at least 2 hours. The lipid Dilm was then hydrated by Dilling the formation chamber with a 0.3 M sucrose, 3 μM CF solution.
Figure 2.6. Schematic representation of the electroformation chamber (A) and of the spin‐coating procedure (B).
A 1.5 V (peak to peak), 10 Hz potential was applied to the electroformation chamber, for 1 h, and then switched to 4 V, 4 Hz for 15 min to favor detachment of GUVs from the electrode. The electrostatic potential causes growth of the GUVs.
on a silanized glass slide. The GUVs content and the lipid membrane could be observed independently by imaging the green CF Dluorescence and the red Rho‐PE Dluorescence.
Silanized glass slides were employed during Dluorescence imaging to allow liposome precipitation on surface without breaking.
The mechanism of GUV electroformation in an alternated Dield is not well understood. Probably, since the growing vesicles were observed to vibrate at the same frequency as the applied voltage, the electric Dield may serve to create a gentle mechanical agitation that assists in the formation, fusion and detachment of the vesicles [Estes and Mayer, 2005]. Figure 2.7 shows the Dluorescence microscopic images during GUVs formation.
Figure 2.7. Fluorescence microscopic images of GUVs at different times during the electroformation process. Image size 498 x 365 μm (ePC 66%; ePG 33%; Rho‐PE 1%).
2.3.4. Phospholipids assay
Stewart’s method was employed to determine the phospholipid concentration [Stewart, 1980]. This procedure consists in measuring the absorbance of the association complex between ammonium ferrothiocyanate and the polar headgroups of the phospholipids. Since the ferrothiocyanate complex forms with the polar heads, this assay does not depend acyl chains of the phospholipids to be quantiDied.
1.5 mL of a 0.1 M ammonium ferrothiocyanate aqueous solution was added to 1.5 mL of chloroform solution, containing the lipid to be determined, and the test tube was vigorously shaken for 60 s to favor the formation of the complex. Complex formation between ferrothiocyanate and phospholipids brings an aliquot of the water‐ soluble ammonium ferrothiocyanate, proportional to the lipid concentration, in the chloroform phase. After centrifugation (5 minutes at 3800 rpm) to rapidly separate the two solvent phases, and removal of the upper aqueous phase, the chloroform solution was transferred in a quartz cuvette and its absorbance at 488 nm measured. The phospholipid concentration was determined by comparison with a calibration curve, obtained by using solutions of known title. A linear behavior was observed at least up to 0.08 μmol of phospholipid present in the chloroform solution. Calibration curves determined for ePC and for a POPC/POPG 2:1 mixture are reported in Figure 2.8. The slopes of the curves are 4.5 μmoles‐1 and 3.4 μmoles‐1. All the experiments were
The presence of labeled phospholipids like NBD‐PE, Rho‐PE at a few percent of the total lipid concentration does not affect the accuracy of the phospholipid assay.
Figure 2.8. Calibration curve obtained using standard solutions of ePC (red circles) and POPC/POPG (2:1 mol/mol, blue circles). Continuous lines represent the best Dits to the data.
2.4. Experimental techniques
2.4.1. Fluorescence spectroscopyFluorescence spectroscopy is one of the most widely used spectroscopic techniques in the Dield of biophysical chemistry today. Although Dluorescence measurements do not provide atomic resolution structural information, the technique has become quite popular because of its
acute sensitivity to changes in the structural and dynamic of properties of biomolecules and biomolecular complexes. Furthermore, its time‐ scale (0.1‐100 ns) is comparable to that of many biological processes (protein rotations, conformational Dluctuations, etc.). Like most biophysical techniques, Dluorescence spectroscopic studies can be carried out at many levels, listing from simple measurement of steady‐ state emission intensity to quite sophisticated time‐resolved studies.
The phenomenon of Dluorescence consists in the radiative decay of a molecular (or atomic) system, following the absorption of a photon from a luminous source. More in detail, when light of an opportune wavelength is absorbed by a molecule, resulting in a spectroscopic transition to a less stable, higher energy state, the dissipation of this excess energy can follow different competitive pathways: non‐radiative (excited state reactions, collisions with the solvent or with other molecules, energy transfer) or radiative (Dluorescence or phosphorescence). In the radiative decay, the relaxation to the ground state occurs through the emission of a photon (red‐shifted with respect to the excitation wavelength, because of vibrational and solvent relaxation in the excited state) [Lakowicz, 2006a].
A Dluorescence spectrum consists in registering the emission intensity of the sample at different wavelengths with a constant excitation radiation of opportune energy. Conversely, the excitation spectrum records the dependence of emission intensity at a single wavelength as a function of the excitation wavelengths.
A quantitative way to characterize the relative importance of the radiative relaxation pathway is the so‐called quantum yield, q, which is
deDined as the ratio between emitted photons, nf and absorbed photons, na (Equation E2.1):
q
=
n
fn
a=
k
Rk
R+ k
NR (E2.1)where kR and kNR are the rate constants for the radiative (Dluorescence
emission) and nonradiative decay, respectively. Therefore, this quantity represents the probability that an excited system returns to the ground state by emitting a photon.
Another important parameter is the Dluorescence lifetime of the probe. When a population of identical Dluorophores is excited by a short light pulse, the time evolution of the emitted intensity can be represented by a single exponential function (Equation E2.2).
F t
( )
= F
0e
− k(
R+ kNR)
t= F
0
e
− t τ (E2.2)where F0 and F(t) are the Dluorescence intensities measured just after
the pulse (at t=0 s) and a given time t, respectively. The Dluorescence lifetime τ is the average time that molecules spend in their excited state before returning to ground state; therefore, by deDinition, it is the reciprocal of the sum of the rate constants of all decay processes (Equation E2.3)
τ =
1
k
R+ k
NR (E2.3) In the absence of non radiative decay, the Dluorophore lifetime is called intrinsic lifetime and is given by Equation E2.4.τ
0=
1
k
R=
1
A
Em (E2.4)where AEm is the Einstein’s coefDicient for spontaneous emission. By
combining equations (E2.3) and (E2.4) it can be shown that the quantum yield is related to the lifetime (Equation E2.5).
q
=
k
Rk
R+ k
NR=
τ
τ
0 (E2.5)Fluorescence measurements can be broadly classiDied into two types of measurements: steady‐state and time‐resolved. Steady‐state measurements are those performed with constant illumination and observation. The sample is illuminated with a continuous beam of light, and the intensity or emission spectrum is recorded. Because of the ns timescale of Dluorescence, most measurements are steady‐state measurements. When the sample is Dirst exposed to light, steadystate is reached almost immediately.
The second type of measurement is time‐resolved, which is used for measuring intensity decays. For these measurements the sample is exposed to a pulse of light, where the pulse width is typically shorter than the decay time of the sample. This intensity decay is recorded with a high‐speed detection system that permits the intensity to be measured on the ns timescale.
It is important to understand the relationship between steady‐ state and time‐resolved measurements. A steady‐state observation is simply an average of the time‐resolved phenomena over the intensity decay of the sample [Lakowicz, 2006a].
SOLVENT AND ENVIRONMENTAL EFFECTS
Fluorescence spectra are usually sensible to the solvent polarity and the local environment of the Dluorophore. The effects of solvent polarity are the major origin of the Stokes shift.
In solution, solvent molecules surrounding the ground state Dluorophore have dipole moments that can interact with the dipole moment of the Dluorophore to yield an ordered distribution of solvent molecules around the Dluorophore. Transition between the ground and excited states in the Dluorophore produce a change in the molecular dipole moment, which ultimately induces a rearrangement of surrounding solvent molecules. The Franck‐Condon principle dictates that, upon excitation of a Dluorophore, the molecule is excited to a higher electronic energy level in a far shorter time‐frame than it takes for the Dluorophore and solvent molecules to re‐orient themselves within the solvent‐solute interactive environment. As a result, there is a
time delay between the excitation event and the re‐ordering of solvent molecules around the solvated Dluorophore (Figure 2.9), which generally has a much larger dipole moment in the excited state than in the ground state.
However, solvent relaxation usually takes place before the Dluorophore decays to the ground state, and causes a decrease in the energy of the excited state, whose amount depends on the polarity of the solvent. This is the reason of the high sensitivity of the Dluorescence spectra to the polarity of the Dluorophore’s environment.
Figure 2.9. Fluorophore‐solvent interactions. Ellipsoids represent Dluorophore (red), and solvent molecules (blue); yellow arrows indicate dipole orientation and relative magnitude.
FÖRSTER RESONANCE ENERGY TRANSFER
This process consists in the transfer of excitation energy from a Dluorophore in the excited state (donor) to a chromophore in its ground state (acceptor) without any emission or absorption of photons: it is caused by a resonance phenomenon due to the dipolar interaction between the donor and acceptor molecules. In order for this resonance to occur, it is necessary that the emission spectrum of the donor overlaps (at least partially) to the absorption spectrum of the acceptor. Being a stochastic process with a probability depending on the distance and mutual orientation between the two chromophores, energy transfer provides a wealth of structural information on the sample under investigation [Lakowicz, 2006a and Lakowicz, 2006g].
The energy transfer efDiciency EFRET, deDined as the probability
that an excited donor relaxes to the ground state by non radiative energy transfer, can be expressed as Equation E2.6:
E
FRET=
k
ETk
ET+ k
D0 (E2.6)where kET is the rate constant for energy transfer while
k
D0 is the rateconstant for all the other decay pathways, which take place also in the absence of acceptor molecules.
According to Förster theory [Förster, 1948], the dependence of the energy transfer efDiciency on the structural parameters can be expressed as:
E
FRET= 1+
2
3
κ
2r
R
0⎛
⎝⎜
⎞
⎠⎟
6⎡
⎣
⎢
⎢
⎤
⎦
⎥
⎥
−1 (E2.7)where r is the distance between the donor and the acceptor and κ2 a
parameter depending on their mutual orientation which, in the case of fast rotation of the probes, averages to 2/3; R0, called Förster radius, is
the characteristic distance corresponding to 50% energy transfer efDiciency (for κ2 =2/3). It is deDined as:
R
0=
2
3
αn
−4q
D 0J
⎛
⎝⎜
⎞
⎠⎟
1 6 (E2.8)where α is a constant (8.8 10‐25 M cm3), n is the refractive index of the
medium,
q
D0
is the quantum yield of the donor when no acceptor is present and J is the superposition integral between the Dluorescence spectrum of the donor (FD) and the absorption spectrum of the acceptor
(εA=molar extinction coefDicient), weighted by λ4 (λ being the
J
=
F
D( )
λ
ε
Aλ
4d
λ
0 ∞∫
F
D( )
λ
d
λ
0 ∞∫
(E2.9)Experimentally, energy transfer efDiciency can be measured both by steady‐state and time‐resolved Dluorescence, shown in Equation E2.10.
E
FRET= 1−
q
DAq
D0= 1−
τ
DAτ
D 0 (E2.10)In Equation E2.10, qAD (τAD) and q0D (τ0D) are the donor quantum
yields (lifetimes) measured in the presence and in the absence of the acceptor, respectively. If the energy transfer acceptor is a Dluorophore, steady state FRET efDiciency can also be experimentally determined, by measuring the increase of its emission signal after interaction with the donor. In particular, when donor molecule are absent, the acceptor Dluorescence intensity (at the excitation wavelength used in FRET experiments) is expressed in Equation E2.11:
where qA and AA are the quantum yield and the absorbance of the
acceptor respectively, and the superscript refers to the absence of donor.
In the presence of donor molecules, this quantity increases, due to energy transfer according to Equation E2.12:
F
AD∝ q
AA
A+ E
FRETq
AA
D (E2.12) Here, FDA is the Dluorescence intensity of acceptor in the presenceof donor molecules and AD is the absorbance of the donor at the
excitation wavelength.
Combining Equations E2.11 and E2.12, the relative increase in the acceptor Dluorescence as a function of transfer efDiciency can be easily obtained (Equation E2.13):
F
ADF
A0=
q
AA
A+ E
FRETq
AA
Dq
AA
A= 1+
A
DA
AE
FRET (E2.13) FLUORESCENCE ANISOTROPYAnisotropy measurements are commonly used in the applications of Dluorescence to biomolecules, and provide information on the size and shape of proteins or the rigidity of their molecular environment. Anisotropy measurements are particularly useful to study association
process or the local viscosity of the Dluorophore’s environment [Lakowicz, 2006a].
In this technique the sample is excited by linearly polarized light: the probability of excitation of a given molecule is proportional to cos2θ
(where θ is the angle between the excitation transition dipole of the probe and the polarization direction). Consequently, a “photoselection” is performed, and the excited molecules have their transition dipoles oriented preferentially in the direction of the excitation radiation. The emission photons have a polarization direction that is again distributed with a cos2θ law with respect to the emission transition dipole
orientation. Therefore, in the absence of diffusional motions, the emitted light is anisotropic: the Dluorescence polarized parallel (I//)
with respect to the excitation polarization direction is more intense than the perpendicular one (I⊥) [Lakowicz, 2006a].
To characterize on a quantitative basis this phenomenon, an experimental observable called Dluorescence anisotropy, r, is introduced in Equation E2.14:
r
=
I
/ /− I
⊥I
/ /+ 2I
⊥ (E2.14) The anisotropy is a dimensionless quantity that is not dependent on the total intensity of the sample.For a completely polarized Dluorescence I⊥=0 and therefore r=1,
Actually, the maximum observable anisotropy (called fundamental or limiting anisotropy and observable by performing measurements on a diluted sample in glycerol at –20 °C) is <1, and in particular is deDined as:
r
0=
3cos
2
θ − 1
5
(E2.15)where θ is the angle between the absorption and emission transition dipoles of the Dluorescent probe: in the case of parallel transition dipoles (θ =0) a limiting value of 0.4 is obtained [Lakowicz, 2006f].
Measurement of r provides information about the relative angular displacement of the Dluorophore between the times of absorption and emission. In Dluid solution most Dluorophores rotate extensively in 50 to 100 ps. Hence, the molecules can rotate many times during the 1–10 ns excited‐state lifetime, and the orientation of the polarized emission is randomized. For this reason Dluorophores in non‐ viscous solution typically display anisotropies near zero. The effects of rotational diffusion can be decreased if the Dluorophore is bound to a macromolecule. Moreover, measurements of Dluorescence anisotropy are sensitive to any factor that affects the rate of rotational diffusion. The rotational rates of Dluorophores in cell membranes also occur on the nanoscale timescale. Therefore, measurements of Dluorescence polarization are widely used to study the Dluidity and mobility of biological membranes.
2.4.2. Experimental details INSTRUMENTAL APPARATUS
Emission spectra and anisotropy values were obtained by steady‐state Dluorescence experiments on a thermostated Fluoromax‐2 Dluorimeter (Horiba Jobin Yvon). Anisotropy experiments were performed by equipping the spectroDluorimeter with Glan‐Thomson polarizer prisms.
Time‐resolved Dluorescence measurements were performed on a Lifespec‐ps setup (Edinburgh Instruments) equipped with automatic Glan‐Thompson polarizers, a cooled micro‐channel plate detector, and a 298 nm pulsed diode laser (1 ns pulse width) and working in the time‐ correlated single photon counting mode.
WATER‐MEMBRANE PARTITION
Tryptophan emission spectra were recorded as follows: λexc=280 nm
and λem=300‐450 nm, slits 1 and 5 nm for excitation and emission
respectively, integration time 1 s. Fluorescence spectra were recorded some minutes after the vesicles addition, to allow the equilibration. LIPOSOMES’ RELEASE
PMAP‐23 and its analogues were incubated with ePC/ePG vesicles (lipid concentration 0.2 mM), containing 30 mM 5,6‐carboxyDluorescein. Trypsin was in a Dinal concentration of 50 μg/mL. The CF Dluorescence intensity was measured by setting the following parameters: λexc=490
nm, λem=520 nm, integration time 0.2 s. Triton X‐100 was added at a

![Figure
1.6.
Model
of
a
membrane‐bound
conformation
of
trichogin
GA
IV
[Epand
et
al.,
1999].](https://thumb-eu.123doks.com/thumbv2/123dokorg/7605461.114792/19.630.170.463.88.300/figure-model-membrane-bound-conformation-trichogin-ga-epand.webp)


![Figure
3.5.
Fraction
of
F10
molecules
participating
in
peptide
aggregates,
as
a
function
of
total
peptide
concentration
[Stella
et
al.,
2004].](https://thumb-eu.123doks.com/thumbv2/123dokorg/7605461.114792/71.630.163.467.411.660/figure-fraction-molecules-participating-aggregates-function-concentration-stella.webp)

