ALMA MATER STUDIORUM - UNIVERSITÀ DI BOLOGNA
D
IPARTIMENTO DI
S
CIENZE E
T
ECNOLOGIE
A
GRO
-A
LIMENTARI
C
AMPUS DI
C
ESENA
C
ORSO DIL
AUREAM
AGISTRALE IN SCIENZE E TECNOLOGIE ALIMENTARIT
ITOLO DELLAT
ESIPreliminary 1H NMR relaxation study of whey protein gels as model systems for protein digestion: the effect of concentration, temperature and pH.
Tesi in
69162 CHIMICA STRUTTURALE DEI SISTEMI BIOLOGICI
BIP-80424 MSc THESIS BIOPHYSICS
Anno Accademico 2018/2019
Relatore:Chiar.mo Prof. Francesco Capozzi
Correlatori:
Prof. Gianfranco Picone dr. Henk Van As
Wageningen University & Research, Netherlands
dr. Camilla Terenzi
Wageningen University & Research, Netherlands
Candidato: Antonella Pacillo
2
Table of contents
Table of contents ... 2
Abstract ... 4
Outline of the thesis ... 5
1. Introduction ... 5
Context of the study ... 5
Nuclear Magnetic Resonance (NMR) ... 9
Spin-spin and spin-lattice relaxation processes... 14
Origins of relaxation ... 14
Equations for 𝑇1 and 𝑇2 time-evolutions ... 15
Molecular dynamics ... 16
Molecular dynamics as probed by 𝑇1 and 𝑇2 measurements ... 20
Measurement of 𝑇1 by Inversion-Recovery ... 20
Measurement of 𝑇2 by the CPMG sequence ... 21
Two-site chemical exchange theory ... 24
Two-dimensional (2D) Time-Domain (TD) NMR ... 28
2. Aim of the thesis ... 30
3. Materials and Method ... 31
Materials ... 31
Preparation of gel samples ... 31
Low-field 1H NMR relaxometry ... 31
High-field 1H NMR relaxometry ... 32
4. Results and discussion ... 34
Effect of protein concentration, temperature and pH on relaxation times ... 34
WPI gels prepared at different concentration, measured at room temperature (RT) and 37°C ... 34
WPI gel at 15 %w/w prepared at different pH, measured at RT and 37°C .. 40
Summary ... 42
Water/protein chemical exchange ... 43
3
Appendices ... 50
Appendix A: Description and composition of WPI powder ... 50
... 50
Appendix B: 𝑇2 distribution profiles obtained by ILT at RT ... 51
Appendix C:𝑇2 distribution profiles obtained by ILT at 37°C ... 52
Appendix D: T2 distribution profiles obtained by ILT for WPI 15 %w/w at different pH ... 53
Appendix D: Spectrum of WPI 15% w/w at 300 MHz ... 53
Appendix E: 1H NMR spectrum of WPI 15% w/w acquired at RT and 300 MHz ... 54
4
Abstract
Nel presente lavoro di tesi, gli effetti del pH e della concentrazione proteica sulla conformazione strutturale di whey protein gels sono stati sperimentalmente esplorati mediante rilassometria 1H NMR, a due diverse temperature di
misurazione, temperatura ambiente e 37°C. Conoscere come le diverse condizioni fisiche influenzano i parametri NMR sensibili alle dinamiche molecolari
permetterebbe di valutare la possibilità di impiegare questa tecnica per stimare la digeribilità delle proteine. Infatti, l’attività di tesi si inserisce come studio
preliminare in un progetto coordinato dall’Università di Wageningen, il cui scopo principale è studiare ed ottimizzare l’impatto che i processi industriali hanno sulle caratteristiche di digeribilità delle proteine del latte negli alimenti per infanti. Il metodo analitico utilizzato sfrutta i principi della spettroscopia di risonanza magnetica nucleare (NMR) a basso campo, un metodo basato sulle proprietà magnetiche di nuclei di alcuni isotopi, il cui obiettivo è quello di ricavare informazioni importanti di struttura e dinamica molecolare utilizzando campi magnetici statici e pulsati. In particolare, le proteine sono state caratterizzate mediante NMR mono (1D) e bi-dimensionale (2D), e analizzando il profilo di dispersione del rilassamento trasversale dovuto al chemical exchange, ossia il trasferimento di un nucleo da un ambiente molecolare ad un altro. I campioni sono stati preparati seguendo protocolli standard così che i gels di proteine potessero avere proprietà simili a quelle ritrovate in letteratura, mentre le misurazioni sono state condotte con uno spettrometro NMR a 30 MHz. Nonostante alcune
complicanze legate a limiti tecnici durante lo studio del chemical exchange, questi primi risultati sembrano essere promettenti nell’ottica di estendere il lavoro allo sviluppo di markers (parametri chimico-fisici) MRI in vitro, per poi poterli confrontare con quelli in vivo in modo da migliorarli ed ottimizzarli.
Parole chiave: rilassometria – NMR – chemical exchange – transverse relaxation
5
Outline of the thesis
The first chapter of this thesis gives a short background to the application of NMR in food science, and its usefulness for studying whey protein gels; it provides also an introduction to the principles and theory behind NMR and methods used in this study.
Chapter 2 presents the main objective, which was to investigate post-processing effects on molecular dynamics in whey protein gels by using 1D and 2D TD-NMR, in order to find NMR markers for follow-up the gastric digestion of protein in the stomach. The work can be considered as an initial exploration, a preliminary study in fact, of a bigger project, on the verge of starting, which aims to use magnetic resonance techniques to monitor the gastric digestion of proteins and bridging the gap between in vitro model systems and in vivo digestion (13). The study was divided in two different parts, namely on 1) effect of protein concentration and pH on relaxation times measured at two different temperatures, and 2) chemical exchange of protons between water and protein sites.
Chapter 3 gives a description of the materials and methods chosen in this study, while the results are presented and discussed in Chapter 4.
Finally, Chapter 5 contains the conclusions drawn from this work and some suggestions for further studies, while in the “Appendixes” section additional related works not included in the thesis are reported.
1. Introduction
Context of the study
Food science is a multidisciplinary field, which brings together chemistry, microbiology, engineering and physical sciences to study the nature of food, ways to prevent deterioration and to improve the quality. Most foods have a complex and heterogeneous micro-to-macrostructure consisting of different components, such as water, lipids, proteins, carbohydrates, but also colorants, flavors, vitamins, phenolic compounds, and minerals (21).
These compounds are found in a wide range of concentrations, and may be subjected to different dynamic modifications due to molecular motions, chemical and enzymatic reactions, in turn influenced by numerous factors, such as climatic conditions, agronomic/processing practices, types of storage and conservation (21). Therefore, the evaluation of the consequences in terms of composition, texture, digestibility, etc. of those modifications on foodstuffs is essential since it can provide food scientists with valuable information. On the other hand, the existing characterization methods are often destructive and, thus, can cause partial, or even full, loss of information about textural properties and three-dimensional architecture of the food. These attributes are fundamental in order to assess and
6
value final food products in the same way as the consumer does, which is mainly based on sensory characteristics, such as taste, crispness and breakdown (1). For these reasons, the key challenge to the food scientist is to be able to analyse the composition and properties of foodstuffs in a non-invasive and non-destructive manner. One of the most powerful and versatile techniques capable of performing these tasks is nuclear magnetic resonance (NMR), which has become increasingly popular in food science thanks to its capability to study in situ complex, heterogeneous and optically-opaque foodstuffs both in terms of microstructure and molecular dynamics.
Among the most complex food matrices there is milk, a multi-component colloidal suspension, and its derived products. Milk is a complex mixture of specific bio-active proteins, lipids and saccharides, which have a nutritious value not only to the child, but also to the adult and the elderly. Furthermore, milk contains also numerous biologically-active substances, such as immunoglobulins, enzymes, antimicrobial peptides and growth factors (11, 15, 43). However, one major part of milk, namely whey, has traditionally not been paid much attention for many years, since it is a by-product of cheese production. Whey is the watery substance remaining after coagulation of the casein in milk, either through the addition of acid, or through the action of a protease such as chymosin (34). Most of it was disposed of by feeding to animals, or running to waste. Recently, however, its importance has been recognized and different processes have been developed for the conversion of whey liquid into a range of several food ingredients, such as whey protein concentrate (WPC) or isolate (WPI). The protein fraction in whey constitutes approximately 10% of the total dry solids, and it is a mixture of mainly β-lactoglobulin and α-lactalbumin, which constitute, respectively, ~50% and ~12% of the protein fraction; the rest consist of immunoglobulins, bovine serum albumin, proteose peptones, and other minor proteins (16). Whey proteins are now used widely in food industry, not only for their health benefits beyond basic nutrition (52), but also for their functions in food quality and stability: they have the ability of forming interfacial films that stabilize emulsions and foams (17), as well as the ability of forming gels upon heating (16).
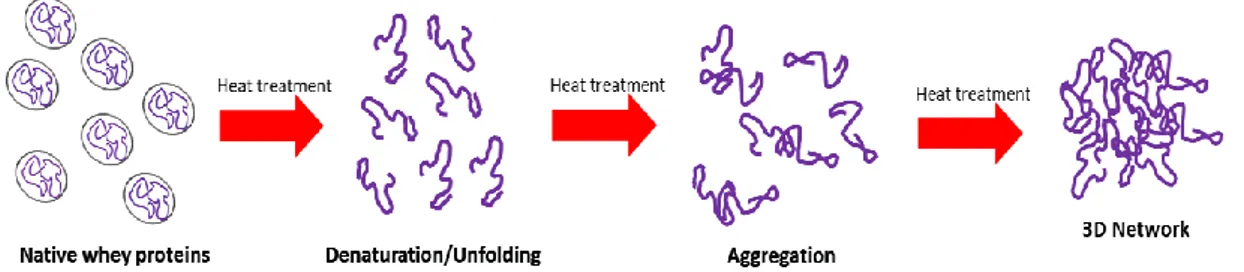
The gelling ability of proteins provides important textural and water-holding properties, improving the texture of protein-based foods. The mechanism of forming gels have been the subjects of many studies (48, 28, 23, 16, 31), but it is not yet completely understood. Nowadays, the process of gelation is considered as the result of several steps and reactions. Firstly, the denaturation unfolds a native protein so that functional groups are exposed. Then, these exposed groups may rearrange to form aggregates, which tend to bind resulting in a three-dimensional gel network, as shown in Fig.1 (39).
7
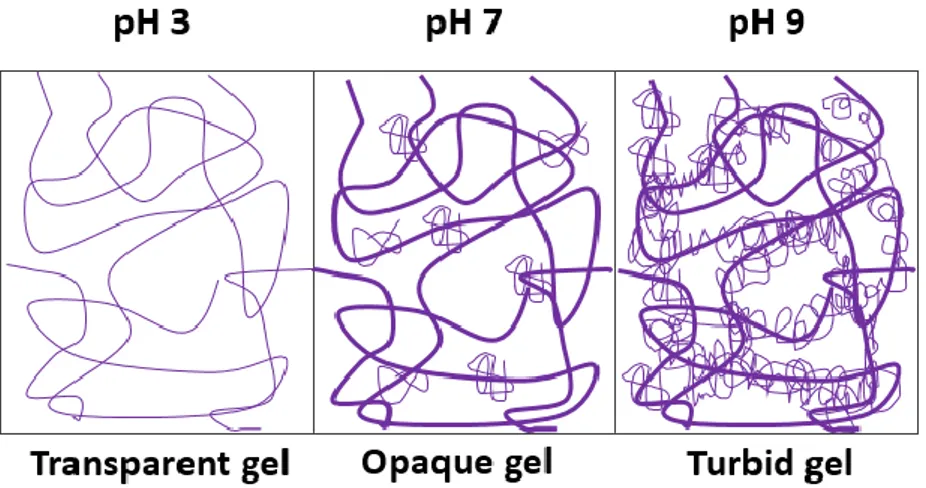
There are several factors which affect the gelling process. In fact, a protein gel consists of a network of protein particles, and the spatial distribution of these particles and the covalent and non-covalent bonds contribute to the functionality of the network. In addition to the intrinsic properties of the protein, such as hydrophobicity, amino-acid composition, di-sulphide bonds and concentrations of the proteins, gelling properties depend also on the conditions applied during gelation. As an example, the alteration of heat treatment conditions affects the gel’s macroscopic and microscopic structural attributes, by changing the rates and mechanism of denaturation and aggregation (6). The texture of WPI gels is affected due to changes in the secondary structure of the individual whey protein during heat treatment: between 60° and 70°C, denaturation of whey proteins increases slowly with reversible changes. Above this temperature, the changes become irreversible: denaturation of α-lactalbumin increases the viscosity, while denaturation of β-lactoglobulin results in gel formation (6, 14). The pH has a profound effect on heat-induced gelation reactions, which can be considered as governed by a balance between attractive and repulsive forces (7). Figure 2 depicts how pH influences the final gel properties during heat-induced gelation: generally, at low pH, far from the iso-electric point (pI) of the protein, the formation of aggregates is slower and leads to less elastic and weaker gels than those formed at pH 7 to 9.
Figure 1. Illustration of heat-induced gelation in whey proteins. Elaborated from Alting, 2003.
8
Figure 2. Relation between protein gel microstructure and pH at a micrometer length scale. Figure elaborated fromAlting, 2003.
In the present thesis work, the effects of pH and protein concentration, at a fixed sample preparation temperature of 90°C, have been experimentally investigated by means of 1H NMR relaxometry at two different measuring temperatures, namely room temperature (RT) and 37 °C. The temperature during sample preparation was kept fixed at 90 °C, as described in standard protocols, in order to obtain stable WPI gels with properties similar to those typically found in the literature (32, 13). The effect of changing the measuring temperature on relaxation times is poorly understood, and the literature on this issue is scant. The measurement temperature of 37°C was chosen in order to explore post-processing structural-dynamical effects under conditions close to that of in vivo digestion. Under such conditions, knowledge of how pH and protein concentration affect NMR parameters that are sensitive to molecular dynamics in the WPI gel, such as spin relaxation or self-diffusion, is key to understanding how food preparation steps may alter protein functionality and, in turn, the nutritional and immunological properties of protein-based foods. To this purpose, this experimental thesis work has been based on 1H NMR relaxation measurements, well established as a powerful characterization tool of dynamic processes in multi-component food systems (36, 54, 42). In fact, food can be considered as a heterogeneous system comprised of multiple constituents with distinct molecular mobility and, therefore, distinct NMR relaxation and/or diffusive properties. More specifically, changes in structural properties have a great influence on the two major NMR spin relaxation phenomena, namely longitudinal relaxation and transverse relaxation, that consequently can be used as a probe of molecular dynamics.
The next section contains a brief description about NMR applications in food science and a general explanation of the most fundamental NMR concepts that are needed to understand 1D and 2D NMR experiments carried out in this work.
9
Nuclear Magnetic Resonance (NMR)
NMR is a powerful experimental technique, whose physical phenomenon was discovered independently by Bloch (56) and Purcell (45), who both received the Nobel Prize in Physics in 1952 “for their development of new methods for nuclear magnetic precision measurements and discoveries in connection therewith.”
Since then, NMR methods and instrumentations have been developed and applied to a wide variety of fields, such as biology, chemistry, medicine and physics. However, the applications of NMR in food science were delayed until the 1970s, due to the lack of scientific expertise and high cost of equipment (54, 35). By combining the unique microstructural-dynamical information that can be obtained by NMR with the highly flexible and versatile of low- and high-field spectrometers, this technique has become an important tool for food analysis (1).
1H NMR experiments can be performed on the three main states of matter, namely
liquid, solid and gas, and under a wide range of sample conditions, allowing to study also kinetic processes such as rehydration, drying, freezing and gelation at variable temperature conditions. Furthermore, NMR can be also hyphenated with other techniques, like HPLC (or LC) and MS, to increase its capability of solving identification of unknown compounds (50).
The main advantages of NMR and Magnetic Resonance Imaging (MRI) methods, and combinations thereof, lie in their chemical, physical and/or spatial resolution. In NMR spectroscopy, each of the resonances present in a spectrum is characterized by its own chemical shift, measured in ppm, which varies depending on the local chemical environment. In MRI, by applying magnetic field gradients distinction between nuclear spins from different locations in the sample can be obtained. In addition, NMR/MRI methods (i) are non-destructive, thus analyses can be repeated on the same sample, (ii) do not require any ad hoc preparation or chemical modification of the sample, (iii) are applicable to optically-opaque materials, (iv) are motion-sensitive, which enables contrast between molecules with different mobility, (v) can detect many different NMR-active nuclei, allowing the study of a large variety of chemically-complex systems. More specifically within the dairy field, 1H, 13C and 31P NMR measurements have been used to improve the
chemical information of the same sample (4). In 1999 Belloque et al. published a review of the application of NMR techniques in dairy systems, ranging from investigations which aim to get a deep knowledge of the mechanism underlying the macroscopic processes, to the study of tools (like structural changes or water interactions) useful for quality control and authentication, demonstrating the versatility of NMR spectroscopy. Nowadays, NMR is more widespread and used in dairy science and industry.
10
Some of the most used NMR methods in food science are: high-resolution spectroscopy, time-domain NMR (TD-NMR), and Rheo-MRI. The latter is an efficient hyphenated technique used to characterize food materials and complex fluids: it combines elements of rheometry with NMR methods to characterize nonsolid materials by studying their response to mechanical deformation (19). For example, in the case of fluid food materials such as pastes, emulsions and liquid suspensions, direct measurements of velocity maps can be provided, giving information about structural features of them (47). Despite its potential usefulness, Rheo-MRI could not be use in this work since the shear stress induced by rheometric devices may break the structure of the whey protein gels. Rheological tests suitable for these materials are, instead, those which apply small deformation, like stress relaxation tests, creep compliance and dynamic shear stress, allowing for studying the linear viscoelastic region. In this thesis work, instead, TD-NMR was used for whey protein gels in the form of spin relaxation measurements. This chapter gives an introduction to the basic concept of NMR, with a particular attention to relaxation and chemical exchange theory.
The NMR principle is based on the fact that nuclei of atoms have magnetic properties that can be utilized to obtain chemical and physical information. From a quantum mechanical point of view, subatomic particles (protons, neutrons and electrons) possess a property called nuclear spin, which is central in NMR. These spins can be paired in some atoms (e.g. 12C, 16O, 32S), cancelling each other so that the nucleus of the atom has no overall spin. In certain isotopes, instead, the nucleus contains an odd number of protons and/or neutrons, generating a magnetic moment (𝜇) and angular moment (𝐼). The two quantities are related through the expression:
𝜇 = γ𝐼 [1]
where γ, the gyromagnetic ratio, is a constant characteristic of a particular nucleus, that for 1H is 42.58 MHz/T and 10.71 MHz/T for 13C.
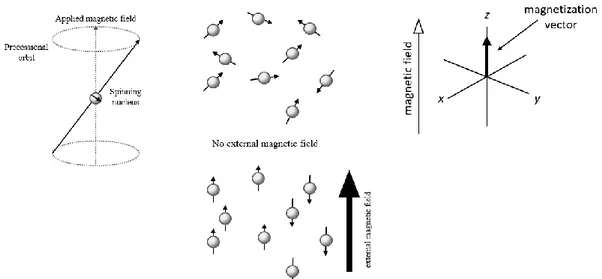
In the absence of an external magnetic field, the individual nuclear magnetic moments are randomly oriented and the net magnetization vector is considered to be zero. When the nucleus is placed in a static magnetic field, 𝐵0, parallel to the 𝑧-component of the magnetic moment, its magnetic moment will interact with this field resulting in an angular precession around the 𝑧-direction of 𝐵0. (Fig. 3) The frequency 𝜔0 of this precession of the nucleus is called Larmor frequency, and is proportional to the strength of the applied field:
11
𝜔0 = γ𝐵0 [2]
During the application of this static magnetic field, the individual magnetic moments align themselves along or opposite to 𝐵0, precessing around 𝐵0. Parallel and antiparallel hydrogen nuclei have equal, but opposite, magnetic moments and cancel each other out. However, there are always slightly more hydrogen nuclei parallel to 𝐵0, and this slight difference gives rise to a net magnetization 𝑀0 along the direction 𝐵0.
For a spin-1/2, the two energy states have different population - the lower energy state is more populated than the higher one - and the energy gap (𝛥𝐸) between the energy levels depends on the gyromagnetic ratio and the external magnetic field according to this equation:
∆𝐸 = γℏ𝐵0 [3]
where ℏ is the reduced Planck’s constant. The net magnetization can be represented by a vector pointing along the direction of the applied field (𝑧), as shown in Fig. 3 (c).
a b c
Figure 3. (a) A nucleus with spin quantum number ½, that, in the presence of a magnetic field, precesses around it. (b) Alignment of nuclear spins after an external magnetic field is applied. (c) Net magnetization along the 𝑧 axis when the sample is at equilibrium.
12
When the magnetization vector is aligned along 𝐵0, it is not possible to measure any signal since the detection coil is placed along 𝑥- and 𝑦- axis. In order to do that, the system needs to be perturbed. This is done by applying a radiofrequency (r.f.) pulse, e.g. a 90º pulse, represented by the r.f. field 𝐵1 in a
direction perpendicular to that of 𝐵0. Then, the magnetization vector is tipped into the 𝑥𝑦-plane that is transverse to 𝐵0. While in this plane, the magnetization rotates around the direction of 𝐵0. The precession of the net magnetization vector is what is actually detected in an NMR experiment: it creates a voltage in a receive coil, which is acquired for subsequent processing.
In the static laboratory frame, when the r.f. pulse 𝐵1 is applied the result is
a magnetic field which oscillates along the x axis. For a better understanding of how this happens, since 𝐵1 is a very small magnetic field compared to 𝐵0, the rotating
frame theory has to be introduced to simplify the complex motion of precessing spins before, during, and after the r.f. excitation (27). In such a co-ordinate system which rotates about the 𝑧 axis at the same Larmor frequency as 𝐵1, the 𝐵1 appears to be static and directed along the 𝑥 axis of the rotating frame. The difference Ω between the Larmor frequency in the fixed frame (𝜔0) and the frequency in the
rotating frame (𝜔𝑟𝑜𝑡.𝑓𝑟𝑎𝑚𝑒) is called offset and is given by:
Ω = 𝜔0− 𝜔𝑟𝑜𝑡.𝑓𝑟𝑎𝑚𝑒 = −γΔB [4]
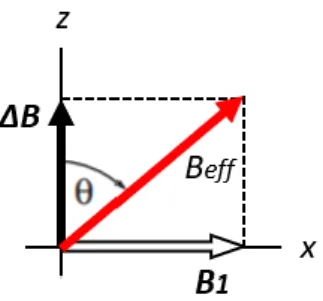
If the rotating frame rotates at the same frequency as the fixed frame, the magnetization will appear not to move and the offset will be zero. Consequently, it means that also the apparent magnetic field in the rotating frame must be equal to the actual applied field. This apparent magnetic field in the rotating frame is called the reduced field, Δ𝐵. Therefore, when an r.f. field is being applied there are two magnetic fields in the rotating frame: the 𝐵1 field, and the reduced field 𝛥𝐵. In the rotating frame, the reduced field (which is along 𝑧) and the r.f. or 𝐵1 field (which is along 𝑥) add vectorially to give an effective field, 𝐵𝑒𝑓𝑓, as illustrated in Fig. 4.
The size of this effective field is given by:
𝐵𝑒𝑓𝑓 = √𝐵12+ Δ𝐵2
[5]
To conclude, also if 𝐵0 is much larger than 𝐵1, we can affect the
magnetization with 𝐵1 by making it oscillate close to the Larmor frequency, so that the offset is small, or zero, and the effective field and the magnetization lie close to the 𝑥𝑦-plane. The angle between Δ𝐵 and 𝐵𝑒𝑓𝑓 is called the tilt angle (27).
13
Figure 4. The effective field 𝐵𝑒𝑓𝑓 in the rotating frame, represented as the sum of the
reduced field 𝛥𝐵 and 𝐵1 field.
The precession of the magnetization vector induces a signal in the detector coil that can be amplified and recorded: this is the so-called free-induction decay (FID) signal, which will eventually decay due to the action of relaxation. Then, by performing Fourier analysis on the received signal, the time domain FID can be converted into a frequency domain spectrum. The entire process, from the application of the static magnetic field 𝐵0 to the data processing, is summarized in Fig. 5.
Figure 5. When a stationary magnetic field is applied, nuclei tend to align parallel or antiparallel with it (a). The dipoles oriented against the 𝐵0 are less stable and are present in
a lower population, which give rise to the net magnetization (b). When the sample is irradiated with a r.f. pulse, the net magnetization changes (c), and when the system goes back to its initial state, a signal is induced in the coil and recorded (d). The radiofrequency spectrum is then obtained by applying the Fourier transform (e).
14
Spin-spin and spin-lattice relaxation processes
Origins of relaxation
The major molecular-scale mechanisms underlying 𝑇1 and 𝑇2 relaxation are here
summarized.
➢ Dipole-dipole interaction: each particle can be considered as a tiny magnet whose electromagnetic fields interact through space. This interaction is the major source of relaxation for nuclear spin with 𝐼 = 1/2. Three major factors determine the strength of the dipolar interaction: (1) types of spins, a electron dipolar interaction is much more powerful than a proton-proton interaction due to a larger gyromagnetic ratio of the electron; (2) their distance, in fact intramolecular interactions are much more effective than intermolecular; (3) molecular motion, that determines the degree of relaxation: if the spin resides on a molecule that is rotating at frequency close to the Larmor frequency, the conditions are optimal to cause 𝑇1 relaxation. Conversely, if the molecule is hardly moving, the dipolar field will be static producing a dephasing and predominantly 𝑇2 relaxation. ➢ Chemical Shift Anisotropy (CSA): chemical shifts are dependent on the
orientation of the molecule relative to 𝐵0. If the molecule is rapidly tumbling, directional asymmetries average out and CSA is not important. On the contrary, if the molecule is restricted in its motion, then the CSA effects may be important. This relaxation mechanism is proportional to 𝐵02
and therefore it is more important at higher fields.
➢ Flow and Diffusion: any physical process that causes movement of molecules between different environments can enhance relaxation when the external magnetic field is not uniform.
➢ Chemical Exchange: hydrogens atoms are frequently involved in chemical exchange processes, in which they are physically transferred from one molecule to another, or also by residing on a molecule that changes its structure. In both cases, the experienced environment is different and different will be the relaxation.
➢ Scalar (J)-Coupling: it is a through-bond interaction, in which two nuclear spins interact through distortions in electron clouds. This contrasts with dipole-dipole interactions that occur via direct electromagnetic interactions "through space" and do not require an electron cloud intermediary.
➢ Interaction with unpaired electrons: paramagnetic species in solution are particularly effective at promoting relaxation since the interaction is very large but it has a short distance range.
15 Equations for 𝑇1 and 𝑇2 time-evolutions
The return of a perturbed magnetic state of nuclear spins into equilibrium can be analyzed in terms of two separate processes, each with their own time constants, called spin-lattice relaxation and spin-spin relaxation.
The mechanism involved for the two relaxation processes are different: the spin-lattice relaxation re-establishes the spin population (of the longitudinal component of magnetization, 𝑀𝑧), while the spin-spin relaxation indicates the loss
of phase coherence of the 𝑀𝑥,𝑦 components of magnetization between different spin states.
The reciprocal of the spin-lattice, or longitudinal, relaxation time 𝑇1 is the time needed for 𝑀𝑧, to return to its thermodynamic equilibrium by means of energy
transfer from the nuclear spins towards the ‘lattice’, or external environment, through collisions, rotations or electromagnetic interactions. The lattice represents the ensemble of non-spin degrees of freedom of the system. The equation governing this time evolution as a function of time 𝑡 when the inversion recovery sequence (see Section “Pulse sequences for measuring 𝑇1 and 𝑇2”for more details) is used is:
𝑀𝑧 = 𝑀0(1 − 2𝑒−𝑡 𝑇⁄ 1) [6]
Therefore, 𝑇1 can be viewed as the time required for 𝑀𝑧 to reach about 63% of its maximum value 𝑀0.
Whereas longitudinal (𝑇1) relaxation causes a loss of energy from the spins, spin-spin relaxation occurs by dephasing, or loss of phase coherence, between spins. The equation which describes this phenomenon is (see Section “Pulse sequences for measuring 𝑇1 and 𝑇2” for more details on the parameters):
𝑀𝑥𝑦 = 𝑀0· 𝑒−𝑛𝑡𝐸⁄𝑇2 [7]
Several factors may contribute to the measured decay of the transverse magnetization; among the most important there are:
1. Spin dephasing in the presence of intra- and inter-molecular dipolar interactions, governed by the ‘true’ 𝑇2 (10).
16
2. Spin dephasing due to spatial variations in 𝐵0 and/or in internal magnetic
susceptibility properties of the sample (inhomogeneous 𝑇2, 𝑇2𝑖𝑛).
3. Chemical exchange between different molecular environments (𝑇2,𝑒𝑥𝑐ℎ). 4. Diffusion caused by “background” instrumental magnetic field
inhomogeneities (𝑇2𝑏𝑔).
The linear combination of the rates (𝑅2 = 1/𝑇2) from the above factors is what governs the experimentally observed decay of the transverse magnetization. The effective transverse rate constant 1/𝑇2∗ is given by:
1 𝑇2∗ = 1 𝑇2 + 1 𝑇2𝑖𝑛+ 1 𝑇2,𝑒𝑥𝑐ℎ+ 1 𝑇2𝑏𝑔 [8]
𝑇2 is always less than or equal to 𝑇1, and in bulk small molecules, such as water, the 𝑇1/𝑇2 ratio is close to 1, while it may largely exceed this value in highly viscous liquids or in materials with liquid/solid interfaces, such as gels or porous media (49).
Molecular dynamics
Fundamental for determining 𝑇1 and 𝑇2 values is the random thermal motion of the molecule on which the hydrogen nucleus resides, which provides the time dependence to the local fields. A molecule can experience two kinds of motions, vibrations and overall rotation. Vibrations of bonds and bond angles take place at higher frequencies than the Larmor frequency, and therefore don’t affect the relaxation, unlike the overall rotation of a molecule, which result in the modulation of the local fields and therefore is a source of relaxation. However, the ability of the molecule to rotate depends on the density and size of molecules in the sample. This motion, called rotational diffusion, can be quantified by the rotational correlation time 𝜏𝑐, which is the average time it takes for a molecule to end up at an orientation
about 1 radian from its starting position. For small molecules 𝜏𝑐 turns out to be around 10 ps, rising to 10 ns for small proteins.
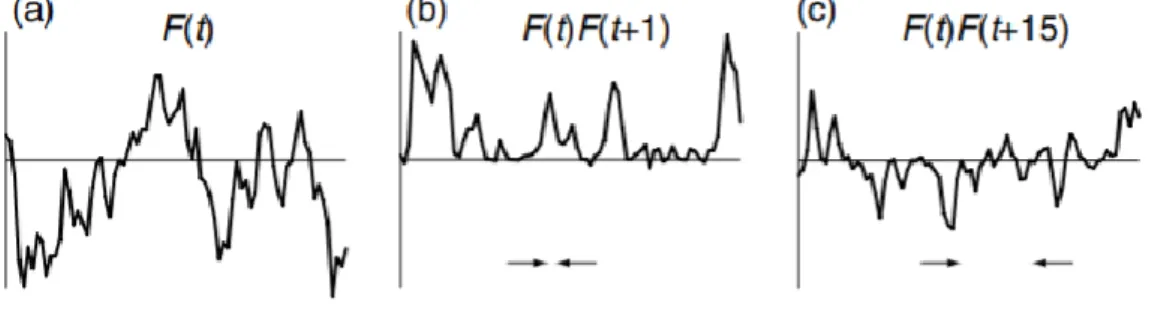
To characterize the time dependence of the random motion in the sample, the correlation function can be used. For a macroscopic sample, each spin experiences a different random field, 𝐹𝑖(𝑡). The average field experienced by the spins is found by adding up the fields for all members of the system:
17 𝐹(𝑡)
̅̅̅̅̅̅ = 𝐹1(𝑡) + 𝐹2(𝑡) + 𝐹3(𝑡)+... [9]
For random thermal motion, this ensamble average turns out to be independent of the time; this is a property of stationary random functions. Another important property is the correlation function 𝐺(𝑡, 𝜏), defined as
𝐺(𝑡, 𝜏) = 𝐹1(𝑡)𝐹1∗(𝑡 + 𝜏) + 𝐹
2(𝑡)𝐹2∗(𝑡 + 𝜏)
+ 𝐹3(𝑡)𝐹3∗(𝑡 + 𝜏)+..
= 𝐹(𝑡)𝐹̅̅̅̅̅̅̅̅̅̅̅̅̅̅̅̅̅̅ ∗(𝑡 + 𝜏)
[10]
𝐹1(𝑡) is the field experienced by spin 1 at time 𝑡, and 𝐹1∗(𝑡 + 𝜏) is the field
experienced at a time 𝜏 later; the star indicates the complex conjugate, which allows for the possibility that 𝐹(𝑡) may be complex. If the time 𝜏 is short the spins will not have moved very much and so 𝐹1∗(𝑡 + 𝜏) will be very little different from 𝐹1(𝑡). As
a result, the product 𝐹1(𝑡)𝐹1∗(𝑡 + 𝜏) will be positive. The same is true for all the
spins, so when the terms are added together, the result will be reinforced. As 𝜏 gets longer, the spin will have had more change of moving and so 𝐹1∗(𝑡 + 𝜏) will differ more and more from 𝐹1(𝑡), and their product will not be necessarily positive. The ensamble average of all these terms is thus less than it was when 𝜏 is shorter. In the limit, when 𝜏 is sufficiently long, the ensemble average, 𝐺(𝑡, 𝜏) goes to zero. 𝐺(𝑡, 𝜏) thus has it maximum value at 𝜏 = 0. This is illustrated in Fig. 6.
Figure 6. A plot of the random function 𝐹(𝑡) against time. From Keeler, 2013.
For stationary random functions, the correlation function is independent of the time 𝑡; it will therefore be written 𝐺(𝜏). The correlation function, 𝐺(𝜏), is thus a function which characterises the memory that the system has of a particular arrangement of spins in the sample. For times 𝜏 which are much less than the time it takes for the
18
system to rearrange itself, 𝐺(𝜏) will be close to its maximum value. As time proceeds, the initial arrangement becomes more and more disturbed, and 𝐺(𝜏) falls. For sufficiently long times, 𝐺(𝜏) tends to zero. The simplest form for 𝐺(𝜏) is
𝐺(𝜏) = 𝐺(0) exp (−|𝜏| 𝜏𝑐)
[11]
Where 𝜏𝑐 is the correlation time. For times much less than the correlation time the spins have not moved much and the correlation function is close to its original value; when the time is of the order of 𝜏𝑐, significant rearrangements have taken place and the correlation function has fallen to about half its initial value (27).
The correlation function is a function of time; it can be Fourier transformed to give a function of frequency. The resulting function is called the spectral density and gives a measure of the amount of motion present at different frequencies. Short correlation times have a broad spectral density function. This makes sense: molecules that tumble very rapidly can sample a wide range of frequencies. Molecules that tumble slowly and have very long correlation times only sample lower frequencies.
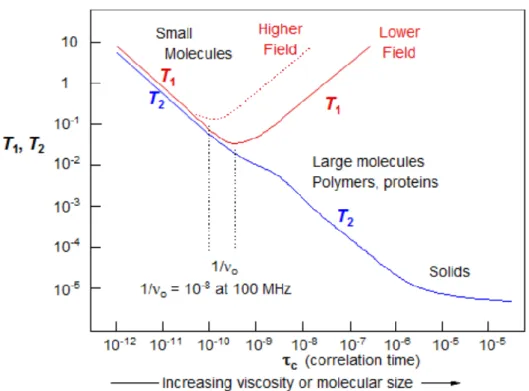
To appreciate more the influence of these dynamics on relaxation, 𝑇1 and 𝑇2 relaxation times has been plotted as a function of correlation time (Fig. 7). Water molecules, which are the source of most of the signal, can be found in three states which affect their tumbling. In mobile liquid near room temperature the average rates of molecular rotation are several orders of magnitude higher than the Larmor frequency, so only a very small fraction of the motions are at the proper frequency, leading to very inefficient relaxation (long 𝑇1). For larger molecules and more viscous solutions molecular motions become slower and more efficient relaxation results (short 𝑇1). However, at some point the average molecular motions become slower than 𝜔0, and 𝑇1 becomes longer again. Therefore, 𝑇1 and 𝑇2 depend on the rate of rotational motion of the molecules. In particular, 𝑇2 decreases if the mobility
19
Figure 7. Behavior of 𝑇1 and 𝑇2 as a function of correlation time.
Furthermore, the rotational correlation time 𝜏𝑐, depends also on other parameters. For globular proteins a spherical approximation can be used and the rotational correlation time is given by Stoke’s law:
𝜏𝑐 = 4𝜋𝜂𝑟
3
3𝑘𝑇 [12]
where 𝜂 is the (local) viscosity of the solvent, 𝑟 is the effective radius of the protein, 𝑘 is the Boltzmann constant and 𝑇 is the temperature (26). From this equation, it can be seen that 𝜏𝑐 is inversely correlated to the temperature; consequently, 𝑇1 and 𝑇2 should be smallest (the relaxation occurs faster) at higher temperature.
20
Molecular dynamics as probed by
𝑻
𝟏and
𝑻
𝟐measurements
When the irradiation energy is transmitted to the spinning nuclei, as mentioned above, the magnetization vector is moved in the 𝑥, 𝑦-plane: the angle of this rotation depends on the intensity and length of the 𝐵1 fieldtransmitted. A combination of pulses and delays is called pulse sequence, a collection of oscillating waves with a broad range of frequencies, described using two parameters, the angle and the phase. Practically, the angle can vary from 0°-180°, while the phase can take values from 0°-360° and is referred to the axis along which the 𝐵1 field is applied. Delays, instead, are times when pulsing and detection are not occuring and are very important in pulse sequences, as NMR interactions occur during these evolution times (8).
Listed below are just some of the most common pulse sequences used also in the present work.
Measurement of 𝑇1 by Inversion-Recovery
𝑇1 decays can be measured using a pulse sequence called Inversion recovery (IR).
In this sequence, a 180° pulse is first applied which rotates the net magnetization to the -𝑧-axis. After this pulse, the magnetization undergoes spin-lattice relaxation and tends to return toward its equilibrium position along the +𝑧 axis during the time 𝑡𝑚. A 90° pulse is applied after this time, which rotates the longitudinal magnetization into the 𝑥, 𝑦-plane. Once magnetization is present in the 𝑥, 𝑦-plane, it rotates about the 𝑧 axis and dephases giving a FID decay (24). In an IR measurement the signal acquisition is repeated at different values of 𝑡𝑚 until full recovery of the
magnetization is observed. In turn, the time period between scans during which the initial equilibrium state is reached is called recycle delay and needs to be much longer than 𝑇1.
21
Figure 8. Inversion Recovery Sequence: the nuclei are first allowed to relax to equilibrium (TR), then, a 180° pulse is applied to invert the signals. The signals relax for a length of time (𝑡𝑚) that is varied for each experiment. After that, a 90° pulse is applied and the FID
is recorded.
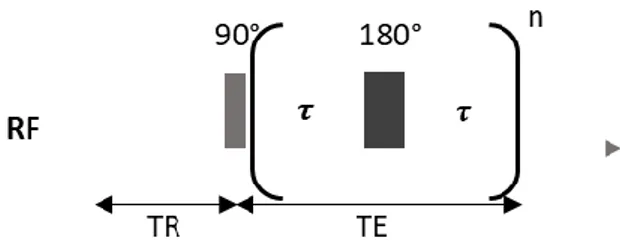
Measurement of 𝑇2 by the CPMG sequence
An approach for measuring 𝑇2 is the Carr-Purcell-Meiboom-Gill (CPMG) method, based on the spin-echo pulse sequence. In this sequence, a 90° pulse is first applied to the spin system, inducing a rotation of the net magnetization into the 𝑥, 𝑦-plane. The transverse magnetization begins to dephase. If the magnetic field was homogeneous, the signal would decay with a time constant 𝑇2. However, since the
field has some inhomogeneities, the signal actually decays faster, with a time constant 𝑇2∗. The de-phasing resulting from 𝑇2∗ occurs at a constant rate (as long as diffusion effects can be ignored),since it arises from the spatial inhomogeneity of the magnetic field. 𝑇2 de-phasing on the other hand fluctuates randomly since it results from the interaction among the nuclei themselves. In order to measure 𝑇2, the signal loss must be refocused. Therefore, at a time 𝜏 after the 90° pulse, a refocusing pulse (180°) is applied which flips the protons in a manner than those with a higher lag go beyond those with a lower one. Due to refocusing, an echo is built up and reaches its maximum after 2𝜏, the echo time (𝑇𝐸). In order to acquire the whole decay process several refocusing pulses are needed since each of these pulses causes an echo that will be the measured signal.
Two important parameters to set up for each experiment are:
• The echo time (𝑇𝐸 o 2𝜏); refers to the time between the application of the radiofrequency excitation pulse and the peak of the signal induced in the coil.
• The recycle delay (𝑇𝑅); it is the time period between scans (from the end of echo train to next 90° pulse) during which the initial equilibrium state is reached. 𝑇𝑅 is determined by the spin-lattice relaxation and it should be 4 or 5 times 𝑇1 in order to allow the system to relax back before the next pulse is applied.
22
Figure 9. CPMG sequence.
The spin relaxation times, 𝑇1 and 𝑇2, depend on many factors, such as: temperature, viscosity, magnetic field intensity and, in the case of liquids in contact with liquid/solid interfaces, or confined within a soft/rigid porous structure, the nature of the interaction among hydrogens and the surrounding matrix (2). For instance, the relaxation time of bound water protons near a solid surface is typically shorter than that (𝑇1,2 𝐵) of free water protons in bulk state, by definition unaffected by confinement. In the former case, the relaxation rates of protons will depend on the ratio between the local surface area (𝑆) and the local volume of confinement (𝑉) via a system-dependent parameter called “surface relaxivity”, which in turn differs for longitudinal and transverse relaxation.
First, the dependence of the measured relaxation rates on the local 𝑆
𝑉 ratios is typically represented as (29): 1 𝑇1,2 = ( 𝑉 − 𝑆 ∙ ℎ 𝑉 ) 1 𝑇1,2 𝐵+ ( 𝑆 ∙ ℎ 𝑉 ) 1 𝑇1,2 𝑆 [13]
where ℎ is the thickness of a monolayer of water molecules next to the material’s surface, and the surface relaxation time 𝑇1,2 𝑆 depends on the magnetic composition of the pore wall (18).
Typically, one has 𝑉 >> 𝑆 ∙ ℎ, and so the above expression can be simplified as (30): 1 𝑇1,2 = 1 𝑇1,2 𝐵 + 𝜌1,2 𝑆 𝑉 [14]
23 where 𝜌1,2 = ℎ
𝑇1,2 𝑆 is the (longitudinal or transverse) surface relaxivity, usually
expressed in units of µm/s. Further details on the surface relaxation models would be beyond the scope of this MSc thesis, therefore it is here sufficient to underline that the surface relaxivity expresses how fast the 1H magnetization within a monolayer of liquid molecules in direct contact with the surface decays due to spin interactions with electronic or nuclear dipolar moments at surface relaxation sinks (30). It is to notice that the model in equations 13 and 14 holds true if the surface relaxivity can be considered as a macroscopic parameter: this is likely to be the case when the distribution of magnetization is spatially nonuniform, due to the local environments with different S/V ratios which yield distinct local relaxation times.
A number of factors can make the theory more complicated: for instance, other than being influenced by the thickness of a monolayer of water ℎ, the two relaxivities are dependent also on the number of surface sites occupied by paramagnetic metal ions 𝑛𝑀 (18):
𝜌1,2 =𝑛𝑀 ℎ 𝑇1,2
24
Two-site chemical exchange theory
As already mentioned above, 𝑇2 relaxation is also affected by chemical exchange, an inter-molecular process which represents the mutual transfer of individual 1H nuclei from one molecular environment to another. Generally,
chemical exchange takes place between chemically-inequivalent protons (Δ𝛿 ≠ 0) that could in principle also exhibit different mobilities, and thus have distinct 𝑇2 values. For instance, protons of bound water may exchange with nearby protons of macromolecules, or protons of more mobile water exchange with protons of less mobile water molecules, etc. Apart from being an interesting aspect of spectroscopy, chemical exchange is important and useful because it tells us information about the chemical kinetics of conformational states, one of the few tools to explore the conformation of biomolecules. In fact, the kinetic information adds the dimension of time defining the “dynamic process” to which a biomolecule undergoes (41).
Chemical exchange in protein systems is often described as a two-sites exchange, characterized by bound water and free water: protons in these states differ in their mobility and in turn affects the transverse relaxation time 𝑇2.
Therefore, as demonstrated by the literature, chemical exchange is a good way to explore those phenomena which lead to changes in conformational states, e.g. aggregation during protein gelation, and it is already been used for WPI gels (12).
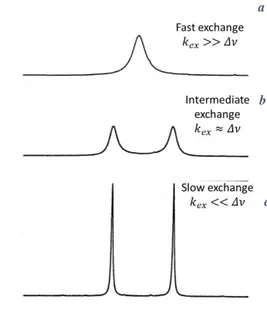
The time scale of exchange has a great influence on the observed 𝑇2 value(s),
and it can vary from nanoseconds to many seconds (37) yielding fast, intermediate or slow exchange regimes. As illustrated in Figure 10, if the rate of exchange 𝑘𝑒𝑥 is
much higher than the NMR frequency difference 𝛥𝜈 between the two exchanging sites (𝑘𝑒𝑥>> 𝛥𝜈), the respective 𝑇2 values are averaged out and only one 1H
spectral peak is observed at a weighted-average NMR frequency given by the relative populations of the two chemical species (Fig. 10 (a)). In the opposite case, if exchange is slow (𝑘𝑒𝑥<< 𝛥𝜈), distinct 1H spectral peaks, possibly with different
𝑇2 values, and for each site are observed and separate signals are observed (Fig. 10 (c)). At intermediate exchange rates (𝑘𝑒𝑥 ≈ 𝛥𝜈) very broad, yet single-component,
spectral peaks are observed (Fig. 10 (b)) (Bain, 2004). It is important to underline that peaks undergoing chemical exchange may have in principle different 𝑇2 values when they also exhibit different mobilities due to different environments, making it necessary to distinguish the effects caused by chemical exchange from those of mobility. For protein gels, fast exchange conditions may be expected (12, 20).
25
Figure 10. NMR spectra for spins, as a function of reaction rate (𝑘𝑒𝑥) and chemical shift
(𝛥𝜈), for fast exchange (a), intermediate exchange (b) and slow exchange (c).
The most widely used experimental way to detect chemical exchange by NMR is based on CPMG measurements conducted at increasing echo time 𝜏𝐸.
Then, the dispersion of the transverse relaxation rate, 𝑅2, is plotted against the inverse of the echo time giving the dispersion curve, whose functional form depends on the chemical exchange regime (20). The first to describe the effect of chemical exchange on the CPMG decay were Luz and Meiboom (33). Their equation is restricted for the two-site fast exchange process between site A and site B, and can be expressed as: 𝑅2𝑒𝑓𝑓 = 𝑅20+𝜙𝑒𝑥 𝑘𝑒𝑥(1 − 4𝜐𝐶𝑃𝑀𝐺 𝑘𝑒𝑥 ∙ tanh ( 𝑘𝑒𝑥 4𝜐𝐶𝑃𝑀𝐺)) [16] Here, 𝑘𝑒𝑥 and 𝜐𝐶𝑃𝑀𝐺 = 1
𝜏𝐸 are the exchange rate and the CPMG frequency,
respectively, while 𝑅20 is the relaxation rate at the short 𝜏𝐸 limit. Instead, 𝜙𝑒𝑥 = 𝑃𝑎∙ 𝑃𝑏∙ ∆𝜔2, where 𝑃𝑎 and 𝑃𝑏 respectively represent the proton populations of site
A and site B, while ∆𝜔 is their corresponding chemical shift difference in Hz. The relationship between the chemical shift 𝛿 (ppm) and the NMR frequency 𝜔 of the signal (Hz) is given by:
a
b
26
𝛿 = 𝜔
𝜔𝑠𝑝𝑒𝑐𝑡 [17]
where 𝜔𝑠𝑝𝑒𝑐𝑡 is the spectrometer frequency.
A modification was proposed in 1969 by Carver and Richards (9) in order to obtain a general model useful for both slow and intermediate exchange:
𝑅2𝑒𝑓𝑓 = 1 2{ 1 𝑇2,1 + 1 𝑇2,2 + 𝑘𝑒𝑥− 1 𝑇𝐸𝑐𝑜𝑠ℎ −1[𝐷 +cosh(𝜂+) − 𝐷−cosh(𝜂−)]} [18] where: 𝐷±=1 2(±1 + 𝜓 + 2(2𝜋Δ𝛿𝐵0)2 √𝜓2+ 𝜁2 ) [19] 𝜂 = 1 2𝜈𝐶𝑃𝑀𝐺√8√−𝜓 + √𝜓 2 + 𝜁2 [20] 𝜓 = (𝑘𝑒𝑥(𝐴𝐵)− 𝑘𝑒𝑥(𝐵𝐴)) 2 − (2𝜋Δ𝛿𝐵0)2+ 4𝑘𝑒𝑥(𝐴𝐵)𝑘𝑒𝑥(𝐵𝐴) [21] ζ = 4𝜋Δ𝛿𝐵0(𝑘𝑒𝑥(𝐴𝐵)− 𝑘𝑒𝑥(𝐵𝐴)) [22]
However, this equation is quite complex, therefore most of the times the Luz and Meiboom model is used for fast exchange regimes, while in case a slow regime is observed, the Tollinger model can be considered as a relatively simple analytical model for obtaining 𝑅2𝑒𝑓𝑓 (53):
27 𝑅2𝑒𝑓𝑓= 1 𝑇2 + 𝑘𝑒𝑥[1 − sinh ((0.5 Δ𝜔 𝑇𝐸) 0.5 Δ𝜔 𝑇𝐸 ] [23]
Unlike fast exchange, for slow exchange oscillations in the plots of 𝑅2𝑒𝑓𝑓
versus the CPMG field strength can occur, leading to discrepancies between exact numerical values of 𝑅2𝑒𝑓𝑓 and rates (53). These oscillations occur at low CPMG field strengths, and their frequency are determined by the sinusoidal term in the previous equation, function of the chemical shift difference between the two sites. It is necessary to remind that the frequency difference between the chemical shifts of the two sites is dependent on the static magnetic field strength according to Eq. 2. Thus, since ∆𝜔 is involved in the model used for studying chemical exchange, it seems obvious that there is a certain dependence of the chemical exchange contribution to the transverse relaxation rate on the static magnetic field strength (37). Despite knowledge of it was not the focus of this study, it is worthwhile noting that the results obtained from a chemical exchange study are specific for the static magnetic field used since it defines the chemical shift time scale. Here chemical exchange is investigated at 30 MHz.
28
Two-dimensional (2D) Time-Domain (TD) NMR
NMR One-dimensional time-domain NMR (TD-NMR) measurements are particularly useful for quality and process control in food industry and are widely used to measure the solid fat content especially by using low-field relaxometers. However, the potential of time-domain NMR is much wider: the behaviour of molecular environments with distinct relaxation times can be better investigated by using multidimensional approaches, such as for example 𝑇1-𝑇2 correlation
experiments. As already discussed, 𝑇1 and 𝑇2 relaxation times are characteristic of molecular species and molecular dynamics, thus depend on the molecule environment and dipolar interactions. Therefore, spins can be differentiated or correlated due to their different 𝑇1 and 𝑇2 relaxation times (40). In particular, as
long as the tumbling frequency is high compared to the Larmor frequency, the system is in the fast motion regime and the longitudinal and transverse relaxation times are equal. When the system contains large molecules or aggregates, as in the case of WPIgels, some of the tumbling motions are slower than the Larmor frequency and the two relaxation times 𝑇1 and 𝑇2 differ and will be related to the environment, which can restricts or not the spin movements leading to an alteration of the proton relaxation times. In such cases, both the overall molecular reorientation and the internal molecular motion have to be considered. Furthermore, with 2D TD-NMR experiments, useful information related to chemical exchanges and molecular transfers are obtainable (46).
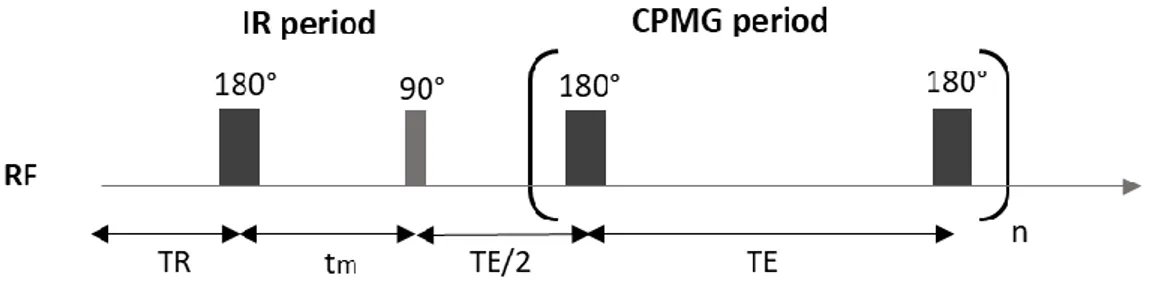
Two-dimensional 𝑇1-𝑇2 measurements are based on using a classical sequence such as CPMG combined with an IR experiment and recording results in a 2D matrix. An example of the sequence used is presented in Fig. 11.
Figure 11. Pulse sequence used to acquire 𝑇1−𝑇2 correlation spectra.
The sequence is repeated for different values of 𝑡𝑚 delay, and for each repetition a signal is recorded when the echo reaches its maximum. Then, 2D 𝑇1-𝑇2 maps are obtained through a 2D inverse Laplace transform (ILT): based on the 𝑇1
-𝑇2 ratio, information about molecular mobility and confinement of proton environments can be extracted (46).
29
Several papers have explored the potential of multidimensional relaxometry for characterising cellular plant tissues (55) and complex processed foods such as cheese (25) and egg (55). In fact, the resulting 2D spectra are a good tool for monitoring complex food changes related to phase transformations, aggregation, gelation and crystallization. Model systems based on aqueous biopolymer gels were also evaluated using 2D correlation experiments: the authors used bovine serum albumin (BSA) to study effective water diffusive exchange processes without the use of field gradients. They also demonstrated the capacity of 2D NMR spectroscopy to monitor microstructural changes associated with BSA thermal denaturation (55).
2D correlation data can be processed by using 2D ILT algorithm developed by Song et al. which generates the so called “𝑇2 distribution” giving information on
the different water population in the sample. The Laplace transformation 𝐹(𝑡) can be written according to this equation:
𝐹(𝑡) = ∫ 𝑀(𝑇2)𝑒−𝑡 𝑇⁄ 2𝑑𝑇2 ∞
0 [24]
The inverse Laplace transform is a ill-posed problem which means there is no unique solution for a certain signal. Furthermore, data sets obtained from the experiments are affected by some noise, and this will have influence on the search algorithm. Thus, this algorithm should be applied carefully; however, the use of ILT is really helpful if used together with other methods.
30
2. Aim of the thesis
The aim of the present work was to characterize, by using 1D and 2D TD-NMR, WPI gels obtained at different concentrations and pH to evaluate their impact on the gel structure, at room temperature and 37°C, and to explore if NMR parameters can be used to monitor proteins during gastric digestion.
The motivation to study WPI gels is based on their significant importance in food industry to provide structure in foods. As a consequence, they have been used as a model system for understanding how physical conditions, typical of protein digestion, can impact the gel structure. By using NMR, we wished to know whether the water proton relaxation parameters are a useful probe of the conformation of WPI gels under gastrointestinal pH and temperature conditions. The results obtained by this work might be useful for a future project funded by the University of Wageningen which has the following overall aim: to identify immunological characteristics of milk proteins in infant nutrition, in relation to their digestibility, as affected by thermal processing. The project will lead to different innovations, including the development of new MRI markers to monitor gastric protein digestion in vivo.
In addition, a study of the state of water and its interaction with the protein was done by measuring transverse relaxation-time dispersions at low field (two-site chemical exchange). This second part of the thesis is more challenging, because it would have required a thorough investigation of instrumental field inhomogeneities in order to correct the measured relaxation dispersion from effects due to 𝑇2∗, and thus obtain the “true” chemical exchange kinetics.
31
3. Materials and Method
MaterialsWhey protein isolate (WPI) (BiPRO®, Davisco, MN, US) was supplied by Human Nutrition and Health Department of Wageningen University & Research, with a declared protein content of 97.7% (see Appendix A). All the chemicals used were purchased from Sigma-Aldrich, Inc. (St. Louis, MO, U.S.A.). Milli-Q water (resistivity 18.2 MΩ cm at 25 °C) was used for all experiments.
Preparation of gel samples
WPI gels, prepared at four different concentrations (12, 15, 17 and 20% w/w, where the mass concentration is intended as g protein/100 g gel), were made as follows: whey protein isolate (WPI) powder was dissolved in water and stirred at room temperature for at least 2 h with a magnetic stirrer until the protein was completely dissolved. To prevent water evaporation, the solution was covered with Parafilm (Pechiney Plastic Packaging, Inc., IL, U.S.A.). After mixing, the solution was centrifuged (Thermo Scientific, MA, USA) at 1000 rpm for 10 min to eliminate air bubbles, and poured into Teflon tube which was then sealed. The Teflon tube was rotated at 50 rpm heated in a 90°C water bath for 30 min. After that, it was immediately cooled in an ice-water bath. The gels were sealed with layers of aluminium foil and stored at 4°C. Visual inspection showed that gels with higher concentration (17 and 20% w/w) are much more compact than those with a concentration of 15 and 12% w/w.
The gels were stored 1-5 days prior to use.
To obtain gels made at different pH, the pH of the solutions was adjusted to the desired one (3, 8 and 9) after stirring, using 1N of HCl or NaOH.
Low-field 1H NMR relaxometry
1H NMR relaxation measurements were performed at RT with a Maran Ultra NMR
spectrometer operating at 30.7 MHz proton resonance frequency (Resonance Instruments LTD., Witney, United Kingdom). For the measurements at 37°C, the samples, placed in NMR test tubes (7 mm), were kept in a water bath heated to the target temperature, and then measured immediately. The heating procedure was repeated every time before starting a new measurement, which in turn lasted about 1 minute. The validity of this heating procedure was tested by keeping the sample in the water bath for three different times (3, 5 and 10 minutes) before measuring it, to verify if 3 minutes was enough to heat the sample and if there was any change
32
after 3 minutes. Furthermore, to evaluate repeatability, the same measurement was carried out multiple times by choosing a heating time of 3 minutes.
The durations of the 90° and 180° pulses were calibrated to 3.7 and 7 µs, respectively, and in each relaxation measurement the NMR signal was averaged over four acquisitions, interspaced by a recycle time (𝑇𝑅) between successive scans of 6 s, with a receiver gain set to 0.25.
Spin-spin relaxation measurements were carried out by means of a one-shot CPMG pulse sequence, performed at increasing echo times, namely: 1, 1.5, 3, 5, 7, 12, 15, 20, 25, 30, 35, 40, 45 and 50 ms, correspondingly reducing the number of echoes from 2048 to 50 (five data points per echo). Each measurement was repeated two times and the average considered as the result.
Spin-lattice relaxation measurements were carried out by using a one-shot 𝑇1-𝑇2 correlation pulse sequence, consisting of an inversion recovery followed by
a CPMG-based acquisition. A number of 9 inversion times was chosen to span the interval between 1 ms and 5 s. Each measurement was repeated two times and the average considered as the result.
All the measured relaxation decays had a single-exponential behaviour, as tested by fitting the data in the evolution-time domain using a Levenberg-Marquardt non-linear least squares algorithm (MATLAB R2019a), as well as a 1D inverse Laplace transformation by CONTIN (44) resulting in a distribution of amplitude at different transverse relaxation times. The spectra were subsequently analyzed to determine, based on the top of the peaks, the 𝑇2 values of the water fractions and compare them with the results obtained by the fit. The error was calculated by measuring the interval width of the confidence bounds for fitted coefficients, displayed as a fitting result by Matlab, and dividing it by two. 𝑇1-𝑇2 correlation maps were obtained by 2D ILT; for the 𝑇1⁄ ratio, propagation of uncertainty was 𝑇2
calculated.
High-field 1H NMR relaxometry
𝑇2-dispersion CPMG experiments for studying chemical exchange were
performed also at high field on a 7.0 T Bruker Avance III spectrometer (resonance frequency 300 MHz for 1H), using micro-imaging probe. NMR tubes (25 mm) were used, and all the measurements were conducted at room temperature. The 90º pulse was calibrated to 50 µs, and a recycle time of 7 s was used, while the receiver gain was set to 0.25. 𝑇2 relaxation-time dispersions were measured using
33
to 20 ms. A total of four scans was collected for each measurement, which was then replicated twice. Data were processed in Topspin and MATLAB.
34
4. Results and discussion
Effect of protein concentration, temperature and pH on relaxation
times
WPI gels prepared at different concentration, measured at room temperature (RT) and 37°C
The first step was answering the research question: exploring the utility of NMR parameters (𝑇1 and 𝑇2) to follow the digestion of proteins, by characterizing WPI gels under different conditions. Therefore, in this section I will report the results obtained by measurements of WPI gels prepared at different concentration and analyzed at RT and 37°C, the latter one to simulate the temperature during gastric digestion.
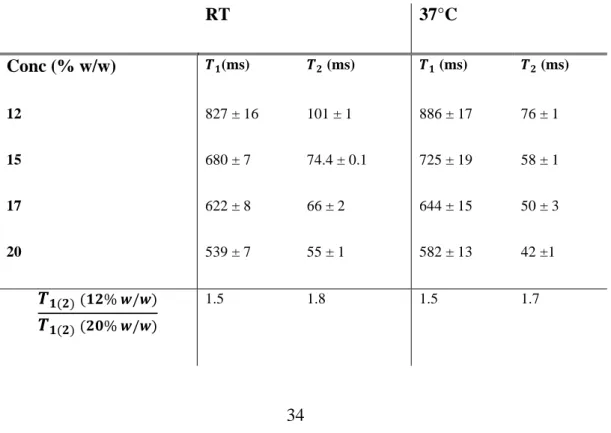
Table 1 shows the relaxation times 𝑇1 and 𝑇2 for the WPI gels at different concentration (12, 15, 17, and 20 %w/w) and measured at RT and at 37°C. Another parameter displayed in the table is the ratio between the values at the lowest and highest concentration, 𝑇1(12%𝑤 𝑤⁄ )
𝑇1(20%𝑤 𝑤⁄ ) and
𝑇2(12%𝑤 𝑤⁄ )
𝑇2(20%𝑤 𝑤⁄ ), employed as an index number to
measure the change along with the concentration and assess which parameter, 𝑇1 or
𝑇2, is more sensitive to the phenomenon studied.
RT 37°C Conc (% w/w) 𝑻𝟏(ms) 𝑻𝟐 (ms) 𝑻𝟏 (ms) 𝑻𝟐 (ms) 12 827 ± 16 101 ± 1 886 ± 17 76 ± 1 15 680 ± 7 74.4 ± 0.1 725 ± 19 58 ± 1 17 622 ± 8 66 ± 2 644 ± 15 50 ± 3 20 539 ± 7 55 ± 1 582 ± 13 42 ±1 𝑻𝟏(𝟐)(𝟏𝟐% 𝒘/𝒘) 𝑻𝟏(𝟐)(𝟐𝟎% 𝒘/𝒘) 1.5 1.8 1.5 1.7
35
Table 1. Relaxation times 𝑇1and 𝑇2 obtained by single exponential fitting domain using a
Levenberg-Marquardt non-linear least squares algorithm (MATLAB R2019a), and fitting errors for WPI gels concentrations measured at RT and 37°C, at 30 MHz.
The T2 values of the gels are in good agreement with the previous findings in the literature (12, 13, 42), taking into consideration that different conditions were used during sample preparation. In addition, mono-exponential behavior for WPI gels with a concentration between 6 and 36% (w/w) has also been found by others (12, 39, 42). The single component of 𝑇2 describes the water proton relaxation: in fact, the coagulation to which gels have been undergone, reduces the relaxation times from the nonexchangeable protein protons, not anymore detectable in the CPMG decay curve (12). Moreover, by looking at the ratio, for both 𝑇1 and 𝑇2, it is
noticeable that the decrease of 𝑇2 is slightly more important than what is observed
with the 𝑇1, suggesting that 𝑇2 may be more sensitive than 𝑇1 to the increasing concentration. This is true both at RT and 37°C.
Figure 12 represents 𝑇1 and 𝑇2 values for each concentration at 1 ms of echo time:
a curved dependency between the spin-lattice relaxation rate and WPI gel concentration was observed for both the spin-lattice and transverse relaxation time.
b
Figure 12. Dependence of the relaxation times (𝑇1(a) and 𝑇2 (b)) on whey protein gel
concentrations at RT and 37 °C.
36
For tests conducted at RT, the 𝑇2 relaxation time of the protein gels decreased from
about 101 ms to 55 ms as protein concentration was increased from 12 to 20 % w/w. The 𝑇1 results confirm the behaviour of 𝑇2, as 𝑇1 also decreased with increasing protein concentration in the gel.
At 37°C, the trends in both sets of data (𝑇1 and 𝑇2) were contrasting: 𝑇1 increased while 𝑇2 went down with increasing temperature. These results were unexpected since, theoretically, relaxation time 𝑇2 should increase along with 𝑇1
because of the dependence on the rotational correlation times (𝜏𝑐) of molecules,
which decreases as the temperature increases. A possible explanation could be found if the structure of the WPI gels is taken into account: during the gelation of proteins, a three-dimensional network of polypeptides, that is able to enclose water, is formed (39). Therefore, WPI gels could be considered as soft porous media where the relaxation times are the result of two relaxivity contributions, the bulk water and the interaction at the pore surface, directly correlated with the surface relaxivity parameters, 𝜌1 and 𝜌2. In turn, 𝜌1 and 𝜌2, depend on both the surface and liquid characteristics (30), and may (i) act differently from each other and (ii) change by temperature, explaining the anomalous behavior of 𝑇1 and 𝑇2.
Regarding this last point, the dependence of the surface relaxivity on the temperature is related to the correlation time 𝜏𝑐, to which the surface relaxivity
parameters are proportional:
𝜏𝑐(𝑇) = 𝜏𝑐0exp (−∆𝐸
𝑅𝑇) [25]
𝜌1,2(𝑇) ∝ 𝛼 𝜏𝑐(𝑇) [26]
In turn, the correlation time depends on temperature according to the Arrhenius law:
𝜏𝑐(𝑇) = 𝜏𝑐0exp (−∆𝐸
𝑅𝑇) [27]
where ∆𝐸 = 𝐸𝑚− 𝐸𝑠 is an effective activation energy describing the surface translational motion, 𝑅 is the gas constant, and 𝑇 is the temperature. 𝐸𝑚 is the usual activation energy associated to the individual molecular diffusing jumps. 𝐸𝑠 is the activation energy associated to the surface interaction. When ∆𝐸 > 0 (the diffusing barrier is larger than the surface interaction)𝜌 decreases when the temperature 𝑇
37
increases. On the contrary, when ∆𝐸 < 0, 𝜌 increases with temperature occurs, and may give an explanation to the opposite trends of relaxation rates as a function of heating (29).
It is well documented, instead, the observed decrease in 𝑇2 when the concentration was increased, which can be attributed to the interaction of the protein and water molecules: in the presence of solutes, the relaxation rate of water is enhanced due to the association of water molecules with the solvation shell of the solute. Hills (2004) reported that the enhancement in relaxation rate was proportional to the solute concentration. Consequently, the reverse is also true: increasing the water concentration in a solution increases the relaxation time. As a gel absorbs water the relative proportion of protein in a gel decreases and thus the relaxation times increase, as was observed in this case.
Two-dimensional 𝑇1−𝑇2 correlation measurements were also performed
and the results obtained for WPI gels at 12, 15, 17 and 20% w/w are displayed in the following figure (Fig. 13) for both RT and 37°C:
38
Figure 13. 𝑇1-𝑇2 correlation plots for whey protein gels with increasing concentration from top to bottom at RT ((a), (c), (e),
(g)) and 37°C ((b), (d), (f), (h)). The color bars in the right are normalized to the maximum value of each series at the two temperature. a b c d e f g h