Scuola di Dottorato in Ingegneria “Leonardo da Vinci”
Tesi di Dottorato di Ricerca in
Ingegneria Chimica e dei Materiali
SOL-GEL ROUTES
TO MESOPOROUS TUNGSTEN OXIDES
WITH MIXED ELECTRON/PROTON
CONDUCTIVITY
ING-IND/22-24-27Autore:
GABRIELE ORSINI
____________________
Relatore:
Dott. Ing. VINCENZO TRICOLI
____________________
Presidente del Corso di Dottorato:
Prof. Ing. CLAUDIO SCALI
____________________
The present thesis is focused on the development of novel, straightforward sol-gel techniques for the synthesis of highly mesoporous, mixed-conducting tungsten oxide monoliths and powders. Such materials are extremely interesting in view of potential applications for a variety of emerging electrochemical technologies, including electrode design in Polymer-Electrolyte-Membrane Fuel Cells.
Both hydrolytic and non-hydrolytic methods are set up. The hydrolytic route is based on a proper steam-treatment as an effective way to control the supply of water molecules to the gelling phase and thus also the oxide formation rate, which is crucial in determining mesoporous features. The non-hydrolytic route is based on a metal halide/alcohol system and affords a variety of mesoporous frameworks. An extended investigation is carried out in order to establish a correlation between alcohol molecular structure and physical properties of final oxide materials.
All samples are systematically characterized as to mesoporous properties, chemical composition and electrical properties.
Mesoporosity is mainly investigated by means of nitrogen adsorption/desorption analysis, which allows determination of surface area and pore volume/size as well as surface fractal dimension. In particular, the fractal dimension is shown to be a fundamental parameter in controlling and tayloring the mesoporous properties. Additional structural information is obtained from Scanning Electron Microscopy (SEM), Transmission Electron Microscopy (TEM) and X-Ray Diffraction (XRD).
Chemical composition (non-stoichiometry) plays a key role in electron conduction and is studied by X-Ray Photoelectron Spectroscopy (XPS).
Finally, electrical properties are subjected to a detailed quantitative inspection by means of Electrical Impedance Spectroscopy (EIS). Electron Conductivity is discussed in terms of hopping-transport models. Proton conductivity takes place in humid conditions according to the Grotthuss mechanism and can be extracted from EIS data by fitting with a proper equivalent circuit. Fractal dimension has a deep influence on proton dynamics and two well-distinct transport regimes are observed for rough and smooth oxide matrices.
Based on preparation and processing conditions, the following important values can be achieved: surface area up to 184 m2g–1, pore volume up to 0.56 cm3g–1, fairly
monodisperse pore diameter in the range 3 ÷ 20 nm, electron conductivity up to 20 S
Introduction
. . . . . . . . vAcknowledgements
. . . . . . . viii1
Sol-Gel Chemistry
. . . . . . 11.1 Hydrolytic Sol-Gel Techniques . . . . 1
1.2 WCl6 as WO3 Precursor . . . 4
1.3 Novel Hydrolytic Route to WO3 Gels . . . 4
1.4 Non-Hydrolytic Sol-Gel Techniques . . . 6
1.5 Novel Non-Hydrolytic Route to WO3 Gels . . 7
1.6 Post-Synthesis Processing . . . 8
1.7 Sample Nomenclature . . . 9
2
Structure and Composition
. . . . . 112.1 Micrometric Structure . . . 11
2.2 Nanometric Structure . . . 13
2.3 Crystallinity . . . 13
2.4 Composition and Non-Stoichiometry . . . 15
2.5 Final Thermal Treatment . . . 18
3
Mesoporous Properties
.
.
. . . 213.1 Adsorption Isotherms . . . 21
3.2 The BET Method . . . 22
3.3 The BJH Method . . . 25
3.4 State of Art for WO3 Materials . . . . 27
3.5 Results for Our Xerogels . . . 27
3.6 Controlling the Mesoporous Structure . . . 30
3.7 Effects of Calcination Temperature . . . 30
3.8 Effects of Final Thermal Treatment . . . 31
3.9 Fractals . . . 33
3.10 Adsorption on Fractal Surfaces . . . . 35
3.11 A Fractal Approach to Structure Control . . 38
3.12 Fractal-Dimension Correlations . . . . 39
3.13 Impact of the Alcohol Molecular Structure . . 43
4
Electron Conductivity .
.
.
. . . 464.1 Electron Conduction in Xerogels . . . . 46
4.5 State of Art for WO3 Materials . . . . 57
4.6 Water Stability and Mixed Conduction . . . 58
4.7 Oxygen Stability . . . 63
5
Proton Conductivity .
.
.
. . . 665.1 Equivalent-Circuit Fitting . . . 67
5.2 Results for Our Xerogels . . . 72
5.3 Hydration Dynamics . . . 76 5.4 Temperature Dependence . . . 77 5.5 Fractal Control . . . 77
Conclusions
.
.
.
.
.
.
.
.
81Bibliography
.
.
.
.
.
.
.
.
83Appendix .
.
.
.
.
.
.
.
.
87Among transition-metal oxides, tungsten(VI) oxide (WO3) arouses great scientific
interest owing to its peculiar physico-chemical properties [1]. WO3 is a good
electrochromic [2] and gas-sensor material [3]. Also, WO3-based catalysts are found
to be selectively active for a variety of reactions, like olefin metathesis [4, 5] and partial methane oxidation [6, 7]. Finally, WO3 exhibits both electron and proton
conduction characteristics, due respectively to n-type-semiconductor behaviour [8, 9] and water adsorption/dissociation in humid conditions with subsequent proton transport over internal surface by Grotthuss mechanism [10]. Such electrical properties make WO3 potentially useful in a number of emerging electrochemical
technologies and in particular for Polymer-Electrolyte-Membrane Fuel Cells (PEMFCs). Indeed, WO3 has already been proposed as an activity enhancer in fuel
cell anode catalysts [11-13]. However, development of WO3 materials with tailored
mesoporous structure as substrates for anode/cathode electrocatalysts has not been pursued yet. In state-of-art PEMFC both anode and cathode electrocatalysts are supported on carbon black, which is electronically, but not protonically conductive. Thus, in order to ensure proton transport through the anode or cathode layer, it is necessary to mix the carbon-supported catalyst with an organic proton-conducting polymer such as Nafion [14 ch. 4]. Any electrocatalytic site being not in contact with the polymer is practically unable to work, which may frustrate the apparent catalytic efficiency. Using electron- as well as proton-conducting WO3 as the electrocatalyst
substrate should enable effectiveness of a larger portion of catalytic sites. Also, inorganic WO3 is expected to be far more resistant than organic polymers with
respect to thermal, chemical and mechanical degradation. Based on these considerations, the present PhD work is focused on the design and development of WO3 materials with suitable structural and electrical characteristics for use as
electrocatalyst substrates in PEMFCs.
Homogeneous mesoporous structure, high surface area and mixed electron/proton conduction would be highly desirable properties of WO3 monoliths or powders to be
used as PEMFC substrates. A very powerful approach to the synthesis of such materials is afforded by the sol-gel chemistry, which plays a key role in modern materials science [15]. Basically, sol-gel techniques start from liquid-phase precursors and exploit suitable inorganic-polymerization (gelation) mechanisms to change them into solid oxide networks or particulates with unique properties in terms of morphology and porosity. Advantages over other synthetic methods include mild operating conditions, few ingredients, few stages and ultimately process cheapness.
Traditional sol-gel is of hydrolytic type, that is, employs water as the gelling agent and acts on solutions of metal salts or alkoxides with hydrolysis and condensation
with formation of dense precipitates rather than porous gels. The water problem is especially serious for transition-metal oxides, including WO3, since their precursors
are generally very sensitive to nucleophilic-substitution reactions like hydrolysis. Early attempts to overcome this drawback involved the use of suitable additives to act as chelating ligands on precursor molecules, thereby screening them from water and limiting hydrolysis-condensation rates [17]. Despite some success, this method is nowadays abandoned in favor of newer strategies. In this thesis, novel straightforward sol-gel techniques are developed for the synthesis of mesoporous, mixed-conducting WO3 in both hydrolytic and non-hydrolytic fashion.
The synthesis of hydrolytic WO3 gels is achieved based on steam as the hydrolyzing
agent [18]. Water transfers into the precursor across the liquid-vapor interface, subsequently penetrating by diffusion throughout the liquid phase. That avoids excessive local concentration of water molecules in the sol-gel system and the consequent precipitation. As a result, uniform condensation occurs throughout the liquid phase and a regular, homogeneous gel is afforded.
Once exploited the potentiality of aqueous systems, the natural continuation of the work is to abandon water and its intrinsic problem in favor of organic gelling agents.
Non-hydrolytic sol-gel is a very young research field, which provides materials scientists with the infinite possibilities of organic chemistry and thus opens new exciting paths for the synthesis of mesoporous frameworks [19]. Among all possible organic gelling agents, alcohols are especially important due to the simplicity of related synthetic procedures. Gelation mechanisms and kinetics are strongly dependent on the nature of the alcohol molecule. Quite surprisingly, alcohol-based non-hydrolytic techniques have not yet found wide application in literature for the preparation of WO3 materials. In this thesis, an extended study is carried out using
several alcohols in order to establish a correlation between the molecular features of the alcohol and the physical properties of final oxide products [20, 21]. The simple choice of the alcohol agent is shown to be a powerful tool for the tuning of porous features. In particular, a very effective approach is developed to the problem of structural control through the use of fractal geometry [22]: this mathematical theory has recently demonstrated to be a fundamental instrument in the description of gel networks [15 chs. 1, 9].
Both hydrolytic and non-hydrolytic WO3 materials are investigated with regard to
surface area and pore volume by means of standard nitrogen adsorption/desorption analysis. Additional information on the mesoporous structure is obtained from Scanning Electron Microscopy (SEM), Transmission Electron Microscopy (TEM) and X-Ray Diffraction (XRD).
In view of potential electroactive applications, electrical properties are thoroughly investigated with Electrical Impedance Spectroscopy (EIS). Electron as well as proton
In particular, a simple thermal treatment is reported that leads to very noticeable increases in electron conductivity. The combination of EIS with composition data from X-Ray Photoelectron Spectroscopy (XPS) allows the interpretation of such increases in terms of a Variable Range Hopping (VRH) mechanism, thus providing new physical insight into electron transport dynamics within WO3 gels.
Proton conductivity is strongly correlated with the fractal character of the gels and two well-distinct proton-transport regimes (separated by a sharp transition) are observed for fractally rough and smooth oxide matrices.
The thesis is organized as follows.
Chapter 1 provides the reader with the basics of sol-gel chemistry. Sol-gel is a huge, continuously evolving research field, thus only strictly necessary concepts are introduced. In particular, described here are the experimental procedures developed during the PhD work for the synthesis of WO3 materials.
Chapter 2 describes the microstructure and chemical compositon of the novel WO3
materials as evinced from electron microscopy and X-rays techniques.
Chapter 3 is entirely devoted to the examination of porous features: surface area, pore volume and pore-size distribution, which are fundamental parameters for any catalytical and, more generally, nanotechnological purpose. Also, the key concept of surface fractal dimension is introduced and exploited to set up a powerful approach to the control of the mesoporous structure.
Chapter 4 describes the electron conductivity of WO3 samples as a function of both
processing and operating conditions. Hopping-conduction models are described and discussed in the light of composition data.
Chapter 5 introduces the fundamentals of spectra-fitting in the EIS technique and presents a suitable equivalent-circuit model for the extraction of proton conductivity in water-exposed WO3 samples. Finally described and discussed is the correlation of
Warm thanks are due to Dr. Ing. V. Tricoli for the constant assistance and numerous suggestions in his capacity of PhD supervisor.
I am also grateful to the following people for their technical support in the characterization of our materials: Mr. F. Vivaldi (University of Pisa) for preparing the EIS cell, Mr. P. Narducci (University of Pisa) for SEM and XRD analyses, Mr. C. Uliana and Dr. L. Negretti (University of Genova) together with Dr. R. Ishak (University of Pisa) for TEM analyses, Prof. A. Rossi and Dr. M. Fantauzzi (University of Cagliari) together with Prof. V. Di Noto and Dr. E. Negro (University of Padova) for XPS analyses.
CHAPTER
1
SOL-GEL CHEMISTRY
Sol-Gel is a very general term and refers to a broad range of solution-chemistry techniques for the synthesis of porous solid materials. Basically, a sol is a colloidal suspension of solid particles in a liquid phase. Such particles can be chemically linked to give a solid network extending throughout the liquid, which is referred to as a gel (Fig. 1.1). Proper removal of the liquid from the gel finally provides a solid material with pores in place of the liquid.
This thesis is concerned with inorganic sol-gel [15, 16], whose final products are mainly metal oxides with plenty of applications in ceramics, coatings and nanotechnology. On the other side, organic sol-gel [23, 24] is devoted to the preparation of cross-linked polymer matrices of interest for biomedics and electroactive devices.
Due to their favourable characteristics, such as mild reaction conditions, cheapness, simplicity and extreme versatility, sol-gel techniques are of fundamental importance in modern materials science and engineering.
Fig. 1.1 The sol-gel transition.
By means of proper chemical techniques, a suspension of solid particles (sol) can be converted into a continuous
network extending throughout the liquid phase (gel).
1.1 Hydrolytic Sol-Gel Techniques
Inorganic sol-gel techniques are focused on the synthesis of metal-oxide materials. They can be classified into “traditional” hydrolytic and more recent non-hydrolytic ones, based on whether the chemical agent triggering the gelation process is water or not. Hydrolytic sol-gel has been known for at least 40 years [25], however it was only in the mid 1980s that it achieved a privileged position in research and industry [16]. Hydrolytic gelation is substantially based on the hydrolysis and condensation of suitable precursor compounds dissolved in liquid solutions. Hydrolysis takes place upon water addition and replaces the starting functional groups in the precursor molecule with highly reactive hydroxyl (−OH) groups. Subsequent condensation of such groups among themselves and with non-hydrolyzed starting groups allows the linking of many precursor molecules into single oxide macromolecules. As a result,
solid oxide particles form and the starting liquid solution becomes a sol. Further condensation of particles can be carried out to give a continuous oxide network extending throughout the liquid phase, that is a gel.
The most common hydrolytic precursors for transition-metal oxides are metal cations in aqueous solution and metal alkoxides in organic solution [15, 16].
Metal-Cation Precursors
Dissolving metal salts in water provides metal cations Mz+, whose hydrolysis occurs
as follows:
Mz+ + H2O
⇌
[M(OH2)]z+⇌
[M−OH](z–1)+ + H+⇌
[M=O](z–2)+ + 2H+Groups (OH2), −OH and =O are called respectively aquo-, hydroxo- and oxo-ligands.
Correspondingly, [M(OH2)]z+, [M−OH](z–1)+ and [M=O](z–2)+ are referred to as aquo-,
hydroxo- and oxo-ions. Condensation of hydrolyzed species proceeds by nucleophilic substitution and can be expressed compactly as:
M(OX) + M(OY) → M(OX)M + OY
Here, X and Yindicate up to 2 hydrogen atoms bonded to the oxygen atom; for the sake of simplicity, no charges are indicated on reagents and products. Generally, aquo-ligands are good leaving groups but poor nucleophiles, whereas the opposite occurs for oxo-ligands. Hydroxo-ligands can work both as leaving groups and as nucleophiles. Thus, in order to trigger the condensation, it is necessary to keep the hydrolysis equilibrium in the hydroxo domain. The crucial factor in this task is represented by the pH of the aqueous solution. When metal centres are coordinatively
unsaturated, that is, their maximum coordination number is less than their oxidation state z, coordination of further ligands does not imply substitution and condensation can also occur by direct nucleophilic addition:
M(OX) + M(OY) → M(OX)M(OY)
Metal-Alkoxide Precursors
Metal-cation precursors have quite limited applications. Also in view of the synthesis of WO3 materials, we are more interested in metal-alkoxide precursors and thus we
describe the related gelation chemistry in little more detail.
Metal-alkoxide compounds (MOR, with R being an alkyl group) can be dissolved in many organic solvents to give extremely versatile precursors, which are widely used in the sol-gel preparation of a large variety of glasses and ceramics. Water addition determines the hydrolysis according to the following steps (Fig. 1.2):
1) Coordination of a water oxygen on the metal centre of an alkoxide molecule. 2) Proton transfer from the water oxygen to the alkoxide oxygen.
3) Removal of an alcohol (ROH) molecule to give a metal hydroxyl (MOH). Metal-hydroxyl molecules can condense with metal-alkoxide molecules (alcoxolation) and among themselves (oxolation), the associated by-products being respectively alcohol and water. Alcoxolation and oxolation steps are very similar to those implied in hydrolysis (Fig. 1.3):
1) Coordination of a hydroxyl oxygen on the metal centre of an alkoxide (or another hydroxyl) molecule.
2) Proton transfer from the hydroxyl oxygen to the alkoxide (or the second hydroxyl) molecule.
3) Removal of an alcohol (or water) molecule to give the final oxide bridge.
Fig. 1.3 Condensation mechanisms for metal-alkoxide precursors.
Alcoxolation and oxolation (as well as hydrolysis) are nucleophilic-substitution reactions. In the presence of coordinatively unsaturated metal centres, condensation can also occur by direct nucleophilic addition (olation) via formation of hydroxyl bridges:
MOH + MOH → M(OH)MOH
MOH + MOR → M(OH)MOR
Transition-metal alkoxides are in general very reactive towards water. This is essentially due to the large electronegativity difference between the alkoxide oxygen and the metal centre, which renders the latter very susceptible to nucleophilic attack from water molecules. The very high reaction rates involved in hydrolysis and condensationmake it difficult to control the microstructure of the final oxide product and non-porous precipitates are often obtained rather than gels. This water problem can be faced in several ways, like adding suitable compounds which act as chelating ligands on metal centres [17] and partially screen them from water, or supplying water in a controlled fashion [18] in order to limit its concentration in the reaction vessel as it will be shown in Par. 1.3 for the synthesis of WO3 gels.
1.2 WCl
6as WO
3Precursor
Tungsten hexachloride (WCl6) is by far the most commonly exploited WO3 precursor
(indeed, the only one utilized in this thesis) and therefore it deserves some special attention. WCl6 is prepared by direct chlorination of pure tungsten in a flow system
at atmospheric pressure at 870 K [26]. It is a volatile, blue-black, non-polar crystalline solid (mp 548 K, bp 620 K), insoluble in water but soluble in many organic solvents. Its structure is built up of octahedral molecular units (a tungsten atom in the centre and six chlorine atoms at vertices) that separate from each other in organic solution. WCl6 is not interesting in itself as a metal halide, but rather for its ability to form
alkoxide groups when dissolved in alcohols. The alcoholysis reaction is [27, 28]:
WCl6 + x ROH → W(OR)xCl6–x + x HCl (1.1a)
WCl6 + x ROH → W(OR)xCl5–x + x HCl + ½ Cl2 (1.1b)
Chloroalkoxide species W(OR)xCl6–x and W(OR)xCl5–x can then undergo hydrolysis and
condensation as detailed in Par. 1.1. Actually, reactions (1.1a) and (1.1b) only occur in primary and secondary alcohols: the influence of the alcohol type will be discussed in Par. 1.4. It is seen from Eqn. (1.1b) that alcoholysis determines a partial reduction of tungsten from the hexavalent to the pentavalent state. This is also indicated by a marked chromatic change in the solution, which has initially a red-yellowish color (Fig. 1.4a) as only W(VI) is present, but turns green (Fig. 1.4b) when W(V) forms.
Fig. 1.4 Appearance of a 0.5 M
WCl6 solution in ethanol.
(a) After 5 min of mixing. (b) After 20 min of mixing. (c) After adding water (1:10 vol.).
The water problem introduced in Par. 1.1 becomes here evident: adding even a small water amount produces instant reaction within the mixture and a black WO3 slime is
formed (Fig. 1.4c). Such material is not a porous gel and exhibits a non-homogeneous structure with solid-like domains and liquid ones randomly alternated. In order to obtain nanotechnologically interesting samples, it is necessary to somehow control the reaction rate with water. A novel technique to manage this problem was successfully set up during the PhD work as described in the next paragraph.
1.3 Novel Hydrolytic Route to WO
3Gels
Literature is noticeably poor in papers concerning hydrolytic WO3. Preparation of
crystalline materials by acidification of aqueous sodium or ammonium tungstate (metal-cation precursors) [29, 30] or by supercritical drying of hydrolyzed tungsten oxyethoxide [31] is reported, but no relevant porous characteristics were obtained in any case. We overcame this difficulty by means of a straightforward strategy as detailed in what follows.
The key point is that the lower the water concentration, the lower is obviously the reaction rate of the precursor system. Therefore, achieving control on water supply allows in principle a slow, homogeneous WO3 formation with the building up of a
true gel network. Up to now, to the best of our knowledge, this idea has not been properly explored and utilized.
The synthesis of WO3 gels was performed with a supply of steam (as the hydrolyzing
agent) to alcohol solutions of WCl6 according to Fig 1.5 [18]. Water molecules transfer
into the solution across the liquid-vapor interface and then penetrate by diffusion throughout the liquid phase, where they are continuously consumed by the gelation process. Such configuration prevents excessive local water concentration and subsequent oxide precipitation. The technique is easy, cheap and could be extended to the preparation of several other oxides.
Experimental Procedure
WCl6 (purity > 99.9%) and reagent-grade alcohols were purchased from
Sigma-Aldrich and used as received under room conditions. In a typical synthesis, 2 g of WCl6 (5.0 mmol) were dissolved in 4 ml of a given alcohol to obtain a red-yellowish
precursor solution that turned blue-green (due to tungsten reduction) after stirring for about 20 min in a 10-ml beaker. (Caution: WCl6 dissolution is accompanied by
significant heat generation, which sometimes caused boiling. We recommend careful addition of the chloride to the alcohol under hood). Gelation was carried out as illustrated in Fig. 1.5.
Fig. 1.5 Scheme of our hydrolytic-gelation system.
(1): Autoclavable glass vial. (2): Cork.
(3): Teflon capsule. (4): Deionized water. (5): Steam.
(6): Precursor solution (WCl6 + alcohol).
The precursor solution was transferred to an open teflon capsule by means of a pipette. The capsule was then placed into an autoclavable glass vial with some deionized water (resistivity > 18 MΩ cm) at the bottom. In order to prevent rapid, uncontrolled formation of dense WO3 precipitate, care must be taken to avoid direct
contact at any time between the precursor in the capsule and the liquid water. The vial was closed and placed into an oven at controlled temperature of 373 K for 24 h. During this treatment water vapor dissolves and diffuses throughout the precursor thereby causing slow, uniform hydrolysis and condensation. At the end of the treatment the original solution appeared as a homogeneous, highly viscous, dark-blue paste, whose subsequent processing is described in Par. 1.6.
1.4 Non-Hydrolytic Sol-Gel Techniques
Using water to trigger gelation is cheap and environmentally benign. However, in spite of all synthesis tricks one can resort to, the intrinsic high reactivity of aqueous systems remains an open problem and poses serious limitations on the control of gel structure. Thus, starting from the late 1990s, scientists were naturally led to look for organic compounds as gelling agents in place of water. New gelation processes were explored and new porous materials were easily prepared. Non-hydrolytic sol-gel is today a very popular branch in materials science, providing oxide researchers with the infinite paths of organic chemistry as powerful synthesis tools.
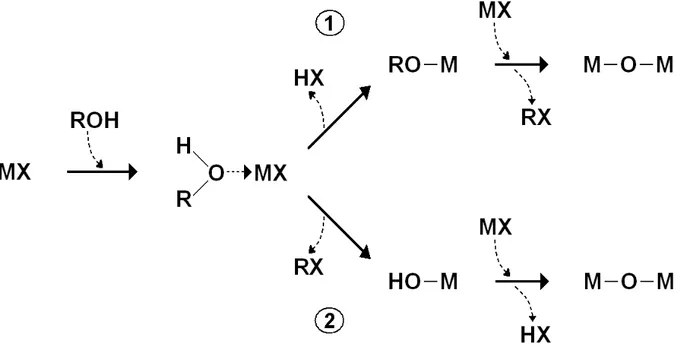
A large, ever growing variety of non-hydrolytic gelation mechanisms is presently available and readers are referred to Vioux’s review for an overall account [19]. Here, we focus on alcohol-based mechanisms, as they are the only ones involved in the thesis and have a special appeal due to the simplicity of related synthetic procedures. Gelation steps are illustrated in Fig. 1.6.
Fig. 1.6 Gelation mechanisms in metal halide/alcohol systems. (1): Mechanism for primary and
secondary alcohols. (2): Mechanism for benzylic and tertiary alcohols.
The starting point is usually a metal halide MX. Adding an alcohol ROH determines the formation of an intermediate complex, whose evolution is strongly dependent on the nature of the alcohol molecule [19, 32]. The key factor is the (thermodynamic) stability of carbocation R+ as compared to H+. For primary and secondary alcohols
(case 1 in Fig. 1.6) R+ is generally a bad leaving group with respect to H+, but the
opposite occurs for benzylic and tertiary alcohols (case 2). Thus, in case 1 the leaving of H+ gives a metal alkoxide, whereas in case 2 the leaving of R+ gives a metal
hydroxyl. Oxide formation is finally achieved by condensation of alkoxide and hydroxyl groups with halide groups. Even though the overall reaction is the same, mechanisms involved are different and imply different kinetics (hydroxyl groups are
significantly more reactive than alkoxide ones) with different microstructure in final products.
In this PhD work, alcohol-based gelation mechanisms were successfully applied to the setting up of a facile non-hydrolytic route to WO3 gels as described in the next
paragraph. It is noteworthy that non-hydrolytic reactions can also take place in the hydrolytic route of Par. 1.3, which employs alcohols as solvent media. However, due to its faster kinetics, the hydrolytic path is expected to dominate the gelation process.
1.5 Novel Non-Hydrolytic Route to WO
3Gels
Several papers dealing with non-hydrolytic WO3-based materials are available in the
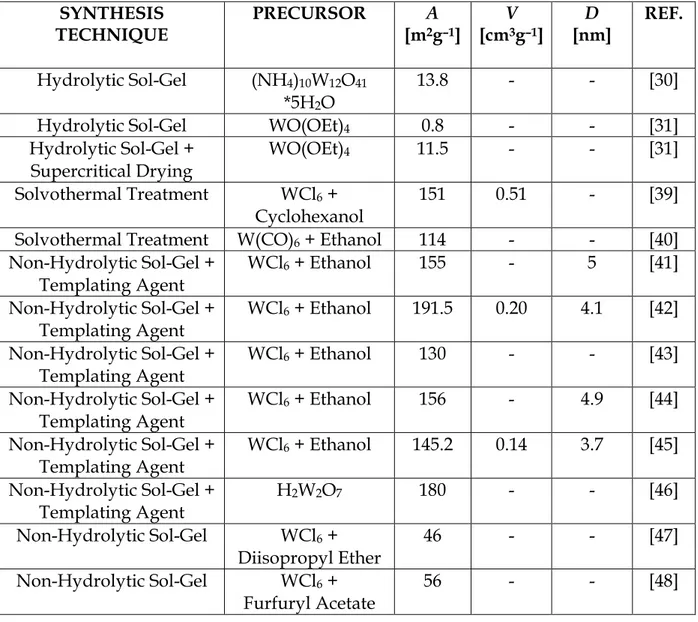
recent literature. However, research efforts are mainly concentrated on the synthesis of organic-inorganic hybrid nanoparticles, with emphasis on the tailoring of their final morphology rather than porous features [33-40]. Pure bulk WO3 was also
prepared, but up to now the achievement of highly porous matrices has only been possible with the use of expensive block copolymers and other templating agents [41-46]: these substances determine the organization of the liquid volume into complex, highly ordered structures with alternating mesodomains of two or more phases; the precursor is confined in the domains of a single phase and the final gel framework will be extremely rich in pores, which form in place of the other phases as the liquid template is removed. Template-free syntheses were seldom attempted and invariably led to poorly porous products [47, 48].
Quite surprisingly, alcohol-based reactions described in Par. 1.4 have not yet found wide application in the preparation of transition-metal oxides and WO3 in particular.
During the PhD work we directly exploited such mechanisms to set up an extremely facile non-hydrolytic route to WO3 materials. Our one-pot technique is in practice a
simplified version of the hydrolytic route of Par. 1.3, but now alcohols are no longer mere solvents and play an active role as true reagents. No templating agents are used. As it will be shown in Ch. 3, the simple choice of the alcohol is a powerful tool for the achievement of porous features even better than those of templated materials.
Experimental Procedure
WCl6 (purity > 99.9%) and reagent-grade alcohols were purchased from
Sigma-Aldrich and used as received under room conditions. In a typical synthesis, 1.20 g of WCl6 (3.0 mmol) were dissolved in 4 ml of a given alcohol or alcohol mixture to
obtain a blue-green precursor solution after stirring for about 20 min in a 10-ml beaker. In order to carry out the gelation process, the solution was poured into an autoclavable vial, which was then closed and placed into an oven at controlled temperature of 363 K for 24 h. At the end of the treatment the original solution appeared as a dark-blue soft monolith with an overhanging transparent organic liquid phase (Fig. 1.7). The consistency and volume of the monolith were dependent on the alcohols used. All wet samples were very stable and could be stored even for months in their closed vials without any apparent change. Subsequent processing of monoliths is described in Par. 1.6.
Fig. 1.7 WO3 gel monoliths synthesized according
to our non-hydrolytic method from mixtures of WCl6 with 1-butanol/tert-butanol solutions [20].
Tert-butanol fractions were 0.25 (a), 0.50 (b), 0.75 (c) and 1 (d).
1.6 Post-synthesis Processing
Once a gel has been formed, it is necessary to remove the liquid phase which swells the oxide network in order to obtain a solid material for technological applications.
Drying is often carried out by simple heating under static-air or vacuum conditions. Such operation determines a partial collapse of the porous structure as a consequence of the generation of capillary mechanical stress at the liquid-vapor interface [15 ch. 8]. The dried product is termed a xerogel (Fig. 1.8). Although more compact than the original wet gels, xerogels can preserve remarkably high values of surface area and pore volume if the oxide network is sufficiently strong to resist the compressive forces of surface tension. An expensive alternative is provided by supercritical
extraction of the liquid phase, that is, washing the gel with a suitable solvent above its critical temperature (such as CO2 above 304 K). Since in a supercritical fluid there are
no liquid-vapor interfaces, no capillary stress occurs and the gel shrinkage is greatly reduced. The resultant solid, which is termed an aerogel [15 chs. 8, 9], has almost the same porosity as the original wet gel.
During the PhD work we tried to keep our experimental procedures as simple and cheap as possible (also in view of their potential industrialization). Thus, it was decided to avoid supercritical extraction and all samples were dried to xerogels by means of a standard vacuum oven. In order to minimize the negative effects of drying on porosity, all efforts were directed to the optimization of both hydrolytic and non-hydrolytic synthesis techniques (see Ch. 3): the higher the condensation degree, the higher the resistance of the oxide network to mechanical stress and the less the drying collapse in surface area and pore volume; on the other side, excessively condensed structures often result in low wet-gel porosity and thus an empirical compromise is needed between the two opposing tendencies.
Fig. 1.7 Gel drying. Removal of the
liquid phase determines the formation of a xerogel if evaporation is used and of an aerogel if supercritical extraction is used.
The next step after drying is generally a calcination treatment, which is performed at high selected temperatures in order both to remove residual adsorbed water and organics and to consolidate the oxide structure. The network is strengthened because thermal energy enables oxide macromolecules to rearrange in stabler configurations and partly because further condensation reactions occur. Calcination atmosphere is to be chosen based on the particular xerogel one is dealing with. Further thermal treatments can be carried out in order to change or improve a given physical property, as it will be seen for electron conductivity in Ch. 4.
Experimental Procedure
Once synthesized, all samples were deprived of any overhanging liquid by means of a pipette. Drying was carried out at room temperature for 8 h under hood and then at 353 K for 12 h in a vacuum oven (10–2 torr) to give dark-blue powders. The final
calcination was operated in a tube furnace at 573 K for 3 h with a heating ramp of 3 K min-1 under vacuum or nitrogen atmosphere (in order to avoid air oxidation and
subsequent decrease in electron conductivity as explained in Ch. 4).
1.7 Sample Nomenclature
Table I lists all the WO3 samples prepared within the PhD work. For brevity, in the
next chapters each sample will be referred to according to the nomenclature in the first column of the Table. Full details on experimental methods and characterization results can be found in the papers from our group as indicated in the fourth column.
Table I – Sample Nomenclature
SAMPLE GELATION TYPE GELLING MIXTURE REF.
H2 Hydrolytic 2 g (WCl6) + 4 ml (Ethanol) [18] H3 Hydrolytic 2 g (WCl6) + 4 ml (1-Propanol) [18] HISO Hydrolytic 2 g (WCl6) + 4 ml (2-Propanol) [18] H4 Hydrolytic 2 g (WCl6) + 4 ml (1-Butanol) [18] NBU100 Non-Hydrolytic 1.2 g (WCl6) + 3.6 g (1-Butanol) [20] NBU75 Non-Hydrolytic 1.2 g (WCl6) + 2.7 g (1-Butanol) + 0.9 g (tert-Butanol) [20] NBU50 Non-Hydrolytic 1.2 g (WCl6) + 1.8 g (1-Butanol) + 1.8 g (tert-Butanol) [20]
NBU25 Non-Hydrolytic 1.2 g (WCl6) + 0.9 g (1-Butanol) + 2.7 g (tert-Butanol) [20] NBU0 Non-Hydrolytic 1.2 g (WCl6) + 3.6 g (tert-Butanol) [20] N1 Non-Hydrolytic 1.2 g (WCl6) + 4 ml (Methanol) [21] N2 Non-Hydrolytic 1.2 g (WCl6) + 4 ml (Ethanol) [21] N3 Non-Hydrolytic 1.2 g (WCl6) + 4 ml (1-Propanol) [21] N4 Non-Hydrolytic 1.2 g (WCl6) + 4 ml (1-Butanol) [21] N5 Non-Hydrolytic 1.2 g (WCl6) + 4 ml (1-Pentanol) [21] N6 Non-Hydrolytic 1.2 g (WCl6) + 4 ml (1-Hexanol) [21] N7 Non-Hydrolytic 1.2 g (WCl6) + 4 ml (1-Heptanol) [21] N8 Non-Hydrolytic 1.2 g (WCl6) + 4 ml (1-Octanol) [21] N9 Non-Hydrolytic 1.2 g (WCl6) + 4 ml (1-Nonanol) [21] N10 Non-Hydrolytic 1.2 g (WCl6) + 4 ml (1-Decanol) [21] N11 Non-Hydrolytic 1.2 g (WCl6) + 4 ml (1-Undecanol) [21] N12 Non-Hydrolytic 1.2 g (WCl6) + 4 ml (1-Dodecanol) [21] NISO Non-Hydrolytic 1.2 g (WCl6) + 4 ml (2-Propanol) [21] NTERT Non-Hydrolytic 1.2 g (WCl6) + 4 ml (tert-Butanol) [21] NBE Non-Hydrolytic 1.2 g (WCl6) + 4 ml (Benzyl Alcohol) [21]
CHAPTER
2
STRUCTURE AND COMPOSITION
This chapter outlines the general qualitative features of the xerogel morphology in our WO3 samples as evinced by Scanning and Transmission Electron Microscopy as
well as X-Ray Diffraction. Readers are referred to Ch. 3 for a quantitative analysis of the mesoporous structure. Next examined is the chemical composition of xerogel matrices by means of X-Ray Photoelectron Spectroscopy. Particular attention is paid to the effects of thermal treatments on oxide non-stoichiometry, which is a crucial variable in the control of electron conductivity (see Ch. 4).
2.1 Micrometric Structure
Xerogel morphology at micrometric scales was investigated by means of Scanning Electron Microscopy (SEM) according to the Experimental Procedure below. Some representative images at different magnifications are shown in Fig. 2.1. Both non-hydrolytic (Fig. 2.1a) and non-hydrolytic (Fig. 2.1d) samples are characterized by a spongelike structure with voids and channels of irregular sizes and shapes. Such structure is composed of variously packed and interconnected oxide particles with typical dimensions of micrometric order. At higher magnifications (respectively Fig.
2.1b and 2.1e) oxide particles are, in turn, found to be aggregates of primary subparticles with considerably smaller dimensions (of the order of some tens of nanometers). This character of “hierarchical” particulate is a general feature of our xerogels and occurs in all samples whatever the sol-gel chemistry and the post-synthesis processing. Each primary particle is in fact born as a polymerization centre floating in the liquid phase of the gelling mixture. Such oxide centre can grow by absorbing molecules of the precursor and of the gelling agent, which then combine with end reactive groups of living oxide-polymer chains and networks according to the non-hydrolytic or hydrolytic mechanisms described in Ch. 1. Particles keep on growing autonomously from each other until their surfaces get close (which may occur not only during the gelation period but also in subsequent drying and calcination steps) enough to be chemically linked together by formation of new oxide bridges. However, if particle surfaces happen not to be rich in reactive groups (or to contain a predominance of a single, non-autoreactive functionality, such as halide or
Experimental Procedure
SEM inspections were carried out using a JEOL JSM 5600 model operating at 15 kV and equipped with an Oxford 6587 Energy Dispersive X-Ray (EDX) spectrometer. Samples were generally coated with a gold layer by ion-sputtering. However, uncoated samples were employed for EDX elemental analysis.
Fig. 2.1 SEM images at various magnifications
from samples (a, b) N2 (c) N6 and (d, e) H4.
alkoxide ones), then particles will be able to connect with each other only through weak physical interactions of Van der Waals type. As it will be discussed in Ch. 4, the question of particle connection is of paramount importance for ensuring mixed electron/proton conduction within the oxide matrix.
Despite the general structural similarity of all xerogels, it will be seen in Ch. 3 that the mesoporous properties (surface area, pore volume, pore-size distribution) are subjected to large variations from sample to sample. Such properties are strongly dependent on the granulometry of primary particles as well as their packing and assembly organization. The composition of the gelling mixture has a strong influence on both these factors. Just as an example, the non-hydrolytic samples in Fig. 2.1a and
2.1c differ simply in the choice of the alcohol agent (being respectively ethanol and 1-hexanol), but, as a consequence of this, the second structure is composed of smaller particles packed in a more compact fashion. An effective approach to the control of the entire mesoporous structure through synthesis conditions will be developed in
Ch. 3 by application of fractal analysis.
2.2 Nanometric Structure
Fig. 2.2 TEM image from
sample NBU50.
Primary oxide particles evidenced in SEM analyses were inspected at nanometric scales by means of Transmission Electron Microscopy (TEM) according to the Experimental Procedure below. All samples exhibit the same dendritic particulate morphology (Fig. 2.2) as at micrometric scales. Such structural similarity at all scales is indicative of a fractal geometry and therefore suggests the application of fractal analysis as it will be detailed in Ch. 3.
Based on TEM images (which result from the superposition of several particle layers in the sample under observation), it cannot be judged with certainty whether particle aggregates are formed of individual, basically disconnected objects or they are actually intergrown/interconnected matrices. This is a crucial point for electron transport: in particular, investigation of electron-conduction properties in Ch. 4 will show that full interconnection of primary particles is only ensured for non-hydrolytic materials (probably as a consequence of higher condensation degrees typically enabled by non-hydrolytic techniques).
Experimental Procedure
TEM images were obtained using a PHILIPS CM 12 model operating at 120 kV. Samples were dispersed in diethyl ether and drops of the resulting suspension were deposited by means of a pipette onto a carbon-coated copper grid.
2.3 Crystallinity
Xerogel crystallinity is important not only in terms of a general structural inspection, but also, and above all, for the determination of electron-conduction mechanisms in
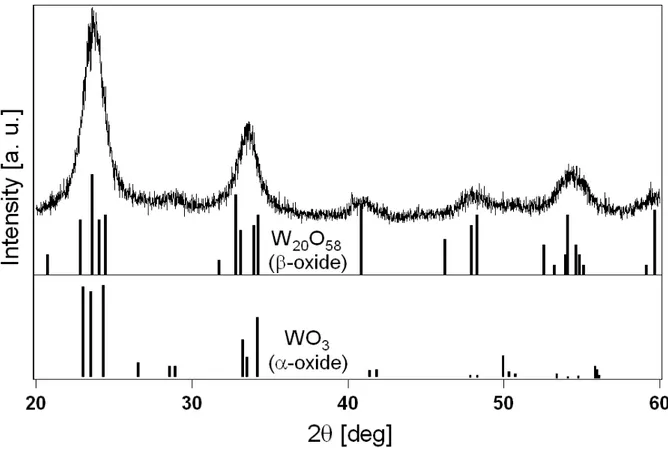
Fig. 2.3 XRD pattern for sample H4. Also shown as sticks are patterns for α and β crystal phases of tungsten oxide (JCPDS-card numbers 830951 and 050385).
the oxide matrix: in fact, while ordered crystals are characterized by energy bands with delocalized free electrons, amorphous or semicrystalline materials contain localized carriers that can only move by hopping among localized states (see Ch. 4).
Fig. 2.4 (a) TEM image (from sample H4) showing a typical crystalline region embedded in the
Crystallinity was studied by means of X-Ray Diffraction (XRD) on xerogel powders in a Siemens 810 automatic diffractometer with Cu-Kα radiation (wavelength 1.541 Å). No significative differences were observed while varying synthesis and post-synthesis conditions. A typical XRD pattern is illustrated in Fig. 2.3. Weak, broad peaks are noticed, which are indicative of poorly crystalline materials. Such peaks can be due in principle either to a weak, homogeneous structural order, or to highly ordered crystallites dispersed in an otherwise amorphous matrix. Examination of TEM images at high magnification (Fig. 2.4) suggests the second possibility, evidencing the presence of regularly textured regions (crystallographic planes) distributed in a random fashion all over the samples. Accordingly, electron-diffraction patterns from these regions display several sharp Debye-Scherrer rings (inset in Fig. 2.4a) which are not visible elsewhere. The XRD pattern is compatible with both monoclinic-WO3 and monoclinic-W20O58 crystal-phases (JCPDS-card
numbers respectively 830951 and 050385), also shown (as sticks) in Fig. 2.3 for comparison.
2.4 Composition and Non-Stoichiometry
General composition of each xerogel was assessed by Energy Dispersion X-Ray (EDX) spectroscopy according to the Experimental Procedure of Par. 2.1. EDX allows qualitative elemental analysis in the bulk oxide volume: a typical spectrum is illustrated in Fig. 2.5. In all cases, as expected, only W and O peaks were detected. The O/W atomic ratio was always slightly sub-stoichiometric (< 3), thereby indicating the presence of some amount of W(V) mixed with the predominant W(VI). Reduced-metal ions (with corresponding oxygen vacancies) are also revealed by
the dark-blue colour characteristic of all samples, as opposed to the yellow colour of pure W(VI) oxide [26]. Mixed W valence is to be ascribed to the reducing action of alcohols on WCl6, with subsequent formation of W(V)-chloroalkoxide precursor
species as detailed in Par. 1.2.
Reduced-metal ions (Fig. 2.6) contain “quasi-free” valence electrons that are not bound with surrounding oxygen atoms and therefore can easily break away to take part in a conduction process. Oxide non-stoichiometry is therefore a key factor in the determination of electron conductivity: even very small changes in the concentration of reduced metal can lead to strong variations in electron transport (see Ch. 4).
Fig. 2.6
Reduced tungsten atom in an oxide framework with a “quasi-free” valence electron (red point).
In order to set up any effective approach to the control of electron conductivity, it is crucial to accurately know the degree of non-stoichiometry as a function of synthesis and post-synthesis conditions. Non-stoichiometry can be expressed in quantitative terms as the fraction C of reduced-metal ions with respect to the total metal content:
( )
[
]
( )
[
W V]
[
W( )
VI]
V W C + = (2.1)Equivalently, one can specify the O/W atomic ratio x, which is related to C by the electroneutrality condition:
2 C 3
x= − (2.2)
The correct oxide formula is accordingly WOx. However, throughout this thesis,
samples are simply referred to as WO3 materials. Since EDX does not enable accurate
determination of C, X-Ray Photoelectron Spectroscopy (XPS) was employed for this purpose according to the Experimental Procedure below.
Experimental Procedure
XPS analysis of W oxidation states was carried out on a Theta Probe spectrometer from Thermo Electron Corporation (pressure < 10–7 Pa) using monochromatized
Al-Kα radiation (1486.6 eV, 70 W). Electron binding energies were referenced to the Au4f7/2 line at 83.9 eV.
In XPS, materials under analysis are irradiated with a beam of X-rays, which extract electrons from their surfaces. Simultaneously measured are the binding energy of escaping electrons (that is, work required to release them from their atomic orbitals) and their number. Plotting electron number vs. binding energy yields a spectrum with characteristic sets of peaks at characteristic energy values that directly identify each atomic species on materials surfaces.
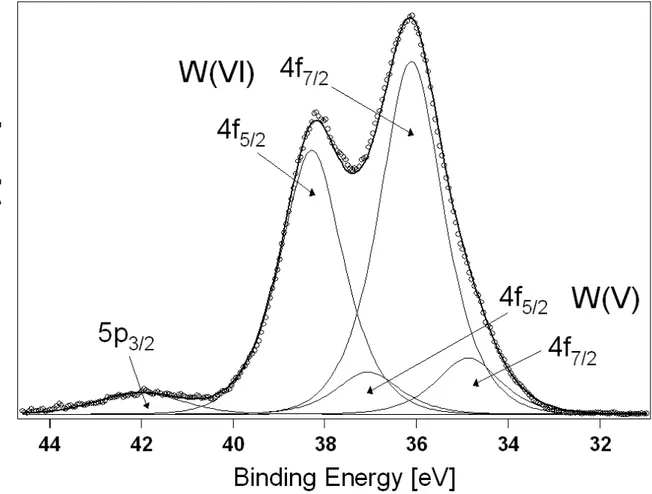
In our case, the focus was on the W4f region of the XP spectrum (Fig. 2.7), which was fitted according to a well-established procedure [49, 50] with the convolution of two W4f5/2-W4f7/2 doublets (fractions in pedices specify the spin quantum number for the
4f orbital; interaction of electron spins with nucleus magnetic field determine a
spin-orbit energy difference of 2.18 eV between W4f7/2 and W4f5/2 states, which was thus
imposed as a constraint in the fitting procedure). The main doublet (whose 4f7/2 peak
is centred at 36.1 eV) is characteristic of the W(VI) species, whereas the minor one (4f7/2 peak centred at 34.9 eV) is to be assigned to W(V). W(V)/W(VI) ratios were
finally determined from corresponding doublet areas and studied while varying both synthesis and post-synthesis conditions. Such analysis was limited to non-hydrolytic xerogels due to better mesoporous features and consequently higher technological interest. We found that non-stoichiometry is approximately independent of the
Fig. 2.7 W4f XP spectrum from sample NBU50 (subjected to final reducing treatment at 773 K as
detailed in Par. 2.5). XPS datapoints (circles) are fitted (thick line) with the peaks evidenced in the graph by thin lines.
synthesis “recipe” (in particular, of the choice of the alcohol agent): all samples invariably gave C = 0.11 with a sample-to-sample standard deviation of 10%. Such value is to be interpreted as the result of a limited extent of W reduction in the alcoholysis of WCl6. In order to increase C and thus electron conductivity, it is
necessary to subject synthesized samples to a proper final reducing treatment (after the usual drying and calcination steps of Par. 1.6) as detailed in the next paragraph.
2.5 Final Thermal Treatment
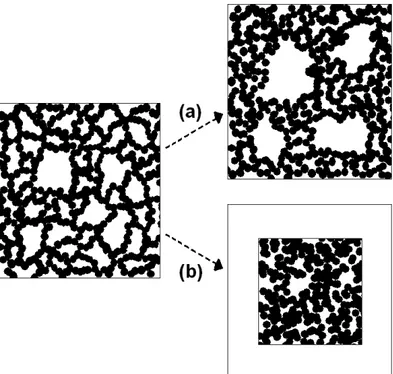
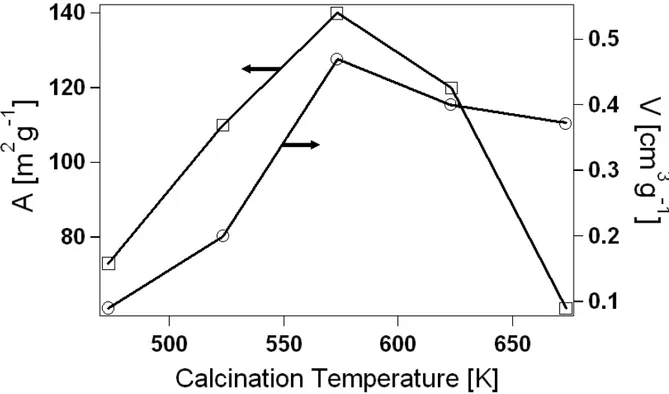
As a result of several tests, we set up a very simple reducing treatment for the enhancement of C in non-hydrolytic oxides according to the Experimental Procedure below. Treating at higher temperatures leads, on one hand, to a more consistent metal reduction and so to larger C values, but, on the other hand, it determines a more drastic collapse in mesoporous properties (see Ch. 3). Therefore, the choice of the (absolute) treatment temperature Ttr will be a compromise between mesoporosity
and electron conductivity to be established on the basis of final oxide applications. High-temperature metal reduction occurs on the surface of oxide particles through release of molecular oxygen according to the following reaction:
( )
( )
(g) 2 O O O 2 1 V V 2W O VI 2W + → + + (2.3)Here, Oo denotes an oxygen atom in an oxygen site at the oxide surface and Vo a
neutral oxygen vacancy. Once formed at the oxide surface, oxygen vacancies can penetrate into the interior by diffusional transport, thereby determining metal reduction in the bulk. Growth of C vs. Ttr for our xerogels is illustrated in Fig. 2.8.
In our case, there is clear evidence that the rate-determining step of the overall process is given by the kinetics of reaction (2.3) rather than by vacancy diffusion. In fact, the characteristic time for vacancy diffusion into oxide bulk is of the order of
L2/ξ, with L being the characteristic size of primary oxide particles and ξ the vacancy
diffusivity. Now, ξ is reported to be of the order of 10–11 ÷ 10–10 cm2s–1 in WO3 at
temperatures in the range 673 ÷ 773 K [51], while TEM images indicate that L is of the order of 10 nm for our samples (Fig. 2.2). Accordingly, the diffusion time is of the order of 0.01 ÷ 0.1 s. This is a very short time as compared to the duration of the thermal treatment (30 min). Thus, if the characteristic time of reaction (2.3) were not significantly larger than the diffusion time, then complete conversion of W(VI) to W(V) would occur over 30 min in our samples. However, data in Fig. 2.8 clearly show this is not the case, thereby proving that the rate of the W-reduction process is
Experimental Procedure
The degree of non-stoichiometry (C value) was enhanced by treating xerogels under nitrogen atmosphere for 30 min in a tube furnace pre-heated at a temperature in the range 573 ÷ 773 K. At the end of the treatment, samples were extracted from the furnace and kept under flowing nitrogen until cooled at room temperature.
Fig. 2.8 Enhancing effect of final-treatment temperature on W(V) concentration for nonhydrolytic
xerogels. The solid line is obtained by fitting datapoints to Eqn. (2.5).
limited by the kinetics of reaction (2.3) at the oxide surface. Since diffusion time is much shorter than reaction time, W(V) and oxygen vacancies (though formed at the oxide surface) must be homogeneously distributed throughout the bulk oxide. It must also be pointed out that reaction (2.3) is completely displaced to the right, as the oxygen product is continuously removed by the nitrogen flowing in the treatment furnace. Therefore, the reaction can only proceed forward at a rate r given by:
− = tr a RT E exp p r (2.4)
where R is the gas constant and the preexponential factor p is possibly a function of concentrations [W(VI)] and [Oo]. Based on data of Fig. 2.8, these concentrations are
subjected to only small changes during the treatment, so that they can be regarded as approximately constant. Accordingly, p and r are constant too. Hence, the amount C of W(V) in the xerogel matrix after a given treatment time t can be expressed as:
( )
− + = tr a 0 tr RT E exp q C T C (2.5)Fig. 2.8 to Eqn. (2.5) yields C0 = 0.105, p = 0.65 s–1 and Ea = 0.39 eV with variations <
10% from sample to sample for all parameters. Within standard deviation, as expected, the extrapolated C0 value coincides with the measured C value of untreated
oxides. Finally, it is interesting to note that our XPS-derived Ea value is in full
agreement with the thermogravimetry-derived value reported in literature (in the range 0.35 ÷ 0.42 eV) for the reduction of WO3 powders [52].
CHAPTER
3
MESOPOROUS PROPERTIES
Porous materials are usually classified according to pore size (diameter) as [53]: 1) Microporous for sizes not exceeding 2 nm;
2) Mesoporous for sizes in the range 2 ÷ 50 nm; 3) Macroporous for sizes exceeding 50 nm.
In particular, mesopores are small enough to result in high internal surface areas, but also large enough to ensure fast and efficient diffusion of fluid species. Therefore, the presence of mesoporous characteristics is an essential prerequisite for any catalytic or electrocatalytic application as well as for adsorption and molecular-separation technologies. Mesoporosity can be quantitatively expressed in terms of the following porosimetric variables:
1) Specific surface area A (per unit mass); 2) Specific pore volume V (per unit mass); 3) Average pore diameter D;
4) Pore-size polydispersity Q (pore-size distribution width).
This chapter describes the mesoporous properties of all our WO3-xerogel samples as
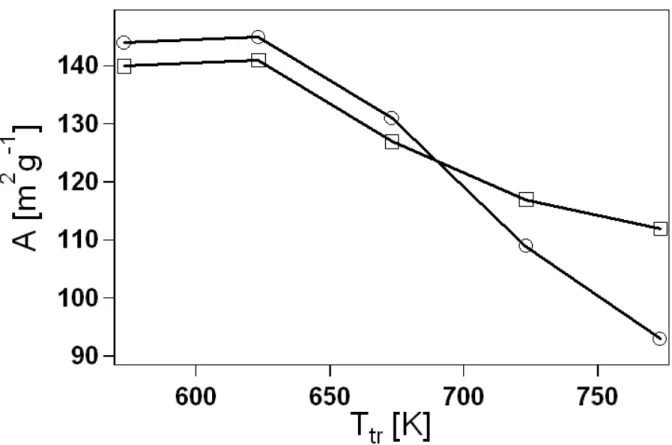
measured by means of standard nitrogen adsorption/desorption analysis. First, measurement methods are briefly described and a rigorous definition is accordingly provided for each porosimetric variable. A, V, D and Q values are subsequently presented for all samples, compared with literature data and discussed as functions of synthesis and post-synthesis conditions. The thermal stability of each variable (expressed as relative variation after performing the final reducing treatment of Par. 2.5) is also studied, in view of its special importance for applications requiring high electron conductivity. Finally, some key concepts of fractal geometry are introduced and exploited to set up a very powerful as well as versatile approach to the control and tailoring of the mesoporous properties.
3.1 Adsorption Isotherms
All data concerning the mesoporous properties of our WO3 samples were obtained
by means of nitrogen adsorption/desorption analysis. This technique allows determination of the nitrogen volume v adsorbed (per unit adsorbent mass) on the xerogel under examination as a function of nitrogen pressure P, according to the Experimental Procedure below. The resulting v(P) curve is referred to as adsorption
isotherm and contains very deep information about the adsorbing porous structure. In fact, porosimetric variables are obtained by elaboration of v(P) data in proper pressure ranges according to standard fitting models: A values can be calculated from the low-pressure region using the BET model (see Par. 3.2), whereas V, D and Q
Experimental Procedure
Nitrogen adsorption–desorption isotherms at 77 K were acquired using a Micromeritics ASAP 2010 automatic analyzer. Prior to analysis, all samples were degassed under vacuum (10–3 torr) at 423 K for at least 24 h.
values are extracted from the high-pressure region based on the BJH model (see Par. 3.3). However, simple visual examination of the isotherm shape is itself a precious instrument for understanding the underlying porous structure. Based on the IUPAC classifications [53], isotherms can be classified into six distinct types as detailed in
Fig. 3.1a. In particular, isotherms from our samples belong almost invariably to the IV type (an example is shown in Fig. 3.1b), which is clearly recognizable for its hysteresis loop together with a concave curvature in the low-pressure region. Such type is unambiguously indicative of the presence of mesopores (the hysteresis loop is in fact determined by capillary condensation of the adsorbate in mesopores [53, 54 ch.
16]), thereby confirming that our developed sol-gel techniques are an effective means for the synthesis of WO3 materials with mesoporous characteristics.
(a)
(b)
Fig. 3.1 (a) IUPAC classification of adsorption/desorption-isotherm shapes. In all isotherms, pressure
is standardly normalized to the saturation value P0 of the adsorbed species. Point B in types II and IV
marks the beginning of an almost linear middle section in the isotherm and is generally taken to indicate the completion of monolayer coverage (see Par. 3.2). Reproduced from [53]. (b) A typical, type-IV nitrogen adsorption/desorption isotherm from our WO3 xerogels (sample NBE), with its
characteristic hysteresis loop (separation of the desorption branch from the adsorption one in the high-pressure region).
3.2 The BET Method
Once the nitrogen isotherm v(P) has been obtained, the A value can be extracted from it using the standard Brunauer-Emmett-Teller (BET) method [53-55]. In what follows, the BET equation is derived in the traditional, mass-balance based fashion, but a
statistical-mechanics derivation is also possible [54 ch. 16].
In the course of the adsorption process, as the gas pressure is increased, gas molecules gradually accumulate on pore surfaces, thereby forming multiple molecular layers. For the generic pressure P, let then be sk the area of pore surfaces
covered by precisely k layers as illustrated in Fig. 3.2.
Fig. 3.2 Multilayer-adsorption areas. Adapted from [54].
In equilibrium conditions, the molar desorption rate from the k-fold layer (proportional to the area sk) is exactly counterbalanced by the molar adsorption rate
on the (k – 1)-fold layer (proportional to P and to the area sk–1). Thus it is:
k k 1 k kPs b s a − = k = 1, 2, 3… (3.1)
with ak and bk being proportionality constants. Such constants can have special values
a1 and b1 for the single layer (due to direct gas-surface interactions), but in the
multiple layers they are assumed to be the same as for the liquid-vapor equilibrium of the adsorbing species:
ak= a; bk = b k = 2, 3, 4… (3.2)
with b/a = P0 (vapor pressure). Inserting Eqn. (3.2) into Eqn. (3.1) yields:
0 k k cy s
s = k = 1, 2, 3… (3.3)
with c = P0 (a1/b1) and y = P/P0. Now, the number of adsorbed molecules or,
equivalently, the adsorbed gas volume v is evidently proportional to
∑
∞=1
k k
ks . Also, if the whole pore surface were covered with a single layer (monolayer coverage), the adsorbed volume vm would be proportional to
∑
∞ =0
k k
s , so that it can be written:
∑
∑
∑
∑
∞ = ∞ = ∞ = ∞ = + = = 1 k 1 k 0 k 1 k k k k k m 1 c y ky c s ks v v (3.4)The infinite sums in Eqn. (3.4) are easily calculated as
∑
∞=1 = −
k 1 y
y
yk (geometric series
of common ratio y < 1) and
(
)
∑
∞∑
∑
= ∞ = ∞ = = − = = 1 k k 1 k 1 -2 k 1 k k y 1 y y dy d y ky yky . The final expression
of the BET isotherm is therefore:
(
1 y) ( )
[
1 c 1y]
cy v v m − + − = (3.5)Eqn. (3.5) can also be put in the form:
( )
y cv 1 c cv 1 y -1 v y m m − + = (3.6)Based on Eqn. (3.6), plotting y/[v(1 – y)] vs. y should give a linear graph from whose intercept and slope the adsorption parameters c and vm can be obtained. In turn, the
specific surface area A is proportionally related to vm according to:
m 0 0 0 v V σ N A= (3.7)
Fig. 3.3 BET plot for the adsorption branch of the isotherm of Fig. 3.1b. The solid line is obtained by
where N0 and V0 indicate Avogadro’s number and molar volume, whereas σ0 is the
adsorption area for a single molecule and can be calculated from liquid-density data at any given temperature. For standard nitrogen adsorption at 77 K, it is σ0 = 16.2 Å2.
The BET equation provides a simplified picture of the adsorption process and is not usually able to reproduce the high-pressure behaviour of experimental isotherms. In the case of our xerogels, the linear section of the BET plots was generally limited to the region y < 0.2 ÷ 0.3. A typical BET plot from our samples is shown in Fig. 3.3.
3.3 The BJH Method
An isotherm curve contains much more structural information than a simple A value. In particular, as pointed above, the BET approach is only valid at low pressures and is not able to extract any information from the high-pressure region. Conversely, the Barrett-Joyner-Halenda (BJH) method is explicitly focused on this region and allows determination of V, D and Q values.
In the BJH scheme, the adsorbate volume is contributed to both by adsorption on pore surfaces and capillary condensation in the inner pore volume. Pores are standardly assumed to be cylindrical in shape and their sizes can be determined by a proper application of the well-known Kelvin equation for meniscus vapor pressure. The derivation of the method is quite laborious and is not reported here. Readers are referred to the original BJH paper for full details [56].
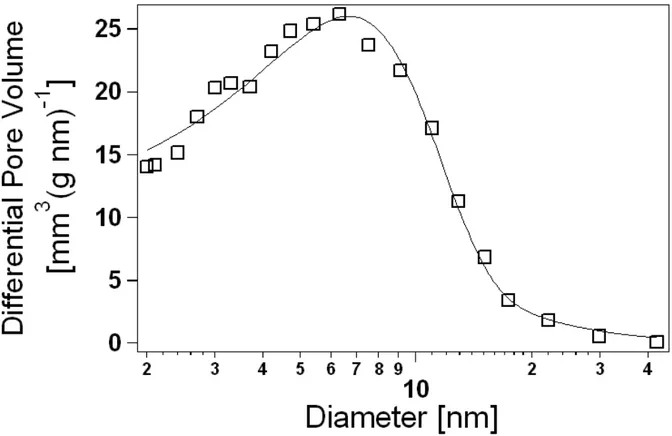
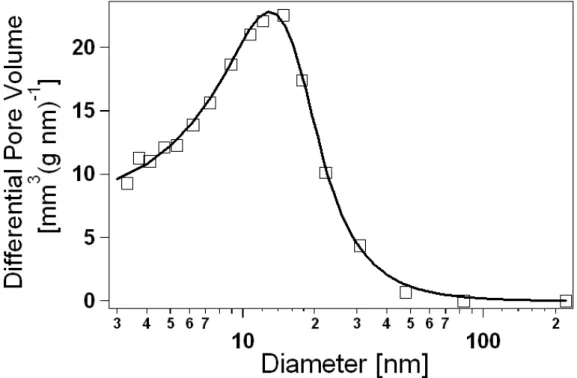
Fig. 3.4 BJH pore-size distribution from sample N11. The solid line is obtained by fitting datapoints to
The final output of the BJH method is the cumulative-volume function F(d), that is, the pore volume (per unit adsorbent mass) due to pores of diameter larger than a given d value. Accordingly, the total specific pore volume V is simply determined as
F(d = 2nm) (the contribute of micropores under 2 nm is not accounted for by the BJH method and anyway it is negligible for predominantly mesoporous materials such as our xerogels), whereas the pore-size distribution G(d) of the volume is given by:
( )
( )
d d d d dF G =− (3.8)A typical distribution from our samples is illustrated in Fig. 3.4. The average pore diameter D is subsequently obtained as:
( )
∫
∞ = nm 2 d G V 1 D d d d (3.9)We note that, due to the left-limitation of the integration domain and to some asymmetry in the distribution edges, D does not in general coincide with the position of the centre of the distribution peak. It is also important to remark that A, V and D are not totally independent quantities, but they are related to each other through the pore shape assumed for BJH calculations. With the standard choice of cylindrical pores and in the limit of a monodisperse pore diameter, it must be:
D 4V
A= (3.10)
Relation (3.10), though only approximately valid for real pore-size distributions of finite width, represents an effective means to assess the consistency of BET with BJH results. Our samples satisfy such relation within an average deviation < 25%.
A last, yet important porosimetric variable, which is usually neglected or only qualitatively discussed in dealing with gels or other porous materials, is the pore-size polydispersity Q. Such variable clearly plays a key role for the engineering of oxide materials with high selectivity in molecular traffic and thus is of fundamental interest in view of catalytic or adsorptive applications. In what follows, Q is expressed as the half-width at half maximum of the pore-size distribution peak, normalized with respect to the corresponding D value. Such quantity can be calculated by fitting the BJH distribution with a suitable functional form. The peaks observed in our samples are in general very well reproduced by the pseudo-Voigt symmmetric curve (that is, the linear combination of a gaussian peak and a lorentzian peak centred at the same position):
![Fig. 1.7 WO 3 gel monoliths synthesized according to our non-hydrolytic method from mixtures of WCl 6 with 1-butanol/tert-butanol solutions [20]](https://thumb-eu.123doks.com/thumbv2/123dokorg/7569941.111465/16.892.105.423.126.296/monoliths-synthesized-according-hydrolytic-mixtures-butanol-butanol-solutions.webp)