Genomic Classifier ColoPrint Predicts Recurrence in Stage II Colorectal
Cancer Patients More Accurately Than Clinical Factors
SCOTTKOPETZ,aJOSEPTABERNERO,cROBERTROSENBERG,dZHI-QINJIANG,aV´ICTORMORENO,e,fTHOMASBACHLEITNER-HOFMANN,g GIOVANNILANZA,hLISETTESTORK-SLOOTS,i,jDIPENMARU,bIRISSIMON,i,jGABRIELCAPELL `A,eRAMONSALAZARe
Departments ofaGastrointestinal Medical Oncology andbPathology, The University of Texas MD Anderson Cancer Center, Houston, Texas,
USA;cVall d’Hebron University Hospital and Institute of Oncology, Universitat Aut`onoma de Barcelona, Barcelona, Spain;dDepartment of
Surgery, Klinikum Rechts der Isar, Technische University, Munich, Germany;eInstitut Catal `a d’Oncologia, IDIBELL L’Hospitalet de Llobregat,
Barcelona, Spain;fDepartment of Clinical Sciences, Faculty of Medicine, University of Barcelona, Barcelona, Spain;gDepartment of Surgery,
Medical University of Vienna, Vienna, Austria;hDepartment of Surgery, University of Ferrara, Ferrara, Italy;iAgendia NV, Amsterdam, The
Netherlands;jAgendia Inc., Irvine, California, USA
Disclosures of potential conflicts of interest may be found at the end of this article.
Key Words. Stage II colon cancer x Risk prediction x Gene expression signature x Risk classification
ABSTRACT
Background. Approximately 20% of patients with stage II colorectal cancer will experience a relapse. Current clinical-pathologic stratification factors do not allow clear identification of these high-risk patients. ColoPrint (Agendia, Amsterdam, The Netherlands, http://www.agendia.com) is a gene expression classifier that distinguishes patients with low or high risk of disease relapse.
Methods. ColoPrint was developed using whole-genome ex-pression data and validated in several independent validation co-horts. Stage II patients from these studies were pooled (n 5 416), and ColoPrint was compared with clinical risk factors described in the National Comprehensive Cancer Network (NCCN) 2013 Guidelines for Colon Cancer. Median follow-up was 81 months. Most patients (70%) did not receive adjuvant chemotherapy. Risk of relapse (ROR) was defined as survival until first event of recurrence or death from cancer.
Results. In the pooled stage II data set, ColoPrint identified 63% of patients as low risk with a 5-year ROR of 10%, whereas high-risk patients (37%) had a 5-year ROR of 21%, with a hazard ratio (HR) of 2.16 (p 5 .004). This remained significant in a multivariate model that included number of lymph nodes retrieved and microsatellite instability. In the T3 microsatellite-stable subgroup (n 5 301), ColoPrint classified 59% of patients as low risk with a 5-year ROR of 9.9%. High-risk patients (31%) had a 22.4% ROR (HR: 2.41; p 5 .005). In contrast, the NCCN clinical high-risk factors were unable to distinguish high- and low-risk patients (15% vs. 13% ROR; p 5 .55).
Conclusion. ColoPrint significantly improved prognostic accu-racy independent of microsatellite status or clinical variables, facilitating the identification of patients at higher risk who might be considered for additional treatment. The Oncologist 2015;20:127–133
Implications for Practice:Patients with stage II colon cancer have a low rate of recurrence after surgery. A modest benefit may be derived from chemotherapy after surgery, but this approach requires treating many patients who are already cured and who do not need treatment. A gene expression signature, ColoPrint, is able to distinguish patients with the highest risk of recurrence, who may derive greater benefit from further chemotherapy, and to reassure doctors and patients about the overall excellent prognosis of patients with a low-risk ColoPrint result.This study confirmed the performance of this test in a large cohort of patients across many different centers. This test is currently available commercially for patient testing.
INTRODUCTION
Colorectal cancer is the third most common cancer and a leading cause of cancer death worldwide [1, 2]. If this cancer is detected early, many patients can be cured by surgery. Patients with stage II colorectal cancer have an∼80% chance to stay disease-free even without adjuvant therapy [3]. The challenge is to identify
those∼20% of patients in whom the disease will recur locally or at distant sites. The early identification of these high-risk patients would allow more informed discussions about the risks and benefits of adjuvant therapy and, potentially, more risk-adapted surveillance plans [4]. Much effort has been put into
Correspondence: Scott Kopetz, M.D., Ph.D., Department of Gastrointestinal Medical Oncology, Unit 426, The University of Texas MD Anderson Cancer Center, 1515 Holcombe Boulevard, Houston, Texas 77030, USA. Telephone: 713-792-2828; E-Mail: [email protected] Received August 29, 2014; accepted for publication November 25, 2014; first published online in The Oncologist Express on January 5, 2015. ©AlphaMed Press 1083-7159/2015/$20.00/0 http://dx.doi.org/10.1634/theoncologist.2014-0325
by guest on September 8, 2015
http://theoncologist.alphamedpress.org/
identifying reliable risk factors to assess the individual risk of stage II patients. A number of poor prognostic clinical factors have been identified—low number of assessed lymph nodes (,12); T4 tumors; obstruction or perforation at diagnosis; vascular, lymphatic, or perineural invasion; poor histological differentiation (high grade); and the presence of positive resection margins [5, 6]—but noclinical markerhas beenshown to improve the selection of patients who benefit from treatment [7]. High microsatellite instability (MSI-H) is the most reliable factor used in the clinic to identify patients who have a good prognosis and who may derive no benefit from adjuvant therapy [8, 9]. Only∼15% of patients are MSI-H, leaving the majority of patients with indeterminate risk.
Multi-index assays like gene expression profiling or the combination of multiple factors and technologies are likely to provide more robust information regarding individual prognosis. The successful development and wide clinical use of such tests for breast cancer patients show that this approach might provide more information than other individual clinical or molecular factors [10, 11]. Similar gene expression profiles have been developed for colorectal cancer in the past 10 years [12–17], but only a few profiles have been validated in independent studies [18] and have been shown to be technically robust. ColoPrint (Agendia, Amsterdam, The Netherlands, http://www.agendia. com) is an 18-gene expression signature that was developed based on unbiased gene selection, searching the whole genome for genes that have the highest correlation to a tumor-relapse event [19]. The signature was translated into a diagnostic test, validated in three independent studies [19–21],andshowntobe technically reproducible and robust [20]. In this study, we described the pooled analysis of all stage II patients from the independent cohorts of patients treated in the U.S., Spain, Germany, Italy, and Austria.
METHODS
Patients and Tumor Samples
Frozen tumor samples from patients with stage II colorectal cancer who underwent curative tumor resection were collected prospectively between 1987 and 2009 at six institutes in Spain, Germany, Austria, Italy, and the U.S. (supplemental online Table 1).
Clinical and histopathological data of all patients were collected. All patients were staged according to the seventh edition of the Union for International Cancer Control and American Joint Committee on Cancer tumor staging system [22]. The performance of the ColoPrint classifier has been described previously for several of the cohorts, but they were individually underpowered to detect the performance of the classifier in the clinically relevant stage II population and thus were used for the pooled analysis. The median follow-up time of patients was 81 months (range: 56–178 months).
Gene Expression Analysis
The 18-gene ColoPrint gene expression profile was assessed at Agendia’s laboratories (ISO17025 certified and Clinical Labora-tory Improvement Amendments accredited) based on a pre-viously established signature. None of the data sets included in this analysis were part of this initial discovery set. The assessment was made by laboratory staff who were blinded to
clinical data, as described previously [19, 20]. Briefly, frozen sections were stained with hematoxylin and eosin; only samples that contained at least 30% tumor cells, as reviewed by a central certified pathologist, were used for RNA isolation. RNAs of adequate quality were amplified, labeled, and hybridized to the custom-designed ColoPrint microarray (Agilent Technologies, Santa Clara, CA, http://www.agilent.com). Approximately 10% of samples submitted for analysis had insufficient tumor cellularity or inadequate RNA quality and were not able to be analyzed. The correlation of the sample expression profile to a template (the mean expression profile of tumors with a known clinical outcome) was calculated (ColoPrint index), and the molecular profile of the sample was determined and categorized as either low risk or high risk [19, 20].
Microsatellite Instability Analysis
MSI status for most patients (n 5 306) was determined at local hospitals using their preferred methods. MSI status for patients from the Institut Catal`a d’Oncologia hospital (Barcelona, Spain) was determined by polymerase chain reaction (PCR) amplifica-tion of six microsatellite DNA regions (D21S415, D21S1235, D12S95, D4S2948, SIT2, BAT26) or five microsatellite DNA regions (BAT-25, BAT-26, NR-21, NR-24, Mono-27) from paired normal and tumor tissues (MSI analysis system, version 1.2; Promega, Madison, WI, https://www.promega.com). A tumor with only normal markers was defined as microsatellite stable (MSS).
For all patients from Munich, Germany, microsatellite instability was determined using the Qiagen Type-it Micro-satellite PCR Kit (Qiagen, Hilden, Germany, http://www.qiagen. com). Two mononucleotide and three dinucleotide Bethesda markers (BAT25, BAT26, D2S123, D5S346, D17S250) were investigated. A tumor with five normal markers was defined as MSS. Irregularity in one marker was defined as low-grade microsatellite instability and as MSS in our binary analysis. MSI status in the patients at MD Anderson Cancer Center (Houston, TX) was determined by immunohistochemistry for MHS2, MSH6, MLH1, and PMS2, with loss of any one protein defining MSI-H. For all patients who had no MSI status determined locally, we used a previously described MSI signature for classification that identifies patients with MSI with high sensitivity and specificity [23].
Statistical Analyses
The primary endpoint was risk of relapse (ROR), which was defined as the probability that patients developed a recurrence (locoregional or metastatic) or did not die of cancer as the first event; data on all other patients were censored on the date of the last follow-up visit or date of death. Deaths not attributed to cancer were censored to evaluate true prognostic pre-diction. A secondary analysis of disease-free survival was performed, and all deaths were coded as events. Data were analyzed from the date of surgery to the time of the first event or the date on which data were censored, according to the Kaplan-Meier method, and the curves were compared with the log-rank test.
In order to determine the independence of ColoPrint from clinicopathological variables in predicting an individual’s risk of relapse, we used univariate and multivariate analysis. Variables included sex; localization of the tumor; Tstage; number of lymph
T
by guest on September 8, 2015
http://theoncologist.alphamedpress.org/
nodes assessed; histological grade; adjuvant chemotherapy administration; MSI status; ColoPrint and the combined National Comprehensive Cancer Network (NCCN) high-risk score, including T4, high grade, lymphovascular or perineural invasion, perforation or obstruction,,12 nodes examined, and positive margins, in which any one positive factor represented a high-risk NCCN score (NCCN guidelines version 3.2013) [24]. Variables with p , .1 in the univariate analysis were entered into the multivariate model with forward entry at p , .05.
Log-rank tests were used in the univariate analysis, and a multivariate Cox model was built. Given prior distribution of high- and low-risk scores and a median follow-up of 81 months, a sample size of 400 patients in this pooled analysis was sufficient to detect a clinically meaningful hazard ratio (HR) of 1.6 for the high-risk cohort, with 90% power and two-sidedaof 0.05. All calculations were performed with SPSS version 16.0
(IBM Corp, Armonk, NY, http://www-01.ibm.com/software/ analytics/spss/).
RESULTS
Patient Characteristics
The clinical characteristics of the 416 patients (median age: 67 years [range: 33–94 years]) are shown in Table 1. Patients in this pooled analysis were treated at five different hospitals in Europe and one hospital in the U.S. Patient characteristics varied across the studies in age and grade (supplemental online Table 1). Importantly, all patients had large numbers of lymph nodes assessed (median: 19 [range, among hospitals: 13–21.5]), indirectly indicating a high quality of surgery and pathology at all hospitals. A total of 124 patients (29.8%) received adjuvant treatment, with fewer patients treated in Table 1. Patient characteristics and ColoPrint results
Variable
Total ColoPrint low risk ColoPrint high risk
p value
n5 416 % n5 263 63% n5 153 37%
Median age (years) 67.0 66.1 69.0 .493
Age.65 years No 172 41.3 116 44.1 56 36.6 .134 Yes 244 58.7 147 55.9 97 63.4 Localization Left 201 48.3 121 46.0 80 52.3 .298 Right 177 42.5 120 45.6 57 37.3 Rectum 31 7.5 19 7.2 12 7.8 Missing 7 1.7 3 1.1 4 2.6 Grade 1 80 19.2 44 16.7 36 23.5 .165 2 273 65.6 175 66.5 98 64.1 3 63 15.1 44 16.7 19 12.4 Gender Male 243 58.4 149 56.7 94 61.4 .340 Female 173 41.6 114 43.3 59 38.6 Median LNs assessed 19.0 20.0 18.0 .201 LNs.12 No 85 20.4 49 18.6 36 23.5 .232 Yes 331 79.6 214 81.4 117 76.5 pT 3 368 88.5 228 86.7 140 91.5 .139 4 48 11.5 35 13.3 13 8.5 Adjuvant chemotherapy No 292 70.2 191 72.6 101 66.0 .127 Yes 124 29.8 72 27.4 52 34.0 MSI status No 336 80.8 202 76.8 134 87.6 .007 Yes 80 19.2 61 23.2 19 12.4 NCCN Low risk 236 56.7 156 59.3 80 52.3 .163 High risk 180 43.3 107 40.7 73 47.7
Bold value indicates p , .05.
Abbreviations: LN, lymph node; MSI, microsatellite instability; NCCN, National Comprehensive Cancer Network.
by guest on September 8, 2015
http://theoncologist.alphamedpress.org/
Munich than at the other hospitals; this can be partially explained by the fact that these patients were diagnosed earlier in time. Adjuvant therapy was administered as 5-fluorouracil (5-FU) in 94% or 5-FU and oxaliplatin in 6%.
ColoPrint classified 263 patients (63%) as low risk and 153 (37%) as high risk. ColoPrint assessment was not correlated to age, sex, localization of tumor, grade, number of assessed lymph nodes, or Tstage. ColoPrint classification also correlated with MSI status because most, but not all, MSI-H patients were classified as low risk (76.8%).
Risk Assessment by ColoPrint and NCCN
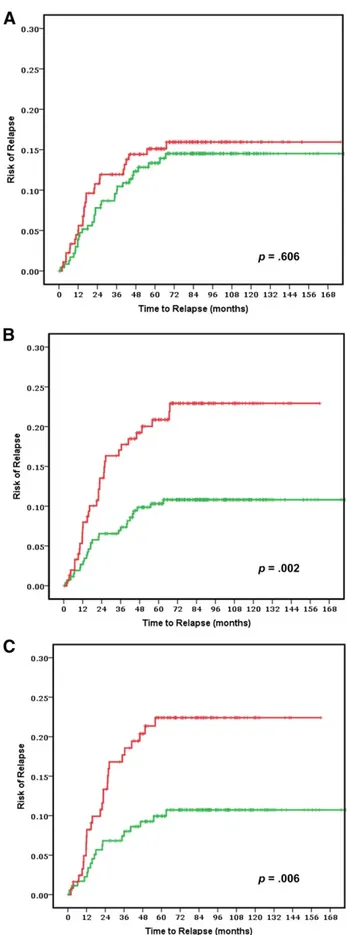
The risk of relapse curves show that ColoPrint high-risk patients had a 5-year ROR of 20.9% (95% confidence interval [CI]: 14.2%–27.6%), whereas patients with a low-risk ColoPrint result had a 5-year ROR of 10.3% (95% CI: 6.6%–14%; p 5 .004) (Fig. 1). This corresponds to a 2.16-fold higher HR for re-currence in the univariate analysis (95% CI: 1.28–3.65;p5.004). Similarly, the 3-year ROR is 7% for ColoPrint low-risk pa-tients and 17.1% for ColoPrint high-risk papa-tients (HR: 2.55; 95% CI: 1.39–4.68; p 5 .002).
Of the clinical variables, only number of lymph nodes as a continuous variable reached near significance for 5-year ROR (HR: 0.97; p 5 .053). The MSI status was prognostic with patients with MSI-H having a better prognosis (HR: 0.39; p 5 .046). Age, localization, grade, sex,Tstage (3 vs. 4), therapy, and NCCN risk were not significantly correlated with the time to recurrence (Table 2). The discordance between clinical risk classification using NCCN guidelines and ColoPrint was 45%, in part because ColoPrint identified many patients with T4, high grade, or low number of assessed lymph nodes as low risk (Table 3). Patients classified as clinically high risk using the NCCN guidelines had a 5-year ROR of 15.1% (95% CI: 9.8%–20.4%) compared with 13.3% for NCCN low-risk patients (95% CI: 8.8%–17.8%; p 5 .55).This clinical risk score was not significant in the univariate analysis (HR: 1.17; p 5 .6). A multivariate model was constructed with the number of assessed lymph nodes, MSI status, and ColoPrint classification. The number of assessed lymph nodes and MSI status lost their significance in the multivariate analysis, and only ColoPrint remained prognostic (HR: 2.16; p 5 .004) (Table 2).
In our data set, 30% of patients received adjuvant 5-FU-based chemotherapy.The decision to administer adjuvant chemo-therapy was correlated with cohort site, year, and clinical risk factors but was not correlated with ColoPrint results, which were not available to the treating physicians. The outcome of patients was not improved by chemotherapy (p 5 .88). Patients who did not receive chemotherapy had a 5-year ROR of 13.8% (95% CI: 9.7%–17.9%), whereas patients who received therapy had a 5-year ROR of 14.8% (95% CI: 8.5%–21.1%).The analysis of ColoPrint in patients who did not receive any adjuvant treatment resulted in the same prognostic power as the analysis of all patients (HR: 2.38; p 5 .008). Neither the clinical factors nor MSI status were significantly prognostic in this subset of patients (Table 2).
In an analysis of the secondary endpoint of disease-free survival, using any recurrence or any cause of death as an event, ColoPrint also significantly distinguished patients with high risk from those with low risk (HR: 1.86; p 5 .003) (data not shown).
Figure 1. Clinical assessment using National Comprehensive Cancer Network guidelines to separate low (green line) and high (red line) risk groups in all stage II patients (n 5 416) (A) and ColoPrint assessment in all stage II patients (n 5 416) (B) and in the T3-Microsatellite-stable subgroup (n 5 301) (C). Results for patients with rectal cancer are shown in supplemental online Figure 1.
T
by guest on September 8, 2015
http://theoncologist.alphamedpress.org/
ColoPrint Analysis in Stage II T3-MSS
MSI and T4 are prognostic indicators currently used in the clinical setting to identify low-risk (MSI-H) and high-risk (T4) stage II patients. In our data set, patients with MSI-H had a low 5-year ROR of 6.6% (95% CI: 0.1%–12.1%), whereas T4 patients had a high 21% ROR (95% CI: 8%–31%). As such, the greatest clinical uncertainty was present for patients with T3 and microsatellite-stable tumors. A subset analyses was performed for patients with T3 and MSS colorectal cancer. ColoPrint was still significantly prognostic in the T3-MSS subgroup (n 5 301) with excellent separation. Of the T3-MSS patients, 59% had ColoPrint low-risk results, which resulted in a 5-year ROR of 9.9% (95% CI: 5.4%–14.4%), whereas patients with a high-risk result had a 5-year ROR of 22.4% (95% CI: 14.8%–30%) (Fig. 1C; Table 4).This corresponds to a hazard of relapse of 2.4 (95% CI: 1.3–4.4),withapvalueof.005.Analysisofdisease-free survival also showed separation of high-risk and low-risk patients with an HR of 1.93 (p 5 .005) at 5 years (data not shown).
DISCUSSION
Risk stratification in stage II colon cancer provides an opportunity for improved delivery of care in a setting of modest adjuvant therapy benefit, competing risks, and necessity to integrate patient preferences. A quarter of colon cancers are diagnosed at stage II, and it has been estimated that 30% of patients subsequently receive adjuvant therapy, with significant variation in practice patterns between providers and healthcare systems. Table 2. Univariate and multivariate analysis of risk of recurrence
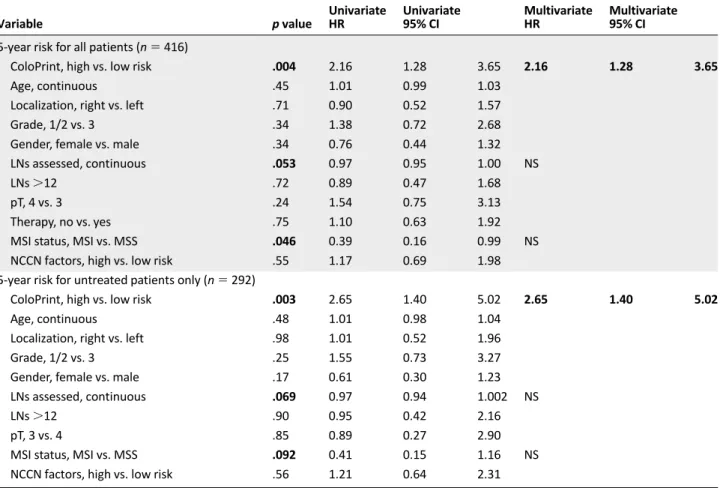
Variable p value Univariate HR Univariate 95% CI Multivariate HR Multivariate 95% CI 5-year risk for all patients (n 5 416)
ColoPrint, high vs. low risk .004 2.16 1.28 3.65 2.16 1.28 3.65
Age, continuous .45 1.01 0.99 1.03
Localization, right vs. left .71 0.90 0.52 1.57
Grade, 1/2 vs. 3 .34 1.38 0.72 2.68
Gender, female vs. male .34 0.76 0.44 1.32
LNs assessed, continuous .053 0.97 0.95 1.00 NS
LNs.12 .72 0.89 0.47 1.68
pT, 4 vs. 3 .24 1.54 0.75 3.13
Therapy, no vs. yes .75 1.10 0.63 1.92
MSI status, MSI vs. MSS .046 0.39 0.16 0.99 NS
NCCN factors, high vs. low risk .55 1.17 0.69 1.98
5-year risk for untreated patients only (n 5 292)
ColoPrint, high vs. low risk .003 2.65 1.40 5.02 2.65 1.40 5.02
Age, continuous .48 1.01 0.98 1.04
Localization, right vs. left .98 1.01 0.52 1.96
Grade, 1/2 vs. 3 .25 1.55 0.73 3.27
Gender, female vs. male .17 0.61 0.30 1.23
LNs assessed, continuous .069 0.97 0.94 1.002 NS
LNs.12 .90 0.95 0.42 2.16
pT, 3 vs. 4 .85 0.89 0.27 2.90
MSI status, MSI vs. MSS .092 0.41 0.15 1.16 NS
NCCN factors, high vs. low risk .56 1.21 0.64 2.31
Bold values indicate p , .05.
Abbreviations: CI, confidence interval; HR, hazard ratio; LN, lymph node; MSI, microsatellite instability; MSS, microsatellite stability; NCCN, National Comprehensive Cancer Network; NS, not significant.
Table 3. Risk assessment by ColoPrint and NCCN Guidelines Assessment
ColoPrint low risk, n (%)
ColoPrint
high risk, n (%) Total
NCCN low risk 156 (37.5) 80 (19.2) 236 (56.7)
NCCN high risk 107 (25.7) 73 (17.5) 180 (43.3)
Total 263 (63.2) 153 (36.8) 416 (100)
Bold values indicate p , .05.
Abbreviation: NCCN, National Comprehensive Cancer Network.
Table 4. Five-year risk of relapse for T3 microsatellite-stable patients only (n 5 301) Variable p value Univariate HR Univariate 95% CI
ColoPrint, high vs. low risk .005 2.40 1.30–4.43
Age, continuous .28 1.02 0.99–1.04
Localization, right vs. left .30 1.40 0.74–2.65
Grade, 1 or 2 vs. 3 .41 1.44 0.61–3.41
Gender, female vs. male .48 0.80 0.42–1.51
LNs assessed, continuous .19 0.98 0.95–1.01
LNs.12 1.00 1.00 0.49–2.03
Therapy, no vs. yes .48 0.78 0.39–1.55
NCCN factors, high vs. low risk .95 1.02 0.55–1.88
Bold values indicate p , .05.
by guest on September 8, 2015
http://theoncologist.alphamedpress.org/
Current guidelines suggest use of clinical or pathological high-risk features and testing for microsatellite instability.
Two of the strongest prognostic factors, the poor-prognosis T4 invasion and good-prognosis mismatch repair deficiency, are commonly used to justify administration and withholding, re-spectively, of chemotherapy. Tumors that penetrate to the vis-ceral peritoneal surface (T4a) or invade into adjacent structures (T4b) have high rates of recurrence even in the absence of nodal involvement, with higher rates of recurrence than T1–2N1 stage III tumors, and are commonly treated with adjuvant therapy. Conversely, adjuvant therapy is routinely withheld from patients with deficient mismatch repair because of their good prognosis and the accumulating data in some but not all studies suggesting lackof benefit when these patients are treated with 5-FU adjuvant therapy [9, 25]. For the∼75% remaining stage II patients (the T3N0 MSS population), there is a need for a prognostic model that can be used for clinical decision making.
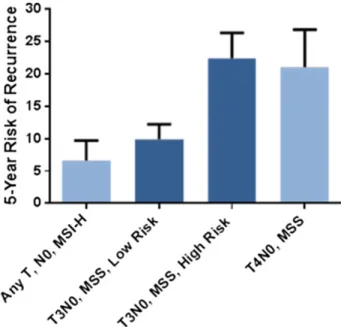
Current clinical and pathological risk factors, as defined by the NCCN Guidelines, poorly predicted outcome in our cohort (HR: 1.3; p 5 .4), consistent with other analyses.Within the T3N0 MSS population, the additional variables in the NCCN Guidelines likewise did not correlate with outcomes (HR: 1.01; p 5 .9). In contrast, ColoPrint classification works independently of these clinical-pathological factors, with no statistically significant correlation of the two (odds ratio for ColoPrint [low vs. high risk]: 1.33; 95% CI: 0.890–1.988). The model identifies fewer high-risk patients than the clinical-pathological high-risk guide-lines (∼7% less) with a higher risk of relapse (21% in ColoPrint high-risk vs. 15% in clinically high-risk patients). This dichotomi-zation of risk is clinically useful, and it is notable that within the T3N0 MSS population, a low-risk result provides a risk of recurrence equivalent to that of the MSI-H population, whereas a high-risk result indicates a recurrence risk equivalent to T4N0 and some node-positive (stage III) patients (Fig. 2).
Although there was no difference in the outcomes of patients treated or not treated with adjuvant therapy, we are limited in drawing conclusions based on this finding because patients were not treated within a randomized clinical trial and the potential benefit of chemotherapy may be too small (∼3%–5%) to be detected in this limited data set [26]. A more recent publication [27] also questions the efficacy of 5-FU-based adjuvant treatment in stage II because earlier beneficial results might conceivably be compromised by a proportion of patients with low numbers of assessed lymph nodes and thus with undiagnosed stage III disease. Because the number of assessed lymph nodes in this data set was very high, we can hypothesize that most patients were correctly staged.
As prognostic models improve, it may be possible to re-evaluate existing classification strategies. Although ColoPrint classification also correlates with MSI status, a minority of MSI-H patients are still classified as high risk (24%), suggesting that additional molecular factors may be useful to better segregate this good-prognosis group. Conversely, a subset of stage III colon cancer patients may be overtreated with combination chemo-therapy, and improved prognostic models may inform the risk-benefit discussion for these patients. An ideal prognostic model would provide the ability to discriminate between risk groups with clinically meaningful and reproducibly validated differences; to allow testing from limited amounts of formalin-fixed, paraffin-embedded (FFPE) samples; and to be paired with appropriate
educational material to facilitate discussion of the results with patients. A variety of assays have been developed that have individual strengths and weaknesses, as recently reviewed [28]. Although ColoPrint provides clinically relevant magnitude of benefit (as noted by the 2.4-fold hazard of relapse between low- and high-risk results for T3-MSS patients), it is currently performed using fresh or frozen tumor samples, requiring prospective planning for fresh tissue collection or mechanisms to routinely collect frozen specimens. Because current clinical practice relies heavily on FFPE samples, this signature is being further developed in FFPE to improve feasibility in clinical practice. Risk models are most useful for patient care when integrated with patient education tools, and numeric literacy allows optimal communication of risk to patients. Several such models are available but are hampered by the limiting discriminatory ability of the existing clinical and pathological risk factors [29, 30].
Collectively, these results further validate the ColoPrint risk index and provide reproducible, clinically meaningful segregation of risk that can be used for patient care. A prospective study has completed enrollment to confirm the clinical utility of these results (ClinicalTrials.gov identifier NCT00903565). By defining a high-risk subset, this advance provides opportunities to study optimal treatment strategies for reduction of risk in this subgroup.
ACKNOWLEDGMENTS
This study was supported by NIH Grants CA95060 and CA16672. Sample collection and annotation of the Institut Catal `a d’Oncologia study were funded by Instituto de Salud Carlos III, FIS Grant PI11-01439 and CIBERESP CB07/02/2005.
AUTHORCONTRIBUTIONS
Conception/Design: Scott Kopetz, Josep Tabernero, Iris Simon, Ramon Salazar Provision of study material or patients: Scott Kopetz, Josep Tabernero, Robert
Rosenberg, Zhi-Qin Jiang, V´ıctor Moreno, Thomas Bachleitner-Hofmann,
Figure 2. Five-year risk of recurrence by ColoPrint risk groups in patients with T3N0 microsatellite stable colon cancer compared with microsatellite unstable and T4N0 colon cancers.
Abbreviations: MSI-H, high microsatellite instability; MSS, microsatellite stability.
T
by guest on September 8, 2015
http://theoncologist.alphamedpress.org/
Giovanni Lanza, Lisette Stork-Sloots, Dipen Maru, Iris Simon, Gabriel Capell `a, Ramon Salazar
Collection and/or assembly of data: Scott Kopetz, Josep Tabernero, Zhi-Qin
Jiang, V´ıctor Moreno,Thomas Bachleitner-Hofmann, Giovanni Lanza, Lisette
Stork-Sloots, Dipen Maru, Iris Simon, Gabriel Capell `a, Ramon Salazar Data analysis and interpretation: Scott Kopetz, Josep Tabernero, Robert
Rosenberg, Zhi-Qin Jiang, V´ıctor Moreno, Thomas Bachleitner-Hofmann,
Giovanni Lanza, Lisette Stork-Sloots, Dipen Maru, Iris Simon, Gabriel Capell `a, Ramon Salazar
Manuscript writing: Scott Kopetz, Josep Tabernero, Robert Rosenberg, Lisette Stork-Sloots, Dipen Maru, Iris Simon, Ramon Salazar
Final approval of manuscript: Scott Kopetz, Josep Tabernero, Robert Rosenberg,
Zhi-Qin Jiang, V´ıctor Moreno, Thomas Bachleitner-Hofmann, Giovanni Lanza,
Lisette Stork-Sloots, Dipen Maru, Iris Simon, Gabriel Capell`a, Ramon Salazar
DISCLOSURES
Lisette Stork-Sloots: Agendia NV (E); Iris Simon: Agendia (E, IP). The other authors indicated no financial relationships.
(C/A) Consulting/advisory relationship; (RF) Research funding; (E) Employment; (ET) Expert testimony; (H) Honoraria received; (OI) Ownership interests; (IP) Intellectual property rights/ inventor/patent holder; (SAB) Scientific advisory board
REFERENCES
1. Siegel R, Naishadham D, Jemal A. Cancer
statistics, 2013. CA Cancer J Clin 2013;63:11–30.
2. World Cancer Research Fund International. Co-lorectal cancer statistics. Available at http://www.wcrf. org/int/cancer-facts-figures/data-specific-cancers/ colorectal-cancer-statistics. Accessed December 21, 2014
3. Nitsche U, Maak M, Schuster T et al. Prediction of prognosis is not improved by the seventh and latest edition of the TNM classification for colorectal cancer in a single-center collective. Ann Surg 2011;
254:793–800; discussion 800–801.
4. Cunningham D, Atkin W, Lenz HJ et al. Colorectal
cancer. Lancet 2010;375:1030–1047.
5. Benson AB III, Schrag D, Somerfield MR et al. American Society of Clinical Oncology recommen-dations on adjuvant chemotherapy for stage II colon
cancer. J Clin Oncol 2004;22:3408–3419.
6. Church D, Midgley R, Kerr D. Biomarkers in early-stage colorectal cancer: Ready for prime time? Dig Dis 2012;30(suppl 2):27–33.
7. O’Connor ES, Greenblatt DY, LoConte NK et al.
Adjuvant chemotherapy for stage II colon cancer with poor prognostic features. J Clin Oncol 2011;29:
3381–3388.
8. Boland CR, Goel A. Microsatellite instability in
colorectal cancer. Gastroenterology 2010;138:
2073–2087, e3.
9. Sargent DJ, Marsoni S, Monges G et al. Defective mismatch repair as a predictive marker for lack of efficacy of fluorouracil-based adjuvant therapy in
colon cancer. J Clin Oncol 2010;28:3219–3226.
10. van‘tVeerLJ,DaiH,vandeVijverMJetal.Gene
expression profiling predicts clinical outcome of
breast cancer. Nature 2002;415:530–536.
11. de Snoo F, Bender R, Glas A et al. Gene expression profiling: Decoding breast cancer. Surg
Oncol 2009;18:366–378.
12. Wang Y, Jatkoe T, Zhang Y et al. Gene expression profiles and molecular markers to predict recurrence
of Dukes’ B colon cancer. J Clin Oncol 2004;22:
1564–1571.
13. Eschrich S, Yang I, Bloom G et al. Molecular staging for survival prediction of colorectal cancer
patients. J Clin Oncol 2005;23:3526–3535.
14. Barrier A, Boelle PY, Roser F et al. Stage II colon cancer prognosis prediction by tumor gene
expres-sion profiling. J Clin Oncol 2006;24:4685–4691.
15. Lin YH, Friederichs J, Black MA et al. Multiple gene expression classifiers from different array platforms predict poor prognosis of colorectal
cancer. Clin Cancer Res 2007;13:498–507.
16. Jiang Y, Casey G, Lavery IC et al. Development of a clinically feasible molecular assay to predict recurrence of stage II colon cancer. J Mol Diagn 2008;
10:346–354.
17. Jorissen RN, Gibbs P, Christie M et al. Metastasis-associated gene expression changes predict poor outcomes in patients with Dukes stage B and C colorectal cancer. Clin Cancer Res 2009;15: 7642–7651.
18. Park YY, Lee SS, Lim JY et al. Comparison of prognostic genomic predictors in colorectal cancer. PLoS One 2013;8:e60778.
19. Salazar R, Roepman P, Capella G et al. Gene expression signature to improve prognosis pre-diction of stage II and III colorectal cancer. J Clin
Oncol 2011;29:17–24.
20. Maak M, Simon I, Nitsche U et al. Independent validation of a prognostic genomic signature (ColoPrint) for patients with stage II colon cancer.
Ann Surg 2013;257:1053–1058.
21. Kopetz S, Jiang ZQ, Overman M et al. Genomic classifier (ColoPrint) predicts outcome and chemo-therapy benefit in stage II and III colon cancer patients. J Clin Oncol 2013;31(suppl):3612a.
22. Edge SB, Byrd DR, Compton CC, eds. Colon and rectum. In: Compton CC, Byrd DR, Garcia-Aguilar J et al., eds. AJCC Cancer Staging Manual, 7th ed.
New York, NY: Springer, 2010:143–164.
23. Tian S, Roepman P, Popovici V et al. A robust genomic signature for the detection of colorectal cancer patients with microsatellite instability phe-notype and high mutation frequency. J Pathol 2012;
228:586–595.
24. NCCN Clinical Practice Guidelines in Oncology (NCCN Guidelines). Colon cancer [version 3, 2013]. Available at http://www.nccn.org/professionals/ physician_gls/f_guidelines.asp#site. Accessed De-cember 21, 2014.
25. Hutchins G, Southward K, Handley K et al.Value of mismatch repair, KRAS, and BRAF mutations in predicting recurrence and benefits from chemo-therapy in colorectal cancer. J Clin Oncol 2011;29:
1261–1270.
26. Sargent D, Sobrero A, Grothey A et al. Evidence for cure by adjuvant therapy in colon cancer: Observations based on individual patient data from 20,898 patients on 18 randomized trials. J Clin Oncol
2009;27:872–877.
27. Shi Q, Andre T, Grothey A et al. Comparison of outcomes after fluorouracil-based adjuvant therapy for stages II and III colon cancer between 1978 to 1995 and 1996 to 2007: Evidence of stage migration from the ACCENT database. J Clin Oncol 2013;31:
3656–3663.
28. Sharif S, O’Connell MJ. Gene signatures in
stage II colon cancer: A clinical review. Curr
Colorectal Cancer Rep 2012;8:225–231.
29. Adjuvant! online. Available at http://www. adjuvantonline.com. Accessed December 21, 2014. 30. Stage III colon cancer calculator. Available at http://www.mayoclinic.org/medical-professionals/ adjuvant-systemic-therapy-tools/colon-cancer.
See http://www.TheOncologist.com for supplemental material available online.
by guest on September 8, 2015
http://theoncologist.alphamedpress.org/