Pressure-volume curve: methods and meaning
S. M. MAGGIORE, L. BROCHARDThe pressure-volume curve of the respiratory system is a physiological method used for diag-nostic purposes to describe the static mechani-cal properties of the respiratory system. A renew-al of interest in the pressure-volume curve has recently appeared because of experimental evi-dence regarding the information conveyed by the curve, a better understanding of the patho-physiologic factors influencing its interpreta-tion and the beneficial results of clinical trials based on the use of the pressure-volume curve for ventilatory management of acute respirato-ry distress syndrome. Thus, adapting ventilato-ry settings to individual characteristics of the patients in terms of respiratory mechanics may be an extremely important aspect for a better management of the most difficult to ventilate patients with acute lung injury. There is consid-erable experimental evidence that both the open-ing-collapse phenomena and the excessive lung stretch may cause damage to the lungs. Therefore tools allowing an individual titration of ventila-tory settings taking into account the constraints of the respiratory system seem highly desirable. The pressure-volume curve might be easily achievable at the bedside as a monitoring tool. The low-flow technique using ventilator tech-nology has several potential advantages. It is hopeful to think that in the future the measure-ment of the P-V curve and the quantification of alveolar recruitment may be easily provided at the bedside and may help for the titration of the ventilatory settings in clinical practice. This review will focus briefly on the physiologic back-ground, technique description, and recent
Address reprint requests to: S. M. Maggiore - Réanimation Médicale, Hôpital Henri Mondor, 94010 Créteil - France. E-mail: [email protected].
From the Department of Medical Intensive Care University of Paris XII, Henri Mondor Hospital
Créteil, France
advances concerning the interpretation of the P-V curve in the critically ill patients.
Key words: Lung mechanics - Pressure-volume curve - Acute respiratory distress syndrome.
T
he pressure-volume (P-V) curve of the respiratory system is a physiological method used for diagnostic purposes to describe the static mechanical properties of the whole respiratory system.1 It has been easily adapted to mechanically ventilated patients because of the relative easiness to obtain reliable signals in sedated and para-lyzed patients, and has given the unique opportunity to apply this pulmonary func-tion test to the most severe situafunc-tions encoun-tered in pulmonary disease.This review will focus briefly on the phys-iologic background, technique description, and recent advances concerning the use and interpretation of the P-V curve in the criti-cally ill patients.
Physiologic background
The P-V relation describes the static behav-ior of the respiratory system and is used to get
information about the structures (lung, chest-wall and airways) of the system.2 3 These mechanical structures can be described by their resistive and elastic properties. The study of the elastic properties of the respir-atory system is relevant when the lungs are principally involved in a pathologic process. To eliminate the resistive, non-elastic factors included in the measured pressures, it is nec-essary to reach static or quasi-static condi-tions. The visco-elastic behavior of the respir-atory system may also influence the P-V curve, at least when it is acquired under dynamic conditions.4 To study the elastic properties of the respiratory system needs also to eliminate the influence of the respir-atory muscles. Patients are therefore usually under deep sedation, and muscle relaxants are most often administered.
During mechanical ventilation, airway pressure depends both on flow, volume and positive end-expiratory pressure (PEEP) gen-erated by the ventilator, and on the resistive and elastic properties of respiratory system. At each moment, the equation of motion allows to describe the relationship between airway pressure and the mechanical proper-ties of the thoraco-pulmonary system:1
(Equation 1) PAW= PRES+ PEL+ PEEP
where PAW is the airway pressure, PRES is the resistive pressure and PEL is the elastic pressure. PRES varies with flow (?) and the resistances (R) of the respiratory system while PEL depends both on volume (V) and elas-tance (E) of the respiratory system.
Developing the PRESand PELterms in Equa-tion 1:
(Equation 2) PAW= (? R) + (V ? E) + PEEP.
Based on these preliminary considerations, the techniques used to trace the P-V curve can be distinguished in static and quasi-stat-ic, or dynamic. With the static methods (the supersyringe and the multiple occlusion tech-niques), the airway pressure is measured during an end-inspiratory pause, i.e, at zero flow. Therefore, the first term in the Equation 2 (?R) is zero and both the flow-resistive and inertial pressures are eliminated. Thus, if the insufflated volume is known, it is possible to
calculate the elastance (and its inverse, the compliance) of the respiratory system. Con-versely, with the dynamic, quasi-static meth-od (the low flow technique), the resistive and the viscoelastic phenomena are present during the measurement of the curve; thus, for a correct evaluation of the elastic proper-ties of the respiratory system it is essential to take these phenomena into account. Never-theless, if a sufficiently low flow is used, PRES becomes negligible and the PAW approxi-mates the PEL. Another approach is to use a sinusoidal flow allowing the exact computa-tion of resistive airway pressure. In this case, the PREScan be subtracted by the PAWto pre-cisely calculate the PEL.
Whatever the technique, the simultane-ous measurement of the airway and esoph-ageal pressure allows the investigator to trace the P-V curves of the lung and of the chest-wall.
Techniques for P-V curve measurement The supersyringe technique
The supersyringe technique was the first described for the static P-V curve measure-ment in ARDS patients.5 6It consisted of an insufflation, starting from the resting volume of the respiratory system to the estimated total lung capacity, accomplished with a cal-ibrated syringe of known volume ranging from 1.5 to 2 liters. Disconnection from the ventilator, allowing a complete exhalation to the resting volume of the respiratory system, was necessary before connection to the syringe. To trace the curve, the respira-tory system was inflated in a stepwise man-ner from the starting volume, considered to be the relaxation volume of the system, to a maximum of 40 to 50 cmH2O and then deflat-ed.7 8
The supersyringe technique has been largely used to describe the modifications of the elastic properties of the respiratory system related to the severity and the stage of the ARDS.6Nevertheless, this method has draw-backs and limitations that have been well described.9 10The procedure is relatively long
and the results may be influenced by oxy-gen consumption, as well as by the changes in gas temperature and humidity. The arti-facts and the cumbersome nature of the pro-cedure have limited the use of this method to the research field.
The multiple occlusion technique
The multiple occlusion technique uses the ventilator capabilities to perform volume and static pressure measurements, during occlu-sions performed with different inflated vol-umes delivered during constant-flow con-trolled ventilation.11 12 After ensuring the absence of leaks in the system, the intrinsic PEEP is measured during an end-expiratory pause before each studied insufflation to ensure the stability of the end-expiratory vol-ume and pressure.13The multiple end-inspir-atory occlusions are performed using differ-ent tidal breaths starting from the same lung volume. The static pressure values, obtained after a few seconds pause, and the exhaled volume after the occlusion release are read on the ventilator monitor. The curve is then con-structed by plotting the volumes against the corresponding static pressures. By acquiring the P-V curves from zero end-expiratory pres-sure (ZEEP) and from PEEP together with the measurement of the lung volume retained by PEEP, it is possible to quantify the alveo-lar recruitment.12 14 15
Compared to the supersyringe technique, the multiple occlusion method offers the advantages of not requiring special equip-ment, and the disconnection of the patient from the ventilator, also allowing the compu-tation of alveolar recruitment, when curves from PEEP and ZEEP are performed. Apart from the relative complexity of the technique, however, the sequential insufflation of the different tidal breaths can modify the lung volume history, thus potentially influencing the shape of the curve. The need to ventilate at ZEEP for a prolonged period can also be poorly tolerated.
The low flow technique
The technical complexity and the cumber-some nature of the apparatus needed with the
above described methods, led to an effort to simplify the measurement of the P-V curve. A dynamic technique using a low constant flow for the curve recording was proposed in the 1970s.16This technique is based on the concept that, during passive lung inflation with constant inspiratory flow, the rate of the airway pressure change is inversely related to the compliance of the respiratory system.17 However, for a correct analysis of the elastic properties of the system, it is necessary to take into account the resistive pressure. Dif-ferent authors have found that results obtained with a sufficiently low flow were highly reproducible and similar to those found with the supersyringe and multiple occlusion methods.14 18 The initial part of the P-V curve was also better visualized com-pared to other techniques. Recently, Servillo
et al.19described a new automated low flow
inflation method, performed with a commer-cial ventilator (Servo Ventilator 900C, Sie-mens-Elema AB, Sweden) controlled by a computer. This method allowed a complete control of the events preceding the measure-ments as well as the calculation of the resis-tances related to the endotracheal tube and to the airway. After subtracting the resistive pressure to the measured airway pressure, the authors showed a good agreement between the results of the automated low flow inflation method (15 L/min) and of the multiple occlusion technique, concerning the chord compliance and the lower inflection point (LIP) values. In some patients slight differences existed at high lung volume con-cerning the upper inflection point (UIP), usu-ally above the tidal range and thus with small practical relevance. This probably reflected the importance of the viscoelastic and/or of the pendelluft phenomena at the higher lung volume.4
Rodriguez et al.20compared the multiple occlusion with the low constant flow meth-od performed with the standard equipment of a commercial ventilator. They found a good agreement between the P-V curves and the linear compliance values with the two techniques, with a slight tendency to overes-timate static pressure with the low flow. The time needed for a complete P-V curve
acqui-sition was 38 minutes with the multiple occlusion versus 3 minutes with the low flow technique.
The previous findings have been con-firmed in a recent study of Lu et al.21These authors compared the P-V curves obtained with two constant flows of 3 and 9 L/min with those acquired with the supersyringe and with the multiple occlusion methods. The constant flow technique was performed with a standard intensive care unit ventilator, allowing the simultaneous display of the curve on the screen and the subsequent anal-ysis using cursors. The pulmonary and tho-raco-pulmonary P-V curves measured with the supersyringe, the multiple occlusions, and the constant flow of 3 L/min were super-imposed. The curves obtained with 9 L/min were slightly shifted to the right because of the flow-dependent resistive component, but this shift seemed to have little clinical rele-vance (the resistive airway pressure resulting from the administration of the 9 L/min con-stant flow was less than 1 cmH2O). The tho-racic P-V curves as well as the values of chord compliance and LIP were identical with all the methods.
Svantesson et al.22 recently evaluated a
similar technique in healthy anesthetized subjects, using a low sinusoidal flow to allow the exact computation of resistive airway pressure. The inspiratory airway resistance determined with the flow interruption tech-nique and with the sinusoidal flow was sim-ilar. Also, an excellent agreement between the values of chord compliance, LIP, and UIP measured with a low constant flow and with the sinusoidal flow was found. The mod-ulated flow seems to permit an accurate measurement of P-V curve in different situ-ations, even in case of high resistances, and without needing a very low flow.
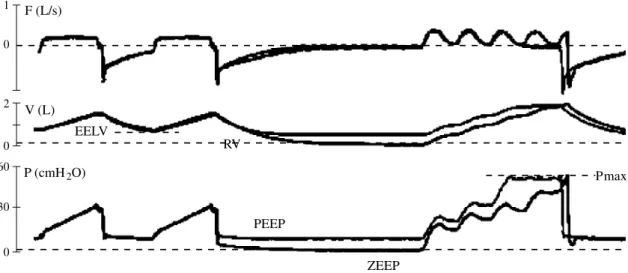
The automated low sinusoidal flow tech-nique has been used in patients with acute lung injury (ALI) by Jonson et al.23(Fig. 1). The authors found that the measurement of inspiratory airway resistance by the flow modulation allowed an accurate determina-tion of the elastic recoil pressures. Because it is a dynamic measurement, viscoelastic forces especially present at high lung vol-umes are included in the calculated elastic pressures.24 For this reason, P-V curve acquired under dynamic conditions may give more realistic information about the pres-sures really exerted on peripheral lung units
1 0 F (L/s) V (L) 0 2 EELV 60 0 30 P (cmH2O) PEEP ZEEP RV Pmax
Fig. 1.—Maneuvers for P-V curves acquisition using the low sinusoidal flow technique. Schema illustrating the record-ing maneuvers for the acquisition of the pressure-volume curves at ZEEP and at PEEP with the low sinusoidal flow tech-nique. The flow (F), volume (V) and pressure (P) signals preceding the insufflations, i.e. the lung volume history, from ZEEP and from PEEP are superimposable. After a prolonged expiration at ZEEP or at PEEP, the insufflation at modulat-ed flow allows to trace the elastic P-V curves at ZEEP and at PEEP, respectively. EELV: end-expiratory lung volume, at PEEP; Pmax: safety maximal pressure; RV: the resting or elastic equilibrium volume, at ZEEP (adapted from 23).
during insufflation, and be more clinically relevant than the static recordings. The con-trol of the lung volume history preceding the measurements, together with the automated and unbiased successive analysis of results, allowed to minimize methodological errors. In conclusion, the low flow technique offers many advantages compared to the oth-er methods. It is easy to use at the bedside, requires much less time than the multiple occlusion technique, and can be done with-out special equipment other than a modern ventilator that supplies a low constant flow (<15 L/min), without the patient’s disconnec-tion from the ventilator. Airway pressure measurement allows the investigator to esti-mate the alveolar pressure when the resis-tive pressure is minimized or subtracted. Moreover, this technique allows P-V curves to be drawn for different ventilatory settings and different levels of PEEP, and can be used to quantify alveolar recruitment.
Interpretation of the inspiratory thora-co-pulmonary P-V curve
In healthy humans, the P-V curve from residual volume to total lung capacity has usually a sigmoidal shape. However, above the functional residual capacity (the lung vol-ume at the end of a normal, quiet expira-tion), in the volume range of tidal ventila-tion, the slope of the curve is usually linear. In ARDS patients, the reduction of the num-ber of normally ventilated alveolar units decreases the range where tidal ventilation occurs, resulting in small variation of volume per unit of pressure change, and the entire curve is flattened.
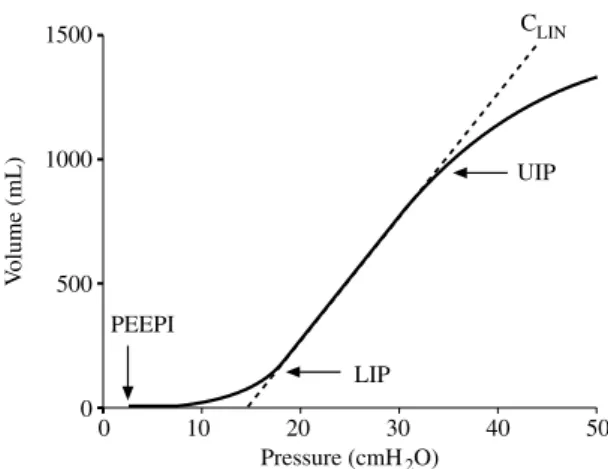
The S-shaped inspiratory P-V curve of ARDS patients can be thought as consisting of three segments (Fig. 2). At low lung volumes, the initial flat segment with very low compli-ance reflects the collapse of peripheral air-ways and lung units.6 16 As insufflation pro-ceeds, an intermediate linear segment with a steeper slope, i.e., a greater chord compli-ance (CLIN), is observed. Compliance remains stable over the linear portion,25reflecting the progressive opening of collapsed alveoli all
along the inflation. At high pressures, but at much smaller lung volumes than in healthy subjects, the P-V curve flattens again with a fast decrease of the slope, i.e. the compli-ance, in its third segment. The transition between the first flat portion and the linear part of the curve is termed the LIP. In ARDS patients, the LIP is usually supposed to rep-resent the mean critical pressure needed to reopen the previously collapsed airways and alveolar units, a phenomenon defined as alveolar recruitment.6 26Similarly, the point at the transition between the linear part and the third segment where the compliance begins to fall is termed the UIP. The UIP may corre-spond to the volume at which overdisten-sion of certain lung units happens 25and/or at which tidal alveolar recruitment ends.27 Then, lung ventilation occurring below the LIP or above the UIP carries the risk of gen-erating repetitive collapse/reopening or over-distension phenomena, both of which are associated with the appearance and the pro-gression of lung injury. Hence, the segment between the LIP and the UIP may represent the zone over which tidal ventilation in ARDS patients should preferentially occur in order
1500 V olume (mL) 1000 500 0 0 10 20 30 40 50 Pressure (cmH2O) LIP UIP PEEPI CLIN
Fig. 2.—Typical inspiratory pressure-volume curve of the respiratory system in a patient with acute respiratory dis-tress syndrome. Volumes are expressed relative to the end-expiratory lung volume at ZEEP. The curve consists of three segments identified by the presence of a lower inflection point (LIP) and an upper inflection point (UIP). The intermediate linear segment has the steeper slope (interrupted line), i.e., the greater compliance (chord com-pliance or CLIN). Note the presence of intrinsic positive
end-expiratory pressure (PEEPi) causing a rightward shift of the curve.
to protect the lung from further injury.28The pressure at LIP has been suggested for the setting of the “best” PEEP in order to optimize recruitment and to prevent end-expiratory collapse, while the tidal volume should be set so that the end-inspiratory pressure (plateau pressure) does not overstep the pressure at UIP.
The above described shape and charac-teristics of the P-V curve is greatly influenced by a number of factors including the patho-physiologic mechanism and the stage 6 of the lung disease, changes of the chest-wall mechanics 29 30 the presence of intrinsic PEEP,31 the ventilatory mode and parame-ters preceding the measurement as well as the technique used to acquire the P-V curve. Other factors make the interpretation of the inspiratory thoraco-pulmonary P-V curve quite difficult. Recent data suggest that the LIP does not indicate either the beginning or the end of recruitment 23 27 which pro-ceeds far above the LIP. Moreover, recent experimental studies 32have shown that tidal ventilation with PEEP does not occur on the inspiratory limb of the whole P-V envelope but on its deflation limb. This implies that the “best” PEEP to prevent end-expiratory collapse has to be set according to the
alveo-lar closing pressures and not the opening pressures.33 To analyze the relationship between the LIP and the alveolar closing pressures we have quantified the derecruit-ment induced by progressively decreasing PEEP levels (20, 15, 10 and 5 cmH2O) with a constant tidal volume (7 mL/kg) in 16 ARDS patients.34The hypothesis was that, if PEEP was set above the closing pressure of the alveoli, a small decrement in PEEP would not result in substantial derecruitment, until the PEEP was set below the closing pres-sure. If derecruitment was found uniformly distributed, the closing pressures might be considered to be spread over a large range of pressures. We found that derecruitment was quite well distributed over the range of the studied PEEP but was predominant at the highest PEEP levels and no correlation existed between the amount of derecruit-ment and the LIP. These results suggest that the closing pressures range is quite large and the alveolar closure begins already at pres-sures as high as 20 cmH2O. Finally, the LIP seems to be poorly correlated with the alveo-lar closure and might not to be the best parameter to set the optimal PEEP in ARDS. The presence of a marked LIP might simply indicate an homogeneously diseased lung and/or the need to recruit the lung,27 35while the measurement of the alveolar closing pres-sures and/or the quantification of the dere-cruitment which could be prevented with the application of PEEP might be more rel-evant for an appropriate PEEP setting. Also the CLIN of the P-V curve from ZEEP gives information about lung recruitment. Indeed, the P-V relationship between LIP and UIP reflects progressive recruitment. This has been recently suggested using a mathemat-ical model 27 and shown in patients with ALI.23 34 We found that the application of PEEP induced a decrease in CLINof the P-V curves from PEEP compared to the CLIN at ZEEP. A relatively low value of CLIN, as observed at high PEEP, may indicate that the lung is well recruited while a high value of CLINon the curve from ZEEP may be inter-preted as a sign of ongoing recruitment occurring during the tidal insufflation. This may explain the good correlation that was
1000 V olume (mL) 750 500 0 0 10 20 30 40 Pressure (cmH2O) Vrecr PEEP 250 ZEEP
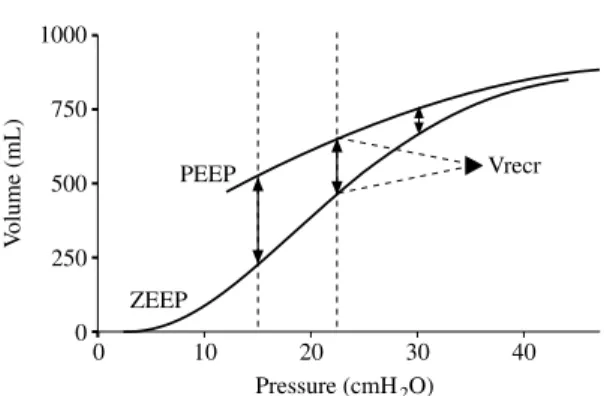
Fig. 3.—Inspiratory elastic pressure-volume curves record-ed from ZEEP and from PEEP in a patient with ARDS. Volumes are expressed relative to the end-expiratory lung volume at ZEEP. The chord compliance of the P-V curve from PEEP is lower than the curve from ZEEP. Recruitment of collapsed alveolar units causes an upward shift of the curve from PEEP. Thus, the recruited lung volume (Vrecr) is expressed by the volume difference between the P-V curve at ZEEP and the P-V curve at PEEP for the same amount of airway pressure. ARDS: acute respiratory dis-tress syndrome; PEEP: positive end-expiratory pressure; ZEEP: zero end-expiratory pressure.
observed between the CLINat ZEEP and the recruitment measured at PEEP 15 cmH2O.34 Therefore, when a high CLIN is present at ZEEP, it may indicate a highly recruitable lung. The UIP was initially related to the beginning of overdistension of certain lung units.25New data show that the UIP may indi-cate that recruitment has ceased during infla-tion, and does not necessarily indicate only overdistension.27Depending on the range of opening pressures, the UIP caused by over-distension can be masked if concomitant recruitment continues above the pressure at UIP.
Chestwall mechanics may affect the P-V relationship of the respiratory system. Mergo-ni et al.29 investigated the impact of chest-wall mechanics on the shape of the P-V curve of the respiratory system, particularly con-cerning the LIP, in patients with acute res-piratory failure. The authors found that only in the majority of patients the LIP on the P-V curve of the respiratory system was due only to the characteristics of the P-V curve of the chestwall. These results suggest that, in some cases, the impairment of the chestwall may explain the LIP seen on the P-V curve of the respiratory system, even if this seems to have limited clinical implications (the higher LIP value found on the P-V curve of the chest-wall was 4.8 cmH2O). Recently, Ranieri et
al.30studied the relative contribution of the chestwall, the lung and the abdomen to the overall impairment of the P-V relationship of respiratory system in ARDS patients. They found that the impairment of the elastic prop-erties of the respiratory system varied with the underlying disease responsible for ARDS. By contrast to patients with medical ARDS, in patients with surgical ARDS, the inflating vol-ume caused a decrease in the respiratory system and the lung compliance associated with alveolar overdistension. While the med-ical ARDS patients had normal chestwall and abdominal curves, patients with surgical ARDS had chestwall and abdominal P-V curves shifted rightward and flattened. This suggested that the flattening of the P-V curves of the respiratory system observed in some ARDS patients might be secondary to abdom-inal distension.
Alveolar recruitment
Alveolar recruitment, i.e., the reopening of the previously collapsed lung units, is the cornerstone of some recent protective ventil-atory strategies in ARDS.36Indeed, it has been suggested that the presence of atelectasis may have an injurious effect on the lung, causing the maintenance and the increase of lung and systemic inflammation (“atelectrau-ma”).37 38 Reversing such a deleterious phe-nomenon and recruiting the collapsed alveo-li, together with reducing the intrapulmonary shunt and improving oxygenation, are goals of lung protection.28Therefore, the analysis of the effect of PEEP on alveolar recruitment is of special concern in the management of ARDS patients. No precise quantification of recruitment had been made before the stud-ies by Ranieri and coworkers.12 14 15 The authors simply measured the end expiratory lung volume above the relaxation volume both during ZEEP and during PEEP ventila-tion. They could therefore place both curves (traced on ZEEP and on PEEP) on the volume axis referencing similarly the two curves to the relaxation volume of the respiratory system. Recruitment of lung units was calcu-lated as the difference in lung volume between ZEEP and PEEP at the same airway pressure (Fig. 3). Using this method, Jonson
et al.23have recently evaluated the amount of
volume recruited by PEEP in ALI patients. The low sinusoidal flow technique was used to measure the P-V curves at PEEP and, after a single prolonged expiration during which PEEP was eliminated, at ZEEP. A significant recruitment occurred with PEEP, ranging from 205 mL at 15 cmH2O to 78 mL at 30 cmH2O, and a correlation was found between the LIP value and the amount of alveolar recruit-ment. As previously reported, linear compli-ance was always lower on the curve record-ed at PEEP than on the curve at ZEEP, relat-ed to the PEEP-inducrelat-ed lung recruitment phe-nomena. If the effect of PEEP on recruitment is well known, relatively scarce data exist in the literature about the influence of tidal vol-ume (Vt). We have recently investigated the effect of two tidal volumes (low, 6 mL/kg,
and conventional, 10 mL/kg) on the alveolar recruitment in 15 ARDS patients.39The PEEP was kept constant with the two Vt and set at the LIP on the P-V curve recorded from ZEEP. Compared to the conventional Vt, the low Vt induced a significant alveolar derecruitment. The alveolar derecruitment induced by the low Vt was completely reversed by a re-expansion maneuver and prevented by the application of the higher level of PEEP (4 cmH2O above the LIP). These results show that both PEEP and Vt have an influence on the recruitment of the lung. When Vt is reduced, setting the PEEP at LIP does not guarantee an optimal recruitment suggest-ing that LIP may not be the best parameter for PEEP setting. Thus, these results rein-force the idea that the Vt reduction, actual-ly recommended in order to protect the lung,40has to be associated with higher lev-els of PEEP, often well above the LIP, to pre-vent derecruitment. Concerning the effect of a re-expansion maneuver, it is interesting to note that it was effective in increasing alveo-lar recruitment only when performed dur-ing low tidal ventilation, while it produced no effect with the conventional Vt. In other terms, if the lung is well recruited a re-expan-sion maneuver is relatively ineffective while, when effective, it may simply indicate that the lung was not optimally recruited.
Conclusions
Adapting ventilatory settings to individual characteristics of the patients in terms of res-piratory mechanics, gas exchange and hemo-dynamics may be an extremely important aspect for a better management of the most difficult to ventilate patients with ALI or ARDS.41There is considerable experimental evidence that both the opening-collapse phe-nomena and the excessive lung stretch may cause damage to the lungs. Therefore tools allowing an individual titration of ventilato-ry settings taking into account the constraints of the respiratory system seem highly desir-able. The pressure-volume curve might be easily achievable at the bedside as a monitor-ing tool. The low-flow technique usmonitor-ing
ven-tilator technology has several potential advantages. It is thus tempting to think that in the future the measurement of the P-V curve and the quantification of alveolar recruitment may be easily provided at the bedside and may help for the titration of the PEEP level and of the tidal volume.
Riassunto
La curva pressione-volume del sistema respirato-rio è una metodica fisiologica utilizzata a scopo dia-gnostico per descrivere le proprietà meccaniche sta-tiche del sistema respiratorio. Un rinnovato interes-se nella curva pressione-volume è stato recentemente suscitato dai dati sperimentali riguardanti le infor-mazioni che si possono ottenere dalla curva, da una migliore comprensione dei fattori fisiopatologici che influenzano la sua interpretazione e dai risultati posi-tivi degli studi clinici che hanno basato sull’uso del-la curva pressione-volume il trattamento ventidel-latorio della acute respiratory distress syndrome. Adattare i parametri della ventilazione alle caratteristiche indi-viduali dei pazienti, in termini di meccanica respira-toria, può costituire un aspetto estremamente impor-tante nel trattamento dei pazienti con danno pol-monare acuto che presentino gravi difficoltà di ven-tilazione. Esiste una considerevole evidenza speri-mentale che sia i fenomeni di apertura-collasso sia un eccessiva distensione del parenchima polmonare sia-no in grado di provocare un dansia-no polmonare. Tut-ti gli strumenTut-ti che consentano una regolazione indi-viduale dei parametri ventilatori, che tenga conto dei limiti entro cui è costretto il sistema respiratorio, sembrano essere, quindi, altamente desiderabili. La curva pressione-volume può essere facilmente otte-nuta al letto del paziente, come un sistema di moni-toraggio abituale. La tecnica a basso flusso, che sfrut-ta la tecnologia del ventilatore, ha diversi potenzia-li vantaggi. È auspicabile che nel futuro la misura-zione della curva P-V e la quantificamisura-zione del reclu-tamento alveolare possano essere facilmente acces-sibili al letto del malato e possano aiutare la regola-zione dei parametri ventilatori nella pratica clinica. Questa review presenta brevemente il background fisiologico, la descrizione della tecnica e i più recen-ti progressi nell’interpretazione della curva P-V nei pazienti critici.
Parole Chiave: Curva pressione-volume - Acute respi-ratory distress syndrome - Meccanica respiratoria.
References
1. Brochard L. Respiratory pressure-volume curves. In: Tobin MJ, editor. Principles and practice of intensive care monitoring. Columbus, Ohio, USA: McGraw-Hill for Library of Congress, 1998;Pt2:579-616.
2. Rahn H, Fenn WO, Otis AB. The pressure-volume dia-gram of the thorax and the lung. Am J Physiol 1946; 146:161-78.
3. Radford Jr E. Static mechanical properties of mammal-ian lungs. In: Handbook of Physiology. Respiration Sec-tion 3. In: Fenn WO, Rahn H, editors. Washington DC, USA: American Physiological Society, 1964;1:429-49. 4. Shardonofsky FR, Skaburskis M, Sato J, Zin WA,
Milic-Emili J. Effects of volume history and vagotomy on pulmonary and chest wall mechanics in cats. J Appl Physiol 1991;71:498-508.
5. Janney CD. Super-syringe. Anesthesiology 1959:709-11.
6. Matamis D, Lemaire F, Harf A, Brun-Buisson C, Ansquer JC, Atlan G. Total respiratory pressure-volume curves in the adult respiratory distress syndrome. Chest 1984;86:58-66.
7. Mancebo J, Calaf N, Benito S. Pulmonary compliance measurement in acute respiratory failure. Crit Care Med 1985;13:589-91.
8. Benito S, Lemaire F. Pulmonary pressure-volume rela-tionship in acute respiratory distress syndrome in adults: role of positive end-expiratory pressure. J Crit Care 1990;5:27-34.
9. Dall’Ava-Santucci J, Armaganidis A, Brunet F, Dhai-naut JF, Chelucci GL, Monsallier JF et al. Causes of error in respiratory pressure-volume curves in para-lyzed subjects. J Appl Physiol 1988;64:42-9.
10. Gattinoni L, Mascheroni D, Basilico E, Foti G, Pesenti A, Avalli L. Volume/pressure curve of total respiratory system in paralysed patients: artifacts and correction fac-tors. Intensive Care Med 1987;13:19-25.
11. Levy P, Similowski T, Corbeil C, Albala M, Pariente R, Milic-Emili J et al. A method for studying the static vol-ume-pressure curves of the respiratory system during mechanical ventilation. J Crit Care 1989;4:83-9. 12. Ranieri VM, Eissa NT, Corbeil C, Chassé M, Braidy J,
Matar N et al. Effects of positive end-expiratory pres-sure on alveolar recruitment and gas exchange in patients with the adult respiratory distress syndrome. Am Rev Respir Dis 1991;144:544-51.
13. Rossi A, Gottfried SB, Zocchi L, Higgs BS, Lennox S, Cal-verley PMA et al. Measurement of static compliance of the total respiratory system in patients with acute res-piratory failure during mechanical ventilation. The effect of intrinsic positive end expiratory pressure. Am Rev Respir Dis 1985;131:672-7.
14. Ranieri VM, Giuliani R, Fiore T, Dambrosio M, Milic-Emili J. Volume-pressure curve of the respiratory system predicts effects of PEEP in ARDS: “occlusion” versus “constant flow” technique. Am J Respir Crit Care Med 1994;149:19-27.
15. Ranieri VM, Mascia L, Fiore T, Bruno F, Brienza A, Giuliani R. Cardiorespiratory effects of positive end-expiratory pressure during progressive tidal volume reduction (permissive hypercapnia) in patients with acute respiratory distress syndrome. Anesthesiology 1995;83:710-20.
16. Falke KJ, Pontoppidan H, Kumar A, Leith DE, Geffin B, Laver HB. Ventilation with positive end-expiratory pressure in acute lung disease. J Clin Invest 1972;51:2315-23.
17. Bates JHT, Rossi A, Milic-Emili J. Analysis of the behav-ior of the respiratory system with constant inspiratory flow. J Appl Physiol 1985;58:1840-8.
18. Mankikian B, Lemaire F, Benito S, Brun-Buisson C, Harf A, Maillot JP, Becker J. A new device for measure-ment of pulmonary pressure-volume curves in patients on mechanical ventilation. Crit Care Med 1983;11:897-901.
19. Servillo G, Svantesson C, Beydon L, Roupie E, Broch-ard L, Lemaire F et al. Pressure-Volume curves in acute respiratory failure. Automated low flow inflation versus occlusion. Am J Respir Crit Care Med 1997;155:1629-36. 20. Rodriguez L, Marquer B, Mardrus P, Molenat F, Le Grand JL, Reboul M et al. A new simple method to perform pressure-volume curves obtained under qua-si-static conditions during mechanical ventilation. Inten-sive Care Med 1999;25:173-9.
21. Lu Q, Vieira SRR, Richecoeur J, Puybasset L, Kalfon P, Coriat P et al. A simple automated method for measur-ing pressure-volume curves durmeasur-ing mechanical venti-lation. Am J Respir Crit Care Med 1999;159:275-82. 22. Svantesson C, Drefeldt B, Sigurdsson S, Larsson A,
Brochard L, Jonson B. A single computer-controlled mechanical insufflation allows determination of the pressure-volume relationship of the respiratory system. J Clin Monit Comput 1999;15:9-16.
23. Jonson B, Richard JC, Straus C, Mancebo J, Lemaire F, Brochard L. Pressure-volume curves and compliance in acute lung injury. Evidence of recruitment above the lower inflection point. Am J Respir Crit Care Med 1999;159:1172-8.
24. Beydon L, Svantesson C, Brauer K, Lemaire F, Jonson B. Respiratory mechanics in patients ventilated for crit-ical lung disease. Eur Respir J 1996;9:262-73. 25. Roupie E, Dambrosio M, Servillo G, Mentec H, El Atrous
S, Beydon L et al. Titration of tidal volume and induced hypercapnia in acute respiratory distress syndrome. Am J Respir Crit Care Med 1995;152:121-8.
26. Gattinoni L, Pesenti A, Avalli L, Rossi F, Bombino M. Pressure-volume curve of total respiratory system in acute respiratory failure: computed tomographic scan study. Am Rev Respir Dis 1987;136:730-6.
27. Hickling KG. The pressure-volume curve is greatly mod-ified by recruitment. A mathematical model of ARDS lungs. Am J Respir Crit Care Med 1998;158:194-202. 28. Artigas A, Bernard GB, Carlet J, Dreyfuss D, Gattinoni
L, Hudson L et al. The American-European Consen-sus Conference on ARDS. Ventilatory, pharmacologic, supportive therapy, study design strategies, and issues related to recovery and remodeling. Am J Respir Crit Care Med 1998;157(Pt2):1332-47.
29. Mergoni M, Martelli A, Volpi A, Primavera S, Zuccoli P, Rossi A. Impact of positive end-expiratory pressure on chest wall and lung pressure volume curve in acute res-piratory failure. Am J Respir Crit Care Med 1997;156:846-54.
30. Ranieri VM, Brienza N, Santostasi S, Puntillo F, Mascia L, Vitale N et al. Impairment of lung and chest wall mechanics in patients with acute respiratory distress syndrome. Role of abdominal distension. Am J Respir Crit Care Med 1997;156:1082-91.
31. Fernandez R, Mancebo J, Blanch L, Benito S, Calaf N, Net A. Intrinsic PEEP on static pressure-volume curves. Intensive Care Med 1990;16:233-6.
32. Rimensberger PC, Cox PN, Frndova H, Bryan AC. The open lung during small tidal volume ventilation: con-cepts of recruitment and “optimal” positive end-expir-atory pressure. Crit Care Med 1999;27:1946-52. 33. Rimensberger PC, Pristine G, Mullen BM, Cox PN,
Slut-sky AS. Lung recruitment during small tidal volume ventilation allows minimal positive end-expiratory pres-sure without augmenting lung injury. Crit Care Med 1999;27:1940-5.
34. Maggiore SM, Jonson B, Richard JC, Jaber S, Lemaire F, Brochard L. Alveolar derecruitment at decremental PEEP levels in acute lung injury. Comparison with the lower inflection point, oxygenation and compliance. Am J Respir Crit Care Med 2001, submitted.
35. Vieira SR, Puybasset L, Lu Q, Richecoeur J, Cluzel P, Coriat P et al. A scanographic assessment of pulmonary morphology in acute lung injury. Significance of the lower inflection point detected on the lung pressure-volume curve. Am J Respir Crit Care Med 1999;159: 1612-23.
36. Lachmann B. Open the lung and keep the lung open. Intensive Care Med 1992;18:319-21.
37. Muscedere JG, Mullen JBM, Gari K, Bryan AC, Slutsky AS. Tidal ventilation at low airway pressures can aug-ment lung injury. Am J Respir Crit Care Med 1994;149: 1327-34.
38. Slutsky AS, Tremblay LN. Multiple system organ fail-ure. Is mechanical ventilation a contributing factor? Am J Respir Crit Care Med 1998;157:1721-5.
39. Richard JC, Maggiore SM, Jonson B, Mancebo J, Lemaire F, Brochard L. Influence of tidal volume on alveolar recruitment. Respective role of PEEP and a recruitment maneuver. Am J Respir Crit Care Med 2001, in press.
40. The Acute Respiratory Distress Syndrome Network. Ventilation with lower tidal volumes as compared with traditional tidal volumes for acute lung injury and the acute respiratory distress syndrome. N Engl J Med 2000;342:1301-8.
41. Ranieri VM, Suter PM, Tortorella C, De Tullio R, Day-er JM, Brienza A et al. Effect of mechanical ventilation on inflammatory mediators in patients with acute res-piratory distress syndrome: a randomized controlled trial. JAMA 1999;282:54-61.