UNIVERSITÀ DEGLI STUDI DELLA CALABRIA
DOTTORATO DI RICERCA IN
MECCANICA COMPUTAZIONALE
XIX CICLO
SETTORE SCIENTIFICO DISCIPLINARE ICAR 08
POST-BUCKLING BEHAVIOUR OF
TRANSVERSELY STIFFENED PLATE GIRDERS
FRANCESCO PRESTA
Dissertazione presentata per il conseguimento del titolo di
Dottore di Ricerca in Meccanica Computazionale
UNIVERSITÀ DEGLI STUDI DELLA CALABRIA
Luogo e data
Cosenza, Novembre 2007
Autore Francesco Presta
Titolo Post-buckling
behaviour
of
transversely stiffened plate girders
Dipartimento
Strutture
Firma
dell’autore
Firma
del
tutor
Table of Contents
Abstract
iii
Acknowledgement
iv
Introduction 1
1
Tension field theories
1.1 Cardiff tension field theory 1.2 Stockholm rotating stress field theory4
6 11
2
Calibration of FE modelling
2.1 Results of initial FE calibration analysis on test TGV8-2 2.1.1 FE model set-up 2.1.2 Results of FE modelling with ‘Initial Deflection 1’ 2.1.3 Results of FE modelling with ‘Initial Deflection 2’ 2.1.4 Comparison of TGV8-2 FE modelling output with laboratory test results 2.1.5 Discussion of results 2.2 Results of initial FE calibration analysis on test TGV7-2 2.2.1 FE model set-up 2.2.2 Results of FE modelling with ‘Initial Deflection 1’ 2.2.3 Results of FE modelling with ‘Initial Deflection 2’ 2.2.4 Comparison of TGV7-2 FE modelling output with laboratory test results 2.2.5 Discussion of results 2.3 Conclusions from FE calibration exercises15
15 15 17 19 20 22 23 23 23 25 26 28 293 FE
modelling
3.1 Layout 3.2 Stiffeners 3.3 Imperfections30
30 31 323.4 Materials properties 3.5 Meshing 3.6 Loading 3.7 Non-linear analysis control
33 34 34 35
4
Non-linear FE study
4.1 Symmetrical steel girder 4.1.1 Case 2-1 4.1.2 Case 11 4.2 Steel-concrete composite girder 4.2.1 Case 1 4.2.2 Case 3 4.2.3 Case 6 4.3 Discussion of results 4.3.1 General behaviour of web in bending and shear 4.3.2 Symmetrical steel girder Behaviour Forces in the intermediate stiffeners The influence of longitudinal stresses 4.3.3 Steel-concrete composite girderBehaviour Forces in the intermediate stiffeners M-V interaction 4.3.4 Beam with weak stiffener yield strength
37
37 40 66 93 96 116 135 154 154 155 155 155 157 157 157 158 159 159Conclusions
Bibliography
Appendix A – Calculation of critical stresses
163
164
166
Abstract
Many investigations have been carried out to date into the behaviour of transversely stiffened web panels in bending and shear and many different theories have been proposed. Different code rules have been developed based on these theories. The British steel bridge code, BS 5400 Part 3, based its design rules for transverse stiffeners on the work of Rockey, while early drafts of Eurocode prEN 1993-1-5 were based on the work of Höglund. The former's tension field theory places a much greater demand on stiffener strength than does the latter's rotated stress field theory. Due to a lack of European agreement, EN 1993-1-5 was modified late on its drafting to include a stiffener force criterion more closely aligned to that in BS 5400 Part 3. The rules for stiffener design in EN 1993-1-5 are thus no longer consistent with the rotated stress field theory and lead to a greater axial force acting in the stiffener. The rules for the design of the web panels themselves in shear however remain based on Höglund's rotated stress field theory, creating an inconsistency.
Recent investigations have suggested that the rules in BS 5400 Part 3 and, to a lesser extent, in the current version of EN 1993-1-5 can be unduly pessimistic. This thesis investigates the behaviour of transversely stiffened plate girders in bending and shear using non-linear finite element analyses. It considers slender symmetrical steel girders with and without axial force and also steel-concrete composite plate girders (which are therefore asymmetric). It discusses the observed web post-buckling behaviour, compares it with the predictions of other current theories and recommends modified design rules. It includes investigation into whether a stiffness-only approach to stiffener design can be justified, rather than a combined stiffness and force approach. The shear-moment interaction behaviour of the girders as a whole are also investigated and compared to the codified predictions of BS 5400 Part 3 and EN 1993-1-5.
Acknowledgements
I would like to thank Professor Emilio Turco for being my guide during these years, for his availability in meeting me during the limited time I was in Cosenza and for his general revision of this work.
I also would like to thank Rosamaria Iaccino for helping me in submitting this thesis. She was kind, as always, even though this period was quite frantic for her for the submission of her own thesis.
I am grateful to my wife Tiziana for her patience and understanding in the last three years. I studied over the weekends and during our free time, and she was always supportive and confident I could successfully complete this Doctorate. A huge thank you for your patience and for your love.
Finally, a particular thank you is due to Chris Hendy. He gave me the initial idea for this research, he put at my disposal his knowledge, publications, bibliography search and time in the day-to-day supervision of this work. Any acknowledgements would be inadequate because I share with him the successful completion of this Doctorate.
Rende (Cosenza), Italy Francesco Presta
Introduction
It was known since the 30’s that transversely stiffened web panels in bending and shear had a post-critical resistance, but only in the ‘50s the behaviour was for the first time investigated [2,3]. The experimental and theoretical research undertaken resulted in a deeper knowledge on the nature of stability of plated structures. After that many investigations have been carried out to date, many different theories have been proposed and design rules have been developed based on these theories.
The shear resistance theories behind most codes (e.g. the tension field theory of Rockey in BS 5400 Part 3 and Höglund’s rotated stress field theory in EN 1993-1-5) assume that the web operates in pure shear until elastic critical buckling occurs, and bands of tension form to carry further increases in shear. What is not agreed at present across Europe is the force induced in the stiffeners when these tension fields develop.
Rockey’s tension field theory places a much greater demand on stiffener strength than does Höglund’s rotated stress field theory. In fact, according to the former’s theory, after the shear in a plate panel has exceeded the elastic critical shear buckling load of the panel, any additional shear is resisted by diagonal tensile and compression zones in the buckled web. For equilibrium, vertical force components are induced in the stiffeners. On the other hand, Höglund’s theory does not require the stiffeners to carry any load other than the part of the tension field anchored by the flanges. In the absence of a stiff flange to contribute, the stiffeners simply contribute to elevating the elastic critical shear stress to the web. Earlier versions of EN 1993-1-5 thus required web stiffeners to be designed and checked for adequate “stiffness-only”, an approach believed to be consistent with several other European standards.
These early drafts of EN 1993-1-5 raised concern in the UK as a stiffness-only check was not compatible with the strength based tension field theory approach traditionally used in BS 5400 Part 3. EN 1993-1-5 was then modified late on its drafting to include a stiffener force criterion more closely aligned to that in BS 5400 Part 3, as a result of objection from the UK. The rules for stiffener design in EN 1993-1-5 are thus no longer consistent with the rotated stress field theory and lead to a greater axial force acting in the stiffener. The rules for the design of the web panels themselves in shear however remain based on Höglund's rotated stress field theory, creating an inconsistency.
The use of a stiffness-only approach would give the optimum opportunity for mitigating assessment over-stresses in transverse stiffeners and reducing steel bridge strengthening costs. Nevertheless, the use of a stiffness-only approach is complicated by the absence of sufficient background papers proving the stiffener assessment clauses to be safe.
Another difference between the two codes occurs in the treatment of coexisting axial stresses. Axial stresses in the web, induced by either external axial loads or unsymmetrical sections, are assumed to have no effect on the shear buckling load of the plate panel in EN 1993-1-5. In BS 5400 axial stresses are assumed to reduce the elastic critical shear buckling load of the plate panel. In same cases, BS 5400 predicts that the axial stresses are high enough to render the elastic critical shear buckling resistance of the web as negligible. In those cases, all of the applied shear is then carried on the stiffener, resulting in an assessment overstress or in a conservative design. As EN 1993-1-5 does not require the elastic critical shear buckling load to be reduced in the presence of axial stresses, this results in the stiffeners passing the assessment or in a more sensible design. Given the general feeling in Europe that the force in the stiffeners produced by the BS 5400 approach was already too conservative, any further increase in force due to axial stresses was rejected by the drafters of EN 1993-1-5.
Both the methods appear to be quite conservative when compared with test results indicating that only small forces are developed in transverse stiffeners. Höglund’s rotated stress field theory predicts low stiffener forces as observed in earlier non-linear finite element studies, whilst it does not predict a tension-field direction that necessarily aligns with the stiffener ends in contrast with test observations. Rockey’s tension field predicts higher stiffener forces but predicts a tension field direction that aligns with the stiffener ends.
This thesis investigates in detail, with the use of a non-linear finite element analysis package, the behaviour of a plate girder arrangement, and seeks to investigate:
1) the adequacy of the “stiffness-only” approach to stiffener design and assessment; 2) the effects of axial stresses in the web on the stiffener;
3) the mechanism for resisting shear if the stiffeners are not picking up tension field forces acting as web members of a truss;
5) the effects of the ratio M/V of bending moment to shear force on the collapse load and comparison with moment-shear interaction diagrams produced by Eurocode EN 1993-1-5;
6) sensitivity of the collapse load to web and stiffener imperfections. It is organized as follows:
− in the 1st chapter a brief review of the most important tension field theories proposed
in the literature is reported;
− in the 2nd chapter a calibration exercise is performed. Tests from [11] are modelled
with non-linear finite element analyses in order to gain confidence in the results for subsequent analyses;
− in the 3rd chapter the finite element modelling is discussed, along with the parameters
used and the non-linear analysis strategy adopted;
− in the 4th chapter the investigation into the behaviour of symmetrical steel girders and
steel-concrete composite plate girders is reported and a new proposed approach is discussed.
Chapter 1
Tension field theories
Many investigations have been carried out to date into the behaviour of transversely stiffened web panels in bending and shear and many different theories have been proposed.
Nevertheless a general and rigorous solution is not possible due to the complexity of the problem, which is non-linear for geometry and material. Generally the theories are based on approximated or empirical procedures or on collapse mechanisms chosen to suit available experimental results. These have indicated that, when a thin walled plate girder is loaded in shear, failure occurs when the web plate yields under the joint action of the post-buckling membrane stress and the initial buckling stress of the web panel, and plastic hinges develop in the flanges, as shown in Figure 1.2.
Figure 1.2 – High shear test from (Extract from [21])
Different code rules have been developed based on these theories. The British steel bridge code, BS 5400 Part 3, based its design rules on Rockey’s tension field theory [8,9]. Höglund’s rotating stress field theory [10] formed the basis of the simple post-critical design procedure for predicting the ultimate shear resistance of stiffened and unstiffened plate girders in ENV 1993-1-5. A second procedure in ENV 1993-1-5 was the tension field method, which could be only applied to girders having intermediate transverse stiffeners and web panel aspect ratios b/d (width of web/depth of web panel) between 1.0 and 3.0. This method was based on the Rockey’s tension field theory and was intended to produce more economical designs for a limited range of girder configurations. Theoretical predictions of the ultimate shear resistance of the plate girders based on the simple post-critical design procedure appeared inconsistent and conservative when compared with currently available test data, primarily because it neglected the contribution of flanges to the ultimate shear resistance. Theoretical predictions based on the tension field design procedure, taking into account the limited range of web panel aspect ratios, were less
conservative. Höglund’s rotating stress field theory forms the basis of EN 1993-1-5. It contains supplementary rules for planar plated structures without transverse loading, developed together with the EN 1993-2 Steel Bridges. It covers stiffened and unstiffened plates in common steel bridges and similar structures. These rules are not specific for bridges, which is the reason for making them a part of EN 1993-1, which contains general rules. The resistance of slender plates to shear according to EN 1993-1-5 replaces the two methods in ENV 1993-1-1.
1.1 Cardiff tension field theory
The tension field theory developed by Rockey et al. [8,9] is the basis of the post-critical design procedure for predicting the ultimate shear resistance of plate girders in BS 5400 Part 3. According to this theory the loading of the panel can be divided into three phases as shown in Figures 1.3, 1.5 and 1.6.
Stage 1. A uniform shear stress develops throughout the panel prior buckling, with
principal tensile and compressive stresses of magnitude
τ
acting at 45° and 135°.Figure 1.3 – Shear failure mechanism assumed in Cardiff theory (Stage 1)
This stress system exists until the shear stress
τ
equals the critical shear stressτ
cr. Thebuckling shear stress
τ
cr for a simply supported rectangular plate is given by:(
)
2 2 2 b crd
t
1
12
E
k
⎟
⎠
⎞
⎜
⎝
⎛
−
=
υ
π
τ
1
d
/
b
for
b
d
4
35
.
5
k
2 b⎟
≥
⎠
⎞
⎜
⎝
⎛
+
=
1
d
/
b
for
4
b
d
35
.
5
k
2 b⎟
+
<
⎠
⎞
⎜
⎝
⎛
=
Figure 1.4 – Buckling coefficient for simply supported plates in shear (Extract from [4])
Stage 2. Once the critical shear stress
τ
cr is reached, the panel cannot sustain anyincrease in compressive stress and it buckles. The load carrying system changes and any additional load is supported by the tensile membrane stress
σ
t. Under the action of thismembrane stress, the flanges bend inward and the extend of the inclination of the tensile membrane stress field is influenced by the rigidity of the flanges.
Stage 3. Additional load can be carried until the tensile membrane stress
σ
t plus thebuckling stress
τ
cr produces yielding in the web. The membrane stress at this point isσ
t,y .Failure occurs when hinges have formed in the flanges.
Figure 1.6 – Shear failure mechanism assumed in Cardiff theory (Stage 3)
It is then possible to establish a set of forces and moments which together with the yield zone form an equilibrium solution which does not violate the yield condition.
The ultimate shear resistance Vs of the transversely stiffened girder is expressed as:
t pft c pfc t c 2 y , t cr s
c
M
2
c
M
2
2
c
2
c
b
cos
d
sin
t
t
d
V
⎟
+
+
⎠
⎞
⎜
⎝
⎛
−
+
+
+
=
τ
σ
θ
θ
where:− Mpfc and Mpft are the plastic moments of the compression and tension flanges;
− cc and ct are the distances at which plastic hinges form in the flanges;
−
θ
is the angle of inclination of the web tension-field stressσ
t,y.The position of the internal hinges is obtained by equilibrium considerations: t M sin 2 c y , t pfc c σ θ =
t M sin 2 c y , t pft t σ θ =
The angle
θ
can be either determined by iteration to give the maximum value of Vs orapproximated as ⎟ ⎠ ⎞ ⎜ ⎝ ⎛ = − b d tan 3 2 1 θ
Substituting equations for cc and ct into equation for Vs and assuming that Mpfc = Mpft, the
ultimate shear resistance can be rewritten as
)
cot
(cot
sin
t
d
sin
t
c
2
t
d
V
y 2 d t 2 y , t cr s=
τ
+
σ
θ
+
σ
θ
θ
−
θ
where
θ
d is the inclination of the web panel diagonal.Interaction between shear and coexisting bending moment is represented by diagram in Figure 1.7, which defines the coexisting values of shear and bending that will result in failure of the girder.
VS Vyw S S' C B D Vyw VULT M MP M P MS' M F M P M P M U 1.0 Vyw VC VB Vyw SHEAR TYPE MECHANISM FLANGE CRITERION CONTROLS E
Point S represents the collapse load when the panel is subjected to pure shear. Point C represents the position on the interaction diagram at which the mode of failure changes from the shear mechanism mode to the flange failure mode. This change occurs when the applied bending moment M is approximately equal to MF, which is the contribution of the
flanges to the plastic moment of resistance of the girder. When the panel is subjected primarily to bending stresses, inward collapse of the compression flange occurs when the applied moment is close to that which will result in the extreme flange bending stress reaching the yield stress. Where the web plate buckles before collapse, it is not possible for the plate girder to develop the full plastic moment of resistance. Point D corresponds to the bending moment at which this inward collapse of the flange occurs. Vyw is the shear
yield resistance of the web and MP is the fully plastic moment of the girder.
Transverse stiffeners have to fulfill two main functions. The first function is to increase the buckling resistance of the web plate. The second is to continue to remain effective when the web plate buckles and develops a tension field. They also have to restrict the tendency of the flanges to approach each other and are therefore subjected to compressive loadings. Prior to buckling, stiffeners are not subjected to any axial loading but after the plate buckles the axial loads applied to the transverse stiffeners steadily increase as the webplate develops a membrane tension field.
2V
Panel 2V
V
Intermediate stiffener in compression Panel 1Figure 1.8 – Simply supported plate girder with effective stiffener
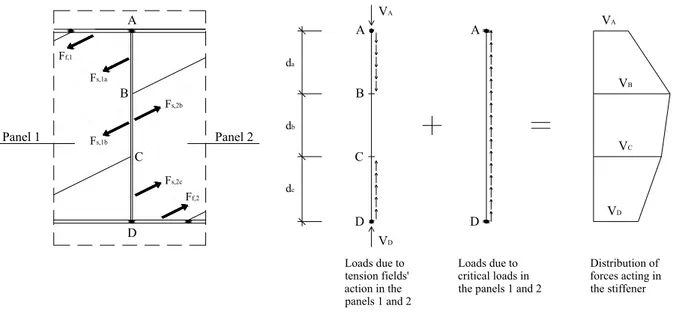
The tension field acting in the adjacent web panels applies loading to the flanges and to the transverse stiffeners. As a results the transverse stiffener is subjected to a variable axial loading, as shown in Figure 1.9. This loading acts on the effective cross section area of the stiffener. Research carried out by Mele [6] has shown that a part of the web plate acts with the stiffener even though it is theoretically fully yielded by the tension field action.
Panel 2 Panel 1 Fs,1a Ff,1 Fs,1b Fs,2b Fs,2c Ff,2 A D B C VA VB VC VD da db dc A B C D A D VA VD Loads due to tension fields' action in the panels 1 and 2 Loads due to critical loads in the panels 1 and 2
Distribution of forces acting in the stiffener
Figure 1.9 – Forces applied by membrane and buckling stress fields to intermediate stiffener AB
1.2 Stockholm rotating stress field theory
The rotating stress field theory developed by Höglund is the basis of the post-critical design procedure for predicting the ultimate shear resistance of plate girders in Eurocode 3.
The ultimate shear resistance Vu can be expressed as
f , u w , u u
V
V
V
=
+
where:− Vu,w is the load carrying resistance of the web due to its membrane behaviour;
− Vu,f is the load carrying resistance of the flanges due to their bending stiffness;
In determining Vu,w the web panels are represented, in the post-buckling stage, with a
Figure 1.10 – Shear force carried by the web
When the load increases, the compression bars stress is constant and equal to the buckling stress
σ
c =τ
cr while the tension bars stressσ
t increases when the angleθ
decreases. The value Vu,w is obtained when plasticity is reached at the intersection
between bars, according to Von Mises criteria.
If the stiffeners at the girder ends are rigid, Vu,w is expressed as:
y w , u
h
d
V
=
τ
when α≤0.8 y w , uh
d
1
8
.
1
V
τ
α
+
=
when 0.8≤ α≤2.75 y w , uh
d
32
.
1
V
τ
α
=
when α>2.75 where: cr y τ τ α=and
τ
cr is the buckling shear stress for a simply supported rectangular plate as discussedin section 1.1.
In absence of intermediate stiffeners it would not be possible to imagine a “frame type” mechanism and Vu,f would be equal to zero. When web panels are provided with
transverse stiffeners, this implies that the web is prevented from deflecting and the flanges are prevented from coming nearer to each other at the stiffeners. If the flanges are
non-rigid then the edges of the web are prevented from approaching each other only locally, at the stiffeners. If the flanges are rigid in bending in the plane of the web, then they also prevent the edges of the web from approaching each other over a length “c” of the web panel. This gives rise to an increase in the shear resistance.
At failure, four hinges form at the top and bottom flange, with a tension stress field developed in the web, between flanges only, as shown in Figure 1.11. The moment at each hinge is assumed to be equal to the plastic moment of the flanges.
V
u,fV
u,fV
u,fV
u,fc
Figure 1.11 – Shear force carried by truss action
The shear force Vu,f which is transmitted by the tension stress field is obtained from the
equilibrium of the flange portion “c”. This equation gives:
c
M
4
V
fp f, u=
where c is the distance at which plastic hinges form in the flanges and is given by:
⎟
⎟
⎠
⎞
⎜
⎜
⎝
⎛
+
=
yw 2 yf 2 f fd
t
t
b
25
.
0
b
c
σ
σ
The stiffener force is equal to Vu,f.
Interaction between shear and coexisting bending moment is represented by diagram in Figure 1.12.
Vu,w Vu D MP My My Mf My M V Vu C B 0.5 0.5 1.0 A 1.0
Figure 1.12 – Interaction diagram
When the girder is subjected to a shear force with a small coexisting bending moment, it is assumed that the effect from the latter does not influence the load carrying capacity of the web Vu,w but only the load carrying capacity of the flanges Vu,f.
f 2 f f , u w , u u
M
for
M
M
M
1
V
V
V
≤
⎥
⎥
⎦
⎤
⎢
⎢
⎣
⎡
⎟⎟
⎠
⎞
⎜⎜
⎝
⎛
−
+
=
If M = Mf then the flanges are assumed to be completely plastified by the normal force
from bending moment. When M > Mf then the flanges cannot contribute to the shear
carrying capacity of the girder and the capacity of the web to carry shear forces is reduced.
Chapter 2
Calibration of FE modelling
As an initial exercise, tests TGV7-2 and TVG8-2 from [11] are modelled with non-linear finite element analysis to establish if similar results are obtained. This is intended to gain confidence in the non-linear FE results for subsequent analyses. Both tests have been chosen for validation of the finite element modelling because the load deflection plots of the tested girders under increasing load are included in the paper. These can be directly compared to the load deflection plots generated from the finite element analysis. In addition, test TVG8-2 recorded a failure of the transverse stiffener (which is a rare experimental situation) whereas the stiffener in TGV7-2 remained intact. This work is discussed in the following paragraphs.
2.1 Results of initial FE calibration analysis on test TGV8-2 2.1.1 FE model set-up
As an initial calibration of the finite element analysis, Rockey test TGV8-2 from [11] has been modelled and the results compared to the findings of the original laboratory test. Test TGV8-2 has been chosen for validation because the measured load deflection relationship was published in the original paper and also because it produced a web stiffener ‘failure’ - or at least very large out of plane deflections.
All dimensions, loadings and material properties used in the FE model have been taken from the original paper. Post yield strain hardening has been included via the slope of E/100 in the stress/strain curve as discussed in Chapter 3. An applied load of 180kN has been applied at the midspan point of the girder in the same manner as the original test. As illustrated in Figure 2.1, the intermediate stiffener dimensions were not equal on both sides of original test girder TGV8. Stiffener SA possessed outstand dimensions of 20.50 x 3.22mm and stiffener SB 15.95 x 5.71mm. Both intermediate stiffeners were single sided. Test TGV8-1 applied a point load to the central stiffener and the girder is recorded to have failed through buckling of stiffener SA when the point load reached 180kN. At this point, the damaged panel was ‘strengthened’ (it is not explained how) and the girder reloaded in
test TGV8-2. Test TGV8-2 was stopped after stiffener SB had buckled at a recorded failure load of 188kN. As test TGV8-2 is the test to be validated in a finite element model, both intermediate stiffeners have been modelled with dimensions equal to stiffener SB.
Figure 2.1 – Original Test Girder TGV8
The only necessary data absent from the original paper is the magnitude of geometric imperfection present in the web plate and stiffener prior to loading. Two different initial imperfections have therefore been modelled to investigate the sensitivity of imperfection on the final buckling mode and buckling load.
The first initial imperfection, illustrated in Figure 2.2 is designed to maximise the load on the intermediate stiffener. The 2mm maximum allowable stiffener deflection to BS 5400 Part 6 has been doubled to approximately 4mm to allow for structural imperfections.
The second initial imperfection, illustrated in Figure 2.3 below is designed to maximise the loads on the web panels. Each web panel has been bowed out alternately, with the maximum bow dimension calculated at 3mm from EN 1993-1-5 Annex C.
Figure 2.3 – Lateral Displacement Contours (mm) applied as ‘Initial Deflection 2’ for FE model of Rockey Test TGV8
2.1.2 Results of FE modelling with ‘Initial Deflection 1’
The finite element analysis of test TGV8-2 with ‘initial deflection 1’ stops when the analysis fails to find an equilibrium beyond a load factor of 1.02. The lateral deflections of the web at this point are illustrated in Figure 2.4 below. In Figure 2.4 it can be seen that the girder has failed by the web plate and intermediate stiffener bowing out laterally.
Figure 2.4 – Displacement Contours (mm) showing lateral displacement of webs under an applied load of 180kN x Load Factor of 1.02 = 183.6kN (Contour values do not include original imperfections illustrated in Figure 2.2)
The load-deflection curve obtained from the finite element analysis is illustrated in Figure 2.5. The analysis shows a gradual loss of girder stiffness beyond a load factor of approximately 0.7 culminating in failure at a load factor of 1.02
Figure 2.5 – Load-Deflection Curve obtained from FE Analysis of Test TGV8-2 using ‘Initial Imperfection 1’ in Figure 2.2
2.1.3 Results of FE modelling with ‘Initial Deflection 2’
The finite element analysis of test TGV8-2 with ‘initial deflection 2’ stops when the analysis fails to find an equilibrium beyond a load factor of 1.003. The lateral deflections of the web are at this point are illustrated in Figure 2.6. In Figure 2.6 it can be seen that the girder has again failed by the web plate and intermediate stiffener bowing out laterally, despite a different initial imperfection.
Figure 2.6 – Displacement Contours (mm) showing lateral displacement of webs under an applied load of 180kN x Load Factor of 1.003 = 180.1kN (Contour values do not include original imperfections illustrated in Figure 2.3)
The load-deflection curve obtained from the finite element analysis is illustrated in Figure 2.7. As for ‘initial imperfection 1’ the analysis shows a gradual loss of girder stiffness beyond a load factor of approximately 0.7 culminating in failure at a load factor of 1.02. In this model, the analysis has been able to establish more equilibriums beyond the failure load. The peak in load and subsequent drop-off is compatible with the lab test results illustrated in Figure 2.9.
Figure 2.7 – Load-Deflection Curve obtained from FE Analysis of Test TGV8-2 using ‘Initial Imperfection 2’ in Figure 2.3
2.1.4 Comparison of TGV8-2 FE modelling output with laboratory test results
The photographed failure mode of test TGV8-2 is illustrated in Figure 2.8. The failure modes predicted by the FE generated results in Figures 2.4 and 2.6 compare well with the actual failure mode recorded in testing. Both predicted failure modes involve the lateral bowing out of an intermediate stiffener.
The recorded load-deflection curve for the laboratory test of TGV8 is illustrated in Figure 2.9.
Figure 2.9 – Load-Deflection Plot recorded in laboratory testing of Test TGV8-2 (Extract from [11])
To compare the FE results to the tested results, all load deflection curves have been plotted on Figure 2.10. The results from the laboratory testing have been scaled from Figure 2.9. It is assumed that the units of the Figure 2.9 vertical axis are ‘imperial tons.’
Test TGV8 0 5 10 15 20 25 0 0.5 1 1.5 2 2.5 3 3.5 4 4.5 5
Vertical M idspan Deflection (mm)
A p pl ie d Loa d ( tons ) FE Results (Imperfection 1) FE Results (Imperfection 2) Lab Test Results
2.1.5 Discussion of results
Figure 2.10 shows that there is a good correlation between the load-deflection relationships calculated by the FE models and that recorded in the test output for TGV8-2. This gives confidence in the accuracy of the output of subsequent FE models. The failure modes illustrated on Figures 2.4 and 2.6 are also similar to the recorded failure mode in Figure 2.8. The fact that a similar failure mode has occurred for ‘Initial Deflection 2’ also helps to prove that the failure mode developed with ‘Initial Deflection 1’ has not been ‘forced’ by the geometry of the initial imperfection.
A check of the TGV8-2 stiffener capacity to EN 1993-1-5 has found that the stiffener has inadequate stiffness when checked against the minimum stiffness requirements of Clause 9.3.3 – although it is only inadequate by 4%. However, when the capacity of the girder is checked against the Eurocode assuming a rigid intermediate stiffener the web shear capacity is critical with a predicted failure shear force of 79.7kN (assumes
γ
M0=1.0,γ
M1=1.0). This shear force would be generated by a central point load of 159.4kN ≅ 16.0tons. From Figure 2.10, this predicted shear capacity was safely achieved in Girder TGV8 despite the code failure of the intermediate stiffeners.
The check of the transverse stiffener to EN 1993-1-5 Clause 9.3.3 (3) predicts a usage factor of 6.48 where ‘Usage factor’ = Load / Load Capacity. This failure is largely a consequence of the axial force, applied in the plane of the web plate, predicted by the equation in EN 1993-1-5 Clause 9.3.3 (3) repeated below :
1 M w yw 2 Ed
3
h
f
1
V
Force
Stiffener
γ
λ
−
=
If this girder was to be designed to the Eurocode a heavier stiffener section would be required to comply with the above equation and the stiffness requirement would be satisfied. However, the results from the testing and FE modelling would show that the combined web-stiffener system used in test TGV8 is adequate for resisting the theoretical shear capacity of 79.7kN – although it is noted from Figure 2.10 that the response is non-linear above a shear force of 69kN (equivalent to a central point load of 138kN ≅ 13.8 tons.)
2.2 Results of initial FE calibration analysis on test TGV7-2
2.2.1 FE model set-up
As discussed previously, Test TGV7-2 has also been modelled with finite element analysis to compare the measured test results with the finite element output. Similarly to girder TGV8, Girder TGV7 possessed two intermediate stiffeners with different dimensions. Stiffener SA consisted of a stiffener outstand 12.40 x 5.75mm and stiffener SB 25.21 x 5.10mm. The test records show that the first test TGV7-1 was stopped at 180kN after stiffener SA had buckled. After strengthening the failed panel and stiffener, the second test TGV7-2 was carried out. This was stopped at 210kN after the web panels adjacent to stiffener SB had failed – even though stiffener SB still remained intact. As the finite element analysis is to repeat test TGV7-2, both intermediate stiffeners have been modelled as having dimensions equal to stiffener SB.
As for the FE modelling on Test TGV8-2, all dimensions and material properties have been taken from the TGV7 girder data in the original paper. Two initial imperfections have been used as starting points. These are identical to the initial imperfections illustrated on Figures 2.2 and 2.3.
2.2.2 Results of FE modelling with ‘Initial Deflection 1’
The finite element analysis of test TGV7-2 with ‘initial deflection 1’ stops when the analysis fails to find an equilibrium beyond a load factor of 1.09. The lateral deflections of the web are illustrated on Figure 2.11. The failure mode is different to the equivalent TGV8 test in Figure 2.4 in that the intermediate stiffeners have remained intact.
Figure 2.11 – Displacement Contours (mm) showing lateral displacement of webs under an applied load of 180kN x Load Factor of 1.09 = 196.2kN (Contour values do not include original imperfections illustrated in Figure 2.2)
The load-deflection curve obtained from the finite element analysis is illustrated in Figure 2.12.
Figure 2.12 – Load-Deflection Curve obtained from FE Analysis of Test TGV7-2 using ‘Initial Imperfection 1’ in Figure 2.2
2.2.3 Results of FE modelling with ‘Initial Deflection 2’
The finite element analysis of test TGV7-2 with ‘initial deflection 2’ stops when the analysis fails to find an equilibrium beyond a load factor of 1.086. The lateral deflections of the web are illustrated on Figure 2.13. Again, the failure mode is different to the equivalent TGV8 test in Figure 2.6 in that the intermediate stiffeners have remained intact.
Figure 2.13 – Displacement Contours (mm) showing lateral displacement of webs under an applied load of 180kN x Load Factor of 1.086 = 195.5kN (Contour values do not include original imperfections illustrated in Figure 2.3)
Figure 2.14 – Load-Deflection Curve obtained from FE Analysis of Test TGV7-2 using ‘Initial Imperfection 2’ in Figure 2.3
2.2.4 Comparison of TGV7-2 FE modelling output with laboratory test results
The photographed failure mode of Test TGV7-2 is illustrated in Figure 2.15. The failure modes predicted by the FE generated results in Figures 2.11 and 2.13 compare well with the actual failure mode recorded during testing. Both predicted failure modes involve buckling of the web plate with the stiffener remaining intact.
Figure 2.15 – Photograph of failure mode Test TGV7-2 (Extract from [11])
The recorded load-deflection curve for the laboratory test of TGV7-2 is illustrated in Figure 2.16.
Figure 2.16 – Load-Deflection Plot recorded in laboratory testing of Test TGV7-2 (Extract from [11])
To compare the FE results to the tested results, all load deflection curves have been plotted on Figure 2.17 using the same assumptions explained previously in the TGV8-2 tests in section 2.1.4.
Test TGV7
0 5 10 15 20 25 0 1 2 3 4 5 6Vertical M idspan Deflection (mm)
A pp li e d Loa d ( tons ) FE Results (Imperfection 1) FE Results (Imperfection 2) Lab Test Results
2.2.5 Discussion of results
The graphs in Figure 2.17 do not correlate as closely as those for Test TGV8-2 in Figure 2.10. The principal difference between the two results is that both finite element analyses predict a non-linear response above an applied load of 10 tons whereas the lab test results in Figure 2.17 recorded a linear response until the approximate point of failure at 20 tons. The reasons for the differences are not completely clear, although a larger degree of strain hardening in the finite element models would result in a stiffer response beyond 10 tons which would bring the FE predictions closer to the measured results. With regard to the theoretical failure load predicted by the Eurocode, as for test TGV8, shear capacity is critical with a predicted shear capacity of 88.8kN (assumes
γ
M0=1.0,γ
M1=1.0). This shear force would be generated by a central point load of 177.6kN ≅ 17.8tons.
A check of the TGV7-2 stiffener capacity to EN 1993-1-5 has found that the stiffener has adequate stiffness (with 2.6 times the required inertia) when checked against the minimum stiffness requirements of Clause 9.3.3. However, the strength of the stiffener is not sufficient, with a calculated usage factor of 3.36. As for test TGV8-2, this high usage factor is largely a consequence of the axial force applied at the centre of the web plate predicted by the equation in EN 1993-1-5 Clause 9.3.3(3). A stockier stiffener section would therefore be required if this girder was to be designed to the Eurocode. However, the results would prove that the Eurocode is conservative in the case of Test TGV7-2 as the intermediate stiffener used still remained intact after failure of the web plate in shear.
2.3 Conclusions from FE calibration exercises
• The FE modelling of lab test TGV8-2 in Figure 2.10 shows a close correlation between predicted results and measured results. This gives confidence in the accuracy of the FE modelling process in this instance.
• Even though the TGV8-2 intermediate stiffener did not possess adequate stiffness, as required by the Eurocode EN 1993-1-5 Clause 9.3.3(3), the combined stiffener-web system was still able to withstand the theoretical panel failure load – as predicted by EN 1993-1-5.
• The ‘final failure’ mode of test TGV8-2, predicted by the FE modelling, resulted in combined buckling of the web and stiffener (Figures 2.4 and 2.6). This is a similar failure mode to that observed in the tests (Figure 2.8).
• The FE modelling of lab test TGV7-2 in Figure 2.17 does not show as close a correlation between predicted results and measured results when compared to the TGV8-2 results. The FE predicted results show a non-linear response beyond a 10 ton central point load where as the measured results show an approximately linear response up to the point of failure. Although it would be possible to investigate the sensitivity of the results under less pessimistic levels of strain hardening, it can still be concluded that the FE modelling predictions are safe when compared to the measured lab test results in this instance.
• The TGV7-2 FE models predict that the TGV7-2 intermediate stiffeners remain intact after shear failure of the web (Figures 2.11 and 2.13). This was also observed during the lab tests (Figure 2.15). The Eurocode EN 1993-1-5 predicts that although the intermediate stiffener dimensions in TGV7-2 are adequate with regard to stiffness, they are clearly not adequate with regard to strength and a stockier stiffener section would be required.
Chapter 3
FE Modelling
3.1 Layout
The basic layout of girder to be modelled is illustrated in Figure 3.1. This comprises an inverted simply supported beam of length 12 x 2.5m (panel depth “d”) = 30m. By using this beam layout the web panel aspect ratios “a/d” can be set at 1 or 2 easily. Global lateral torsional buckling is restrained in the models by providing adequate lateral restraint to the compression flanges.
Figure 3.1 – Girder Layout used in FE modelling Two different models have been considered in this study:
• Symmetrical steel girder: a steel plate girder with double sided stiffeners, considered to examine symmetric cases and the influence of axial force (see Section 4.1);
• Steel-concrete composite girder: a steel plate girder with a concrete slab on top with single sided stiffeners, considered to examine a real beam case (see Section 4.2). The bending moment also induces a net axial force in the web.
3.2 Stiffeners
The panels are separated by double sided, full height vertical web stiffeners for the steel girder analyses and by single sided, full height vertical stiffeners for the composite beam analyses.
Even though modern designs make greater use of single sided web stiffeners at panel boundaries, double sided stiffeners have been used to reduce the uncertainty in determining stiffener axial forces from finite element stresses, by reducing bending stresses associated with the asymmetry.
Three stiffeners are centred on the end supports to ensure any tension field developed in the end panels is anchored by these stiffeners. The central stiffener has a large area and stiffness to avoid analysis convergence problems caused by local yielding under the point load.
Using the relevant panel failure loads, a minimum allowable stiffener size is calculated using EN 1993-1-5. The EN approach requires that the stiffener conforms to a shape limit to avoid torsional buckling (clause 9.2.1 (8)), has sufficient stiffness to act as a rigid support to web panels (clause 9.3.3) and a sufficient strength under axial force and moment (clause 9.3.3). The minimum stiffener sizes allowed by EN 1993-1-5 based on stiffness have been used in most of the analyses. Several cases have also been run where stiffener sizes were controlled by strength to EN 1993-1-5 (in general the most conservative).
BS 5400 Part 3 requires three checks on the strength of the stiffener under axial force and moment. This includes checking the yielding of web plate (clause 9.13.5.1), the yielding of stiffener (clause 9.13.5.2) and the buckling of stiffener (clause 9.13.5.3). In addition, torsional buckling is taken into account by the specification of minimum outstand shape limits in clause 9.3.4.1.2. Stiffener dimensions calculated according to EN 1993-1-5 have been checked using BS 5400 Part 3 to compare the usage factors of the two codes.
3.3 Imperfections
Three different initial imperfections have been modelled to investigate the sensitivity to imperfection on the final buckling mode and factor.
The first initial imperfection, illustrated in Figure 3.2, is designed to maximise the effect on the web panels. Each web panel has been bowed out laterally, with the maximum bow dimension calculated, according to EN 1993-1-5 Annex C.5, as the minimum of (a/200, d/200), where “a” is panel length and “d” in the panel depth. For a panel aspect ratio of a/d=1 the maximum bow is 2500/200=12.5mm.
The second initial imperfection, illustrated in Figure 3.3, is designed to maximise the effect on the intermediate stiffener. The maximum stiffener deflection is about 2500/200=12.5mm.
Figure 3.3 – Stiffeners Imperfections – Lateral Displacement Contour (m)
The third initial imperfection considered is based on the relevant elastic critical buckling modes.
3.4 Material properties
The steel yield strength of the plate girder components has been taken to be 355 N/mm2.
comparison with code predictions using
γ
M =1.0. The models have been analysed with fullmaterial non-linearity taken into account. After yield, the steel stress-strain slope has been set at E/100, in accordance with the recommendations in EN1993-1-5 Annex C.6, to model the effect of some strain hardening. Fracture has been assumed to take place at a strain of 5%. y 0.05 tan E-1 -1 tan E 100
Figure 3.4 – Material behaviour assumed (EN1993-1-5 Annex C.6)
3.5 Meshing
The webs, flanges and stiffeners finite element meshes are formed from quadrilateral ‘thick’ shell elements. Composite slabs are represented by a non-linear beam element of equivalent area, stiffness and eccentricity, rigidly connected to the tension flange of the girder.
3.6 Loading
Vertical knife edge loadings are applied as distributed per unit length at the mid-span and at the ends of the beam, producing different ratios of bending moment to shear force, while uniform compressive stresses are applied to the beam ends. This simulates the moment and shear loading developed in a girder over a continuous bridge support and the compressive stresses have the same effect as varying the section to be non-symmetric or composite.
3.7 Non-linear analysis control
The models have been analysed with geometric and material non-linearities taken into account. Geometric non-linearities arise from significant changes in the structural configuration during loading when web plates develop membrane behaviour. Material non-linearities arise from a nonlinear constitutive model, when plastic yielding of metal is produced. For non-linear analysis, since it is no longer possible to directly obtain a stress distribution which equilibrates a given set of external loads, a solution procedure is usually adopted in which the total required load is applied in a number of increments. Within each increment a linear prediction of the nonlinear response is made, and subsequent iterative corrections are performed in order to restore equilibrium by the elimination of the residual or ‘out of balance’ forces. The iterative corrections are referred to some form of convergence criteria which indicates to what extent an equilibrate state has been achieved. Such a solution procedure is therefore commonly referred to as an incremental-iterative (or predictor-corrector) method shown in the Figure 3.5.
KT Equilibrium Iteration Load Increment Load Displacement Converged Equilibrium
Figure 3.5 – Predictor-Corrector solution procedure
Within the software package used for the analyses, the non-linear solution is based on the Newton-Raphson procedure. In this procedure an initial prediction of the incremental solution is based on the tangent stiffness from which incremental displacements, and their iterative corrections may be derived. It is assumed that a displacement solution may be found for a given load increment and that, within each load increment, the load level
remains constant. Such methods are therefore often referred to as constant load level incrementation procedures. To investigate if limit points in the structural response are encountered, a constrained solution methods has been used. Constrained methods differ from constant level methods in that the load level is not required to be constant within an increment. In fact the load and displacement levels are constrained to follow some pre-defined path. Within the software package used, Crisfield’s modified arc-length procedure is used, in which the solution is constrained to lie on a spherical surface defined in displacement space. The use of the arc-length method has advantages over constant load level methods in improving the convergence characteristics and the ability to detect and negotiate limit points.
Figure 3.6 shows a shot of the non-linear control dialog used within the software package used.
Chapter 4
Non-linear FE study
4.1 Symmetrical steel girder
A symmetric steel plate girder with double sided stiffeners is modelled. The layout shown in Figure 4.1 produces a high ratio of bending to shear force. Section dimensions are selected in such a way that the web panel adjacent to the middle support reaches its predicted failure load by buckling with tension field action in shear, coincidentally with overall bending yield of the section under the maximum moment at midspan. This leads to thick flanges which in turn gives rise to large boundary restraint. In order to maximise the difference VEd – Vcrit the web thickness is chosen to be such that the predicted shear
strength by clause 9.9.2.2 in BS 5400 Part 3 is about twice the elastic critical buckling strength. The flange outstand/thickness ratio does not exceed 10 to avoid local buckling of the compression flange.
The iterative procedure to obtain the section dimensions is to assume the ultimate shear strength
τ
ult as twice the shear critical stress and calculate the flange thickness required toavoid yield. With this thickness then it is possible to calculate the ultimate shear strength
τ
ult by clause 9.9.2.2 in BS 5400 Part 3. If this does not equal that assumed, adjustment isdone to the web thickness until it does.
Making the moment of resistance ignoring the web equal to Mmax and making the flange
width Bf equal to 20 times the flange thickness Tf we obtain:
In the following paragraphs, cases 2-1 and 11 are discussed in more detail.
The dimensions of the girders are given in Table 1 with a summary of the results from the non-linear analyses. For each case stiffeners are checked according to EN 1993-1-5 and BS 5400 Part 3.
Adjustment of the bending/shear ratios is obtained applying end moments equals to half those due to the point loads at mid-span.
With this thickness, the ultimate shear strength
τ
ult is calculated from clause 9.9.2.2 inBS5400 Part 3. If this does not equal that assumed, the web thickness is adjusted until it does.
• Calculate
τ
crit• t = “assumed” • a = d = 2500 mm
The iterative procedure consists of the following steps:
• Vult =
τ
ult x t x d =2
F
→ F = 2 x Vult
• Assume
τ
ult = 2 xτ
crit• max
3
d
F
6
d
V
ult4
d
12
F
M
=
=
y ult f20
t
d
6
T
σ
τ
×
×
×
×
=
×
×
=
Girder Load applied stiffener design EN1993-1-5 stiffener design BS 5400 Part 3 Non-linear analysis
case a/d d/t t Tf Bf ( = 20xTf ) hst x tst τcrit [N/mm2
] M [KNm] V [KN] End Moments [KNm] σ1 [N/mm2
] stiffness ratio shape limit (<10.5) strength (U.F.) web yield (U.F.) stiffener yield (U.F.) buckling (U.F.) imperfections Load factor Usage Factor
web flange flange stiffener simply supported boundaries
clause 9.3.3 (3) clause 9.1 (2) clause 9.4 clause 9.13.5.1 clause 9.13.5.2 clause 9.13.5.3 MNL/M M/MNL
1-1 1 131.58 19 90 1800 130x40 101.70 148500 9900 0 0 0.35 3.25 0.97 0.84 0.75 1.18 web 0.91 1.10 1-2 1 131.58 19 90 1800 130x14 101.70 148500 9900 0 0 1.00 9.29 1.77 1.04 1.09 2.28 web 0.89 1.12 2-1 1 178.57 14 78 1560 100x12.5 54.87 108000 7200 0 0 1.00 8.00 3.62 1.58 1.79 4.09 web 0.85 1.18 2-2 1 178.57 14 78 1560 90x9 54.87 108000 7200 0 0 1.85 10.00 5.34 1.77 1.99 6.31 web 0.85 1.18 3 2 131.58 19 74 1480 130x14 68.60 148500 9900 0 0 0.50 9.29 1.34 1.14 1.09 2.37 web 0.72 1.39 4 1 131.58 19 64 1280 130x14 101.70 74250 9900 -74250 0 1.00 9.29 1.77 1.04 1.09 2.27 web 0.87 1.15 5-1 1 131.58 19 90 1800 130x40 101.70 148500 9900 0 0 0.35 3.25 0.97 0.84 0.75 1.18 stiffener 0.89 1.12 5-2 1 131.58 19 90 1800 130x14 101.70 148500 9900 0 0 1.00 9.29 1.77 1.04 1.09 2.28 stiffener 0.87 1.15 9 1 131.58 19 68 1360 130x14 52.88 148500 9900 0 25 1.00 9.29 1.77 1.39 1.44 2.94 stiffener 0.60 1.67 10 1 131.58 19 66 1320 130x14 0.00 148500 9900 0 50 1.00 9.29 1.77 1.67 1.84 3.53 stiffener 0.52 1.92 11 1 131.58 19 66 1320 130x14 0.00 148500 9900 0 75 1.00 9.29 1.77 1.69 1.84 3.63 stiffener 0.47 2.13
Load applied x Load Factor stiffener design EN1993-1-5
case M [KNm] V [KN] End Moments [KNm] σ1 [N/mm2
] stiffness ratio shape limit (<10.5) strength (U.F.)
clause 9.3.3 (3) clause 9.1 (2) clause 9.4 1-1 135135 9009 0 0 0.32 2.96 0.88 1-2 132165 8811 0 0 0.89 8.27 1.58 2-1 91800 6120 0 0 0.85 6.80 3.08 2-2 91800 6120 0 0 1.57 8.50 4.54 3 106920 7128 0 0 0.36 6.69 0.96 4 64598 8613 -64598 0 0.87 8.07 1.54 5-1 132165 8811 0 0 0.31 2.89 0.86 5-2 129195 8613 0 0 0.87 8.08 1.54 9 89100 5940 0 25 0.60 5.57 1.06 10 77220 5148 0 50 0.52 4.83 0.92 11 69795 4653 0 75 0.47 4.37 0.83
4.1.1 Case 2-1
The finite element analysis has been run with initial web imperfections as shown in Figure 3.2. The stiffener dimensions are the minimum allowed by the stiffness criteria in EN 1993-1-5.
Figure 4.2 – Section dimensions
The panels aspect ratio in this case is a/d = 1, and the critical stress and shear are:
τ
cr = 55 N/mm2(see Appendix A)
Vcr =
τ
cr x t x d = 1925 KNOwing to the size of the flanges provided in the model, the web panels are restrained against out-of-plane rotation and their critical stresses are higher than assumed in codified rules. The critical stresses, when calculated from [4] for a plate with built-in edges, become:
τ
cr = 86 N/mm2(see Appendix A)
Vcr =
τ
cr x t x d = 3010 KNA force F = 14400 KN ≈ 2 x Vult at midspan, if applied in a linear analysis, would produce
the following effects:
Mmax = F x L / 4 = 14400 x 30 / 4 = 108000 KNm
The non-linear analysis stops when it fails to find an equilibrium beyond a load factor 0.85. MNL = 0.85 x 108000 = 91800 KNm
→
η
1= 0.771VNL = 0.85 x 7200 = 6120 KN
→
η
3= 1.632The load-deflection curve obtained from the finite element analysis is illustrated in Figure 4.3. The analysis shows an almost linear behaviour up to a load factor of approximately 0.7, after which it shows a gradual loss of stiffness culminating in a failure at the load factor of 0.85.
Fig. 4.3 – Vertical Displacement vs Total Load Factor
The lateral deflections of the web at different stages are illustrated in Figures 4.6 to 4.13, where it can be seen that the girder has failed by the web bowing out laterally, while stiffeners twist in sympathy.
The M-V interaction domain from EN 1993-1-5 and the results obtained from the non-linear analysis are illustrated in Figure 4.4. The girder shows an extra capacity of about +20% when compared with Eurocode and the solution point is outside the interaction curve. The interaction curve has been built according to EN 1993-1-5 clause 7.1(1). This domain has been built considering a
τ
crit value derived for a simply supported plate loadedFigure 4.4 – Eurocode M-V interaction domain and result from non-linear analysis (simply supported plates in shear)
Figure 4.5 – Eurocode M-V interaction domain and result from non-linear analysis (built-in plates in shear)
If more realistically we use the theoretical solutions of a plate with longitudinal edges clamped with transverse stiffeners, the latter having low torsional stiffness, as discussed in [4], the M-V interaction domain becomes bigger with a shift upward due to the increase in value of Vbw,Rd and the extra capacity from the non-linear analysis is now reduced to
about +10% (Figure 4.5).
The sections through the girder at various stages in the analysis to establish the distribution of internal forces are illustrated in Figures 4.14 to 4.26.
From Figures 4.15, 4.18 and 4.21 it can be seen that for load increments 1 to 3 the longitudinal stresses in the web vary more or less linearly as expected. Tension field effects appear beyond increment 3 at which the mean shear stress is about 72 N/mm2,
compared with a critical stress of 86 N/mm2 (for fully clamped edges) and 55 N/mm2 (for
simply supported edges), and therefore consistent with theory. Beyond this increment, a membrane tension develops, which modifies the distribution of direct stress in the girder. This gives rise to a net tension in the web, which is balanced by opposing compressive force in the flanges, adding to the flexural compressive stress in one flange and reducing the flexural stress in the other. This behaviour gives an increase in compressive flange force beyond that predicted solely from a cross section bending analysis (see Figures 4.16 and 4.19). There is evidence, from Figures 4.18 and 4.21, that towards the failure load the tension field stresses carry through the first intermediate stiffener, which indicates there to be little transfer of such stresses to the stiffener.
The stiffener forces given in Figure 4.26, at mid-height of the stiffener, are plotted against the load factor. They show a very marked escalation beyond increment 12. It is noted that, at this increment, the shear stress at the bottom of section S3 (Figure 4.20) equals the shear yield stress, whereas at the section S2 (Figure 4.22) the shear stress begins to reduce at the bottom but increase to the yield stress at the top, both of which are compatible with an increase in the force transmitted to the stiffener.
The vertical stresses at mid-height of the stiffeners are plotted against the load factor in Figure 4.25. The maximum vertical force acting on the effective area of the stiffener gives a compressive stress of approximately 100 N/mm2 while the maximum vertical force acting on the stiffener alone gives a compressive stress of approximately 160 N/mm2. It is
clear that the forces and stresses are dependent on the choice of the effective section for the stiffener. The stresses calculated above ignore significant bending stresses induced in the stiffener due to second order P-Δ moments from initial imperfection. Considering a
pin-ended strut with an initial sinusoidal bow imperfection of maximum displacement 12.5mm (see Section 3.3), the maximum stress in the stiffener outstand is about 225N/mm2.
The stiffener force, calculated as the difference between the observed ultimate shear force (6120 KN) and the elastic critical shear force with edge fixity (3010 KN), amounts to 3110 KN compared with a value derived from the observed stresses of about 1040 KN for the effective area at mid-height of the stiffener.
See also Figures 4.8 to 4.13
P O O N N M M L L L K K K K J J J J J J J I I I I I I I I I I H H H H H H H H H H H H H H G G G G G G G G G F F F F F F F F E E E D D D C C B B A A LOAD CASE = 1
Increment 1 Load Factor = 0.249631 RESULTS FILE = 1 DISPLACEMENT CONTOURS OF DX 3.6368E-3 3.1822E-3 2.7276E-3 2.273E-3 1.8184E-3 1.3638E-3 0.9092E-3 0.4546E-3 0 -0.4546E-3 -0.9092E-3 -1.3638E-3 -1.8184E-3 -2.273E-3 -2.7276E-3 -3.1822E-3 P O N M L K J I H G F E D C B A
Max 0.3637E-02 at Node 5531 Min -0. 3637E-02 at Node 8501
P O ON N M M L L L K K K J J J J J J I I I I I I I H H H H H H H H H H H G G G G G G G F F F F F F F E E E E D D D D C C B B A A
Min -0.3637E -02 at Node 8501 Max 0.3637E-02 at Node 5531
A B C D E F G H I J K L M N O P -3.1822E-3 -2.7276E-3 -2.273E-3 -1.8184E-3 -1.3638E-3 -0.9092E-3 -0.4546E-3 0 0.4546E -3 0.9092E -3 1.3638E -3 1.8184E -3 2.273E -3 2.7276E -3 3.1822E -3 3.6368E -3 CONTOURS OF DX DISPLACEMENT RESULTS FILE = 1
Increment 1 Load Factor = 0.249631 LOAD CASE = 1
P O O N N M M L L L K K K K K J J J J J J I I I I I I I I H H H H H H H H H H G G G G G G F F F F E E E E D D D C C C B BA A LOAD CASE = 9
Increment 9 Load Factor = 0.648017 RESULTS FILE = 1 DISPLACEMENT CONTOURS OF DX 0.0186443 0.0163138 0.0139832 0.0116527 9.32216E-3 6.99162E-3 4.66108E-3 2.33054E-3 0 -2.33054E-3 -4.66108E-3 -6.99162E-3 -9.32216E-3 -0.0116527 -0.0139832 -0.0163138 P O N M L K J I H G F E D C B A
Max 0.1864E-01 at Node 5531 Min -0. 1864E-01 at Node 8501
P O O N N M M L L K K K K J J J J J I I I I I I I I H H H H H H H H H H H G G G G G G G F F F F F E E E E E D D D D C C C C B B A A LOAD CASE = 9
Increment 9 Load Factor = 0.648017 RESULTS FILE = 1 DISPLACEMENT CONTOURS OF DX 0.0186443 0.0163138 0.0139832 0.0116527 9.32216E -3 6.99162E -3 4.66108E -3 2.33054E -3 0 -2.33054E-3 -4.66108E-3 -6.99162E-3 -9.32216E-3 -0.0116527 -0.0139832 -0.0163138 P O N M L K J I H G F E D C B A
Max 0.1864E-01 at Node 5531 Min -0.1864E -01 at Node 8501
P O N N M M M L L L K K K J J J J J I I I I I I I H H H H H H H H H H G G G G G G G G F F F F F E E E E D D C C B A LOAD CASE = 15
Increment 15 Load Factor = 0.848562 RESULTS FILE = 1 DISPLACEMENT CONTOURS OF DX 0.0572183 0.050066 0.0429137 0.0357614 0.0286091 0.0214569 0.0143046 7.15229E-3 0 -7.15229E-3 -0.0143046 -0.0214569 -0.0286091 -0.0357614 -0.0429137 -0.050066 P O N M L K J I H G F E D C B A
Max 0.5722E-01 at Node 8743 Min -0. 5721E-01 at Node 4597
P O O O N N N M M M M L L L L L L L K K K K K K K J J J J J J J J J J J J J J I I I I I I I I I I I I I I I I I I I I H H H H H H H H H H H H H H H H H H H H H H H H H H H H H G G G G G G G G G G G G G G G G G G G G F F F F F F F F F F F F F F F E E E E E E E D D D D D C C C C B B B A A
Min -0.5721E-01 at Node 4597 Max 0.5722E-01 at Node 8743
A B C D E F G H I J K L M N O P -0.050066 -0.0429137 -0.0357614 -0.0286091 -0.0214569 -0.0143046 -7.15229E-3 0 7.15229E-3 0.0143046 0.0214569 0.0286091 0.0357614 0.0429137 0.050066 0.0572183 CONTOURS OF DX DISPLACEMENT RESULTS FILE = 1
Increment 15 Load Factor = 0.848562 LOAD CASE = 15
LOAD APPLIED AT CENTRAL POSITION 4555 4556 4557 4558 4559 4560 4562 4563 4571 4579 4587 4595 4603 4611 4618 4610 4602 4594 4586 4578 4570 4561 4585 4584 4583 4582 4581 4580 5514 5515 5516 5517 5518 5519 5495 5504 5512 5520 5528 5536 5544 5552 5545 5537 5529 5521 5513 5505 5497 5496 5494 5493 5492 5491 5490 5489 4767 4542 19695 PANEL 1 PANEL 2 PANEL 2 S4 S4 S6 S6 S2 S2 S3 S3 S7 S7 S8 S8 4770 4545 19698 4545 4542 STIFFENER "A"
PANEL 1 STIFFENER "A"
Stresses SZ [N/mm
2]
(+ve tension / -ve compression)
-400.00 -300.00 -200.00 -100.00 0.00 100.00 200.00 300.00 400.00 increment 1 - LF = 0.25 increment 2 - LF = 0.30 increment 3 - LF = 0.35 increment 4 - LF = 0.40 increment 5 - LF = 0.45 increment 6 - LF = 0.50 increment 7 - LF = 0.55 increment 8 - LF = 0.60 increment 9 - LF = 0.65 increment 10 - LF = 0.70 increment 11 - LF = 0.75 increment 12 - LF = 0.79 increment 13 - LF = 0.82 increment 14 - LF = 0.84 increment 15 - LF = 0.85
Forces in Flanges
(+ve tension / -ve compression)
-60000 -50000 -40000 -30000 -20000 -10000 0 10000 20000 30000 40000 50000 60000 0.2 0.25 0.3 0.35 0.4 0.45 0.5 0.55 0.6 0.65 0.7 0.75 0.8 0.85 0.9 increment F O RCE [ KN]
TOP FLA NGE B OTTOM FLA NGE
Stresses SYZ [N/mm
2]
0.00 50.00 100.00 150.00 200.00 250.00 increment 1 - LF = 0.25 increment 2 - LF = 0.30 increment 3 - LF = 0.35 increment 4 - LF = 0.40 increment 5 - LF = 0.45 increment 6 - LF = 0.50 increment 7 - LF = 0.55 increment 8 - LF = 0.60 increment 9 - LF = 0.65 increment 10 - LF = 0.70 increment 11 - LF = 0.75 increment 12 - LF = 0.79 increment 13 - LF = 0.82 increment 14 - LF = 0.84 increment 15 - LF = 0.85Stresses SZ [N/mm
2]
(+ve tension / -ve compression)
-300.00 -200.00 -100.00 0.00 100.00 200.00 300.00 increment 1 - LF = 0.25 increment 2 - LF = 0.30 increment 3 - LF = 0.35 increment 4 - LF = 0.40 increment 5 - LF = 0.45 increment 6 - LF = 0.50 increment 7 - LF = 0.55 increment 8 - LF = 0.60 increment 9 - LF = 0.65 increment 10 - LF = 0.70 increment 11 - LF = 0.75 increment 12 - LF = 0.79 increment 13 - LF = 0.82 increment 14 - LF = 0.84 increment 15 - LF = 0.85
Forces in Flanges
(+ve tension / -ve compression)
-60000 -50000 -40000 -30000 -20000 -10000 0 10000 20000 30000 40000 50000 60000 0.2 0.25 0.3 0.35 0.4 0.45 0.5 0.55 0.6 0.65 0.7 0.75 0.8 0.85 0.9 increment F O RCE [ KN] TOP FLANGE B OTTOM FLANGE
Stresses SYZ [N/mm
2]
0.00 50.00 100.00 150.00 200.00 250.00 increment 1 - LF = 0.25 increment 2 - LF = 0.30 increment 3 - LF = 0.35 increment 4 - LF = 0.40 increment 5 - LF = 0.45 increment 6 - LF = 0.50 increment 7 - LF = 0.55 increment 8 - LF = 0.60 increment 9 - LF = 0.65 increment 10 - LF = 0.70 increment 11 - LF = 0.75 increment 12 - LF = 0.79 increment 13 - LF = 0.82 increment 14 - LF = 0.84 increment 15 - LF = 0.85Stresses SZ [N/mm
2]
(+ve tension / -ve compression)
-300.00 -200.00 -100.00 0.00 100.00 200.00 300.00 increment 1 - LF = 0.25 increment 2 - LF = 0.30 increment 3 - LF = 0.35 increment 4 - LF = 0.40 increment 5 - LF = 0.45 increment 6 - LF = 0.50 increment 7 - LF = 0.55 increment 8 - LF = 0.60 increment 9 - LF = 0.65 increment 10 - LF = 0.70 increment 11 - LF = 0.75 increment 12 - LF = 0.79 increment 13 - LF = 0.82 increment 14 - LF = 0.84 increment 15 - LF = 0.85


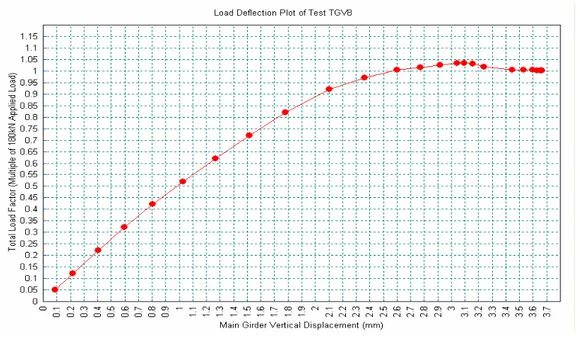
![Figure 2.9 – Load-Deflection Plot recorded in laboratory testing of Test TGV8-2 (Extract from [11])](https://thumb-eu.123doks.com/thumbv2/123dokorg/2881188.10350/27.892.313.657.158.505/figure-load-deflection-plot-recorded-laboratory-testing-extract.webp)
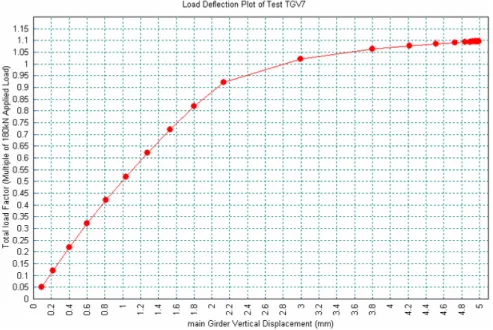

![Figure 2.16 – Load-Deflection Plot recorded in laboratory testing of Test TGV7-2 (Extract from [11])](https://thumb-eu.123doks.com/thumbv2/123dokorg/2881188.10350/33.892.231.688.103.446/figure-load-deflection-plot-recorded-laboratory-testing-extract.webp)

