BT.8
Analyzing Peptides and Proteins by Mass
Spectrometry: Principles and applications
in Proteomics
Maria José Fidalgo1, Eva Olmedo1, Irene Fernández2, and Josep Maria
Estanyol1
1 Unitat de Proteòmica, CCiTUB, Universitat de Barcelona. Casanova 143. 08036 Barcelona, Spain
2 Unitat d’Espectrometria de Masses (Química), CCiTUB, Universitat de Barcelona. Facultat de Química. Martí i Franquès s/n. 08028 Barcelona, Spain. email: [email protected]
Abstract. The study of proteins has been a key element in biomedicine and biotechnology because of their important role in cell functions or enzymatic activity. Cells are the basic unit of living organisms, which are governed by a vast range of chemical reactions. These chemical reactions must be highly regulated in order to achieve homeostasis. Proteins are polymeric molecules that have taken on the evolutionary process the role, along with other factors, of control these chemical reactions. Learning how proteins interact and control their up and down regulations can teach us how living cells regulate their functions, as well as the cause of certain anomalies that occur in different diseases where proteins are involved. Mass spectrometry (MS) is an analytical widely used technique to study the protein content inside the cells as a biomarker point, which describes dysfunctions in diseases and increases knowledge of how proteins are working. All the methodologies involved in these descriptions are integrated in the field Handbook of instrumental techniques from CCiTUB
BT.8
1. 1. 1.
1. IntroduIntroduIntroductionIntroductionctionction
Mass Spectrometry (MS) is an analytical technique that measures mass-to-charge ratios (m/z) of ionized molecules. Peptides and proteins can be analyzed by MS due to their capacity to ionize them under different conditions. Despite mass spectrometers were mainly used to determine the exact mass of low molecules in its first applications, the improvement of ionization methods and mass analyzers has enabled larger molecules such as polymers, peptides and proteins to be analyzed.
Before MS analysis of peptide and proteins started, EDMAN degradation had been used to identify the amino part of proteins through extrusion of aminoacids by chemical reactions. Due to the fact that the amino part of proteins are blocked in a high percentage of living cells, only highly abundant or purified proteins were able to be sequenced. Digestion of proteins by specific proteases and analysis of their peptides improved the methodology and solved this problem. However, the cost and slowness of this method were a handicap to perform high throughput analysis.
In the mid of 1960s preliminary studies for the determination of amino acid sequences in derivatizated peptides were published. The introduction of a matrix to ionize nonvolatile compounds was a significant progression in peptide analysis. In the early 80s, it was possible to determine the molecular mass of insulin and snake toxins with a molecular weight until 13 kDa. By the end of the decade, two new ionization systems were developed in the analysis of peptides and proteins, namely Matrix Assisted Laser Desorption Ionization (MALDI) and Electro Spray Ionization (ESI). These sources and the improvement of mass analyzers opened new perspectives for the analysis of higher molecular weight proteins.
Another important role in the high-throughput analysis of peptides and proteins was the whole genome sequencing of different species. Prior to this, the interpretation of spectra from MS analysis had to be done manually and this process was tedious and slow. After genomes were annotated, in silico comparison between spectra generated after MS analysis with those generated by software from databases, allowed to perform high-throughput analysis of complex samples.
2. 2. 2.
2. Methodology and ApplicationMethodology and ApplicationMethodology and Applicationssss Methodology and Application 2.1. The mass spectrometer
A mass-spectrometer system consists of the following parts: an ionization source interface, where the sample is ionized; the analyzer, where compounds are measured as m/z ratio and the detector. Identification and characterization of peptides and proteins by MS is based on obtaining the exact mass of the molecule, as well as the exact mass of the derivatives of the molecule after a controlled breakdown in a collision cell. Proteins and peptides are polar non-volatile molecules that have to be introduced in gas phase to the MS. These types of analytes are normally soluble in aqueous solutions and specific methods of ionization to transfer them as gas phase into the mass spectrometer without extensive degradation have to be used. The typical ionization sources used in proteomics are MALDI and ESI.
2.2. Matrix Assisted Laser Desorption Ionization (MALDI)
The ionization source generates charged ions in gas phase from a solid-state sample aggregated with a matrix (usually alpha-cyano-4-hydroxycinnamic acid) into a plate. A laser provides the energy required to sublimate the sample and it allows charged ions enter in gas phase to the MS. A high voltage is applied at that moment and ionized molecules are accelerated at the same time inside a high vacuum tube where they fly depending on their mass. Light ions arrive faster than heavy ions to the detector. Most of the acquired ions are only single charge components despite they have more than one element that can be ionized. The resulting spectrum is a single charge spectrum for each molecule.
2.3. Elestrospray ionization (ESI)
BT.8 applying a voltage between the output of a capillary where the sample is being sprayed and the
entrance of the mass spectrometer. This source produces a spray (micro drops) of sample and solvent. When the charge density at the droplet surface reaches a critical value, a so called Coulomb explosion occurs and several even smaller droplets are formed. The process of solvent evaporation, droplet contraction and Coulomb explosions is repeated until the sample is released from the final droplet. the sample is ready to be introduced into the mass spectrometer. While they go through within a heat capillary, the solvent is finally removed by evaporation. The analyte presents as many possible charges in the molecule as possible charged aminoacids may have in the sequence thus generating a multi charge sample. In this case, the spectrum for each molecule is more complex because each molecule could be present as different m/z spectra, depending on the various charges that each component has.
This ionization source is used in liquid samples before entering into the MS, and in most cases, especially in complex samples a High Performance Liquid Chromatography (HPLC) is coupled online, which introduces the sample sequentially. According to the flow used by the HPLC, we call ESI ionization source when the flow rate is about mL/min, microESI when the flow rate is about
µL/min or nanoESI if the flow rate is about nL/min). The minor inner diameter of the columns, the small particle size used in the stationary phase of the chromatography and the decrease in HPLC flows, allows to increase the sensitivity in samples of low concentration of peptides or proteins.
The most common analyzers in the analysis of peptides and proteins are the following: 2.4. Time of Flight
The Time of Flight (TOF) analyzer is based on the time that ions take to fly from the ionization source to the detector, due to its kinetic energy acquired (1/2 mv2) by applying a voltage (approximately 20,000 volts) in the ionization source. These fast moving ions fly through a high vacuum tube, where peptides arrive first to the detector according to the m/z ratio. This analyzer allows a resolution of 15.000 to 40.000 and an accurate mass measurement of less than 10 ppm using internal calibration. Such analyzers are usually coupled to MALDI or ESI ionization sources. 2.5. Triple quadrupole
This mass analyzer consists of two quadrupoles separated by a collision cell. Ions must be moved from the source to the analyzer (different physical regions) where different functions take place. Ions with different m/z ratios have different stability when they are moved through an electromagnetic field. The first quadrupole (Q1) selects ions, the second (Q2) acts as a collision cell where backbone of the molecule is broken after colliding ions with a gas, and the third (Q3) acts as analyzer of m/z ratios. This type of analyzer allows at present good sensitivity, resolution and accuracy. It is useful in quantitative analysis for its resolution and sensitivity of small molecules. The most common ionization source used with this analyzer is the ESI.
2.6. Ion-Trap
The ion-trap analyzer is a special type of quadrupole analyzer, where ions are captured (trapped) into a three-dimensional region applying different voltages and magnetic fields. There are two different types, the 3D ion-traps and the linear ion-traps. In the 3D trap, ions produced in the ionization source are focused into the trap using an electrostatic lens system. An electrostatic ion gate pulses ions into the trap by pulses of voltages (V+ close, V- open) using an opening time that minimizes space-charge effects. A low-pressure of helium (1mTorr) is used in the trap to slow ions and improve resolution by concentrating them at the center of the trap using oscillating voltages. Changing amplitudes of voltage and radio frequency determines instability of ions, depending on a m/z ratio manner and, as a result, they can be detected. In that cycle, one single ion can be trapped, and after using different voltage frequencies, the collision of ions with the helium produces backbone fragmentation and structural information. Linear Ion Trap is a modified ion trap type where the trap is linear, improving ion capabilities and sensitivity. The mass resolution of these instruments varies from 3000 to 15.000.
BT.8
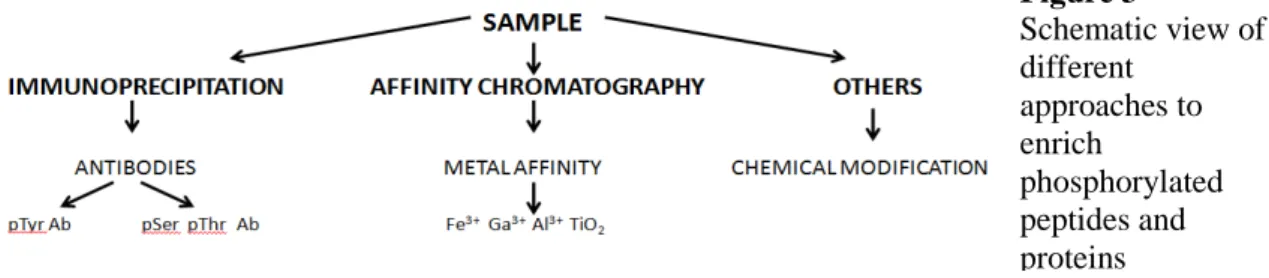
Figure 2 Cross section of a LTQ VELOS ORBITRAP-ETD high-resolution mass spectrometer (form Thermo Fisher
Scientific). 2.7. Orbitrap
This analyzer is based on different resonances obtained from ions with different m/z ratio after they orbit in this analyzer. Ions are injected tangentially and oscillate inside in rings around a central electrode. Different m/z ratio generates different frequencies of oscillation and it is inversely proportional to a square root of m/z (Fig. 2). This analyzer allows at present resolution up to 200.000 (at m/z of 400) and accurate mass measurement of less than 1 ppm using internal calibration. Is the latest development in trapping devices.
Fourier Transform
The Fourier Transform Ion Cyclotron Resonance (FT) is a m/z analyzer based on the cyclotron frequency of the ions under a fixed magnetic field. It gives the highest mass resolution used in proteomics (up to 750.000)
The instrumentation available at the CCiTUB to perform proteomic approaches is the following:
• MALDI TO VOYAGER DE (ABIsciex)
• MALDI TOF-TOF 4800 (ABIsciex)
• LCQ-DECA XP (Thermo)
• LTQ-VELOS-ORBITRAP-ETD (Thermo) (Fig. 1).
• Micro HPLC Surveyor (Thermo)
• Nano HPLC EASY (Proxeon)
• Nano LC-Ultra system (Eksigent) 3.
3. 3.
3. Methodologies Methodologies Methodologies inMethodologies inin Proteomicsin ProteomicsProteomicsProteomics
Most of the mass spectrometer analyzers are not capable of analyzing beyond a m/z ratio of 4000 or 5000. This means that, in most cases, analysis of the sample is not performed with the intact protein due to its high molecular weight. Protein can be cut into small peptides using a controlled digestion (digestion in specific amino acids) by a specific proteases (trypsin, GluC, LysC, others) and the resulting peptides are analyzed by MS.
Due to the complexity of the sample (proteins digestion produces a considerable amount of peptides), prior to MS analysis, peptides have to be separated using chromatographic separation for instance HPLC (see section 3.1.1). Common chromatographic columns in peptide and protein separation are made of non-polar, highly hydrophobic stationary phases (mainly C18, or other) or ion exchange stationary phases (SCX, WAX or others).. The identification and characterization of peptides and proteins by MS relies on two basic concepts, namely obtaining the exact mass (both protein and peptides) and the possibility of breaking the molecule into different parts at the
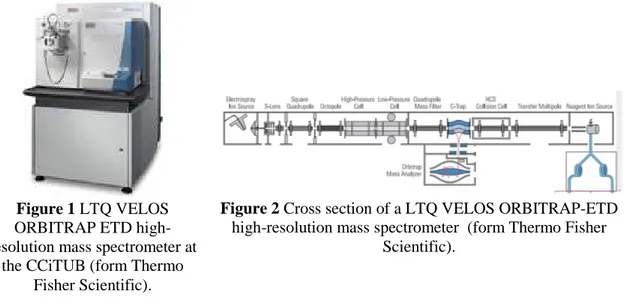
Figure 1 LTQ VELOS ORBITRAP ETD high-resolution mass spectrometer at
the CCiTUB (form Thermo Fisher Scientific).
BT.8 backbone level in a controlled manner to identify the exact mass of the broken ions by tandem
mass spectra.
3.1. Separation technologies
Protein MS identification is a technique highly dependent on separation of peptides and proteins to simplify samples previous to the analysis. There are different methods of separation of proteins or peptides; the gel based methods and the chromatographic methods.
3.1.1. High Performance Liquid Chromatography
HPLC is an analytical technique used to separate peptides and proteins according to their intrinsic properties. Usually Reverse Phase Liquid Chromatography (RPLC) is coupled on-line to ESI ionization sources to separate compounds using volatile mobile phase highly compatible with MS. During decades, efforts to improve peak capacity, sensitivity, reproducibility and speed in the analysis have been done. These efforts conduced to use long narrow capillary columns that improve sensitivity.
3.1.2. Multidimensional Liquid Chromatography
High complex samples containing thousands of proteins proteolytically digested by an enzyme are difficult to analyze after a single RPLC separation. Due to the extremely high number of analytes in the sample and the different dynamic range, a combination of different orthogonality chromatographic separation can be performed. Each dimension uses different molecular properties for the separation. One type of Multidimensional Liquid Chromatography (MudLC) is based on two types of chromatography. The first dimension is performed by a Strong Cation Exchange (SCX) resin followed by RPLC coupled on line to a MS. SCX resins are used due to their high capacity and good resolution. The high complex sample is loaded onto a SCX column and eluted in a series of increasing salt steps or salt gradients where each fraction is loaded onto a RP column coupled online to a MS. Other columns in the first dimension can be used such as hydrophilic stationary phase to separate peptides and proteins.
3.1.3. Affinity Chromatography
Another chromatographic technique useful for proteomic approaches is the affinity chromatography. A protein of interest to be studied is coupled to a resin and packed into a column. Proteins of cell lysates, from tissues, etc, flow through the column and proteins with affinity are bound. After eluting bound proteins, MS can identify them to perform functional proteomics approaches (see below). This technique can also be used for the enrichment of specific molecules as phosphates groups in peptides and proteins. This was very useful to enrich posttranslational modified (PTM) proteins and peptides.
3.1.4. Gel based separations
Gel-based approaches are techniques that separate proteins by their molecular weight (MW). Using ionic detergents such as SDS and a matrix of acrylamide, proteins move through to the acrylamide gels under an electric field depending on their molecular weight. Proteins can also be separated by charge under denatured conditions, without using ionic detergents, in a pH gradient. These two methods are the basis of separation of proteins by 2D-gels. With this methodology, we have a pattern in two dimensions where each spot in the gel is a protein, which can be sliced and digested in-gel by a proteinase. The resulting peptides can be analyzed by MS.
3.2. Proteomic approaches
Proteomic approaches for the identification of peptides and proteins means separation methodologies and MS analysis. The MS analysis can be performed after protein digestion and peptide separation where proteins are identified by sequencing peptides (The Bottom-Up Approach). Proteins can also be analyzed as intact molecules (Top-Down Methods) and the exact mass of the protein and their fragments measured after specific breakdown.
BT.8
3.2.1. The Bottom-Up Approach
In this technique, proteins are digested into peptides prior to MS analysis. Exact mass of peptides and their broken components are determined to know structural information. These experiments require tandem data acquisition in which peptides are subjected to collision induced dissociation (CID). The tandem mass data collected are compared with in-silico-generated fragmentation using databases and a statistical algorithm from which a confidence number for the identification is given. There are different search methods for protein identification such as SEQUEST, MASCOT, XTANDEM, PHENYX. If a protein is pure enough (by chromatographic approaches or 2D gel separation) its identification can be done by peptide mass fingerprinting (PMF), where the protein is identified by listing the exact mass of peptides obtained by MS and compared to anotated proteins databases using specific algorithms.
3.2.2. Top-Down Methods
Top-Down Methods use the exact mass of the intact protein and their fragments for the identification.
Unlike the TOF analyzer that can analyze ranges greater than 100.000 uma without decreasing resolution, other mass analyzers work in a mass range from 2000 to 5000 m/z and the exact mass of a protein can be calculated by deconvolution of their multicharge spectra.
Different fragmentation reactions are needed to fragment intact proteins in this approach. Electron transfer dissociation (ETD) and Electron capture dissociation (ECD) are the most preferred. With these methods, we measure the intact protein directly, in contrast to the bottom-up approach that only measures peptides. This technique has limitations. Larger quantities of protein are required and high-mass accuracy instruments such as LTQ-ORBITRAP or FTMS are needed to resolve isotopic envelops of proteins.
3.3. Proteomic applications 3.3.1. Quantitative proteomics
Proteins can be quantified using MS, which represents one of the key components toward building a functional network. There are two types of MS-based quantitative proteomic methods: the relative quantitative proteomics which compare the relative amount of protein between samples, and the absolute quantitative proteomics which use a quantified standard to determine the exact amount of proteins in the sample.
There are different assays for quantitative MS. Samples can be labeled by isotope-labeling methods and the relative or absolute values between samples can be quantified. Other methods are label free methods, which have been used to quantify relatively protein content in different samples.
3.3.2. Isotope-labeling methods
Isotope-labeling methods bind different isotopic molecules to peptides to compare samples. They can be bound metabolically, chemically or enzymatically.
Metabolically isotope-labeling methods use stable isotopes of aminoacids (Arg, Lys) (15N, 13C for heavy labeling) to label peptides. For stable isotopic labeling aminoacids in cell culture approach (SILAC), cell media containing 13C6-Lys and 15N4-Lys are used. The relative abundance of proteins is calculated by measuring ratios of peptides experiment comparing heavy/light peptides pairs.
Chemical derivatization of peptides can also be used for protein quantification. Different aminoacids can by labeled chemically by different stable isotope tags to measure ratios between heavy/light labeled samples. Different aminoacids can be labeled for that purpose. Isotope-Coded Affinity Tags (ICAT) is used to label free cysteine and Isobaric Tags for Relative and Absolute Quantification (iTRAQ) is used for label free amines.
BT.8 3.3.3. Label Free methods
Other strategies do not use label free active residues of aminoacids with different isotopes to perform relative quantification. In label-free quantitative methods, each sample is prepared, individually LC-MS/MS or LC/LC-MS/MS separated and analyzed. Protein quantification is performed by comparing measurements of ion intensity changes for the same peptides in different LC runs or on the spectral counting to calculate the total number of spectra of the proteins, also by comparing different LC runs.
3.4. Post translation modification proteomics
Proteins are molecules that can be modified enzymatically in specific aminoacids. This might control their activity, the partners that bind to them, the conformation of the protein, and other processes that regulate their function and also the quantity of the protein in the cell. Typical modifications are summarized in table 1.
3.4.1. Phosphoproteomics
Protein kinases are the major regulator of cell processes, and MS is the methodology of choice for identifying and also quantifying phosphorylation sites. This type of regulation has to be highly regulated, and the amount of phosphorytaled proteins present inside cells is not very high. For this reason, chromatographic strategies for enrichment of phosphoproteins or phosphopeptides have to be done prior to MS analysis.
Different affinity-based enrichments can be done for that purpose, immunoprecipitation using specific anti phospho-antibodies, metal oxide affinity chromatography (as TiO2, Fe
3+
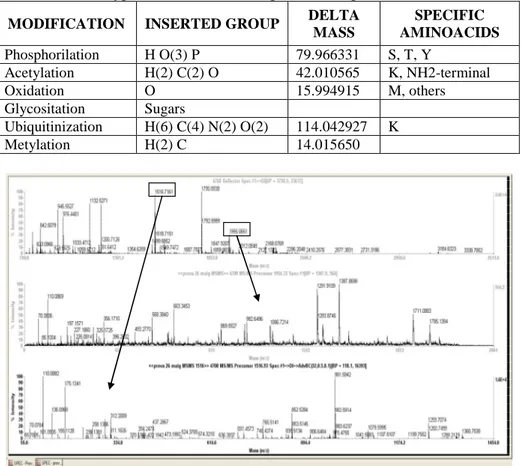
, Ga3+), cation exchange chromatography and also chemical derivatization of phosphate groups (Fig. 3).
3.4.2. Glycoproteomics
Glycosylation is an important and abundant post-translational modification. Glycoproteins are involved in different roles as molecular and cellular recognition in development, cell growth, cellular communication and also in diseases as cancer progression and immune responses. Top down and bottom up approaches are used for the identification of glycosilated proteins. Performing MS/MS experiments, glycosilated peptids can be identified knowing also the glycosil groups added to the proteins.
3.4.3. Ubiquitin
Ubiquitin is a post-translational modification of proteins where a small peptide is attached to protein. This modification is very important in protein degradation and also for controlling protein levels in the cell. Using MS approaches, ubiquitin can be detected and the specific aminoacid where it is attached can be determined.
4. 4. 4.
4. Examples of applications Examples of applications Examples of applications Examples of applications
The identification and sequencing of peptides and proteins by MS is nowadays the basis of high throughput proteomic analysis. Biomedicine and biotechnology are the major fields of interest, even that others are emerging, such as agriculture, veterinary, etc
Figure 3 Schematic view of different approaches to enrich phosphorylated peptides and proteins
BT.8
4.1. MALDI-TOF/TOF Analysis of proteins: Peptide Mass Fingerprinting and Peptide Sequencing In this example, proteins were extracted from their medium and separated by 2D-SDS-PAGE.The spot of interest was cut from the gel, washed and digested with trypsin. The tryptic peptides were eluted from the gel by washing, and analyzed by MALDI-TOF/TOF. The results are shown in Fig. 4.
Table 1. Typical modifications of proteins in specific aminoacids MODIFICATION INSERTED GROUP DELTA
MASS SPECIFIC AMINOACIDS Phosphorilation H O(3) P 79.966331 S, T, Y Acetylation H(2) C(2) O 42.010565 K, NH2-terminal Oxidation O 15.994915 M, others Glycositation Sugars Ubiquitinization H(6) C(4) N(2) O(2) 114.042927 K Metylation H(2) C 14.015650
Figure.4 a) MALDIi TOF reflector spectrum of a tryptic digest (matrix: CHCA). Internal calibration with proteolitic fragments of Trypsin gives mass accuracy measurements for the peptides < 15ppm ensuring a good Peptide Mass Fingerprinting search. b) and c) MALDIi-TOF/TOF (MS/MS) spectra of the two tryptic peptides selected from the MS analysis. The good
sensitivity and mass measurements ensure a good Peptide Sequence Analysis. 4.2. Quantitative proteomics
Quantification of proteins is an important differential analysis, such as in comparisons of samples from diseased and healthy states. In biomedicine is important to know which proteins are related to a disease. For these reason, proteomic analysis can be performed to quantify samples between controls to disease, and between different stages of a disease. To perform these experiments, samples can be compared using different approaches.
If isotopic tags are used as Isobaric tags for relative and absolute quantitation (iTRAQ) firstly proteins are digested and peptides labeled. The samples are mixed and separated by chromatography. The same peptides with different tag coelute from HPLC, and the mass spectrometer can analyze them. Specific software can quantify the relative amount of each tag and determine quantitation of the sample.
Label free methods perform an HPLC run for each sample. The total amount of spectra that identifies a protein is used to calculate the relative quantity of each protein by an algorithm. This technique is also useful in biomarker discovery in human disease.
BT.8 4.3. Phosphorilationmodifications.
Phosphorylation is the most highly studied and known post-translational modification for its relationship with cellular functions. To perform these experiments, firstly phosphorylated peptides must be enriched. For that purpose, different methods are used. If phosphoproteins want to be enriched, immunoprecipitation or metal affinity can be used. For peptides, after digestion proteins by a specific protease, phosphopeptides are enriched by metal affinity columns. The use of TiO2
columns gives better results but others can be used (Fe3+, Ga3+..). An example of a phosphorilated peptide spectrum is shown below (fig. 5).
4.4. Functional proteomics
The study of protein-protein interactions by MS is an important field of analysis in the post-genomic era to understand protein function. A variety of MS–based approaches allows characterization of cellular protein-protein interactions and subsequent assignment of individual proteins to specific pathways and networks.
The idea is that proteins bind to other proteins to perform cell functions, by mean enzimatic activity or modulating this activity. There are different functional technology approaches that can be integrated together to have a global view of the functional biological systems. Proteomics based in affinity chromatography and MS can help us to find new functions of proteins unknown at that time.
To identify the proteins involved in biological processes and signaling pathways a proteomic approach consist of express a recombinant protein purification, immobilized it on a matrix and perform affinity chromatography using cell extracts or purified cell fractions, as nuclei, mitochondria, lysosomes, plasmatic membrane. After washing, the bound proteins obtained by these interactions are separated by a SDS.PAGE gel electrophoresis. Proteins are sliced from the gel, digested and identified by MS. Using this approach, hundreds of proteins can be identified, and the information obtained is processed using ontology databases in order to know all processes and pathways in which they are involved, as well as in which cellular compartment proteins they interact.
After sequencing proteins, all the information can be grouped in protein ontologies to understand the biological system.
4.5. Proteomics of promoters
Promoters of genes are the regions of DNA where regulator factors bind and regulate gene expression. Many of these regulators are proteins that bind directly to DNA or to other proteins that bind to DNA and regulate gene expression. There is an important field in biomedicine that studies how genes regulates their expression and how can be involved in diseases. MS can identify proteins
EQsEEQQQQTEDELQDK
Figure. 5 Spectrum of EQsEEQQQQTEDELQDK phosphorilated peptide. *
indicates non broken peptide. ** indicates phosphoserine
*
&
BT.8
related to promoters by dsDNA affinity chromatography. For that purpose, dsDNA is coupled to a matrix in a column. Cell extracts are passed through the column and proteins with affinity to dsDNA will be kept in the column. After extensively washing, the proteins of interest are eluted from the column an identified by MS.
4.6. Analysis of intact proteins
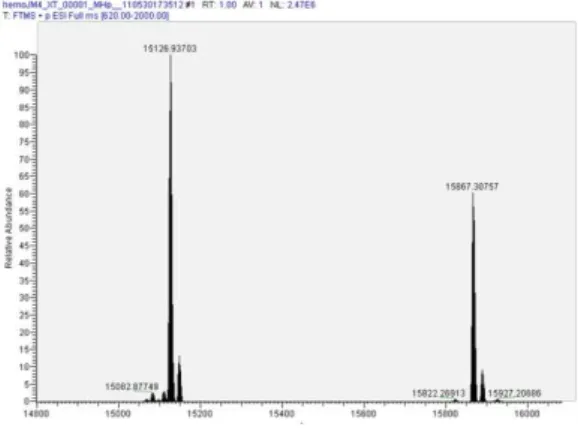
High-resolution MS allows the characterization of intact proteins. An spectrum of an intact protein provides the exact mass of the molecule as well as the exact mass of all modified entities of it. For that analysis, it is essential to use high-resolution instruments such as Orbitraps or FT mass spectrometers. Both ionization methods, MALDI and ESI, can be used for that purpose, but MALDI mass spectrometers result in broad m/z peaks and low intensity for proteins above about 20 kDa. ESI ionization coupled to TOF analyzers or high-resolution instruments such as ORBITRAP or FTMS mass spectrometers can determine the exact molecular mass with a resolution of above of 120000 (see Figs. 6 and 7).
Figure 6 High-resolution spectrum of intact purified hemoglobin protein from blood.
Figure 7 Exact mass of a hemoglobin protein after deconvoluted high resolution mass
spectrum.
R R R
Referenceseferenceseferenceseferences
[1] Oliva R, de Mateo S, Estanyol JM. Sperm cell proteomics. Proteomics. 2009 Feb;9(4):1004-17. Review
[2] Vera J, Estanyol JM, Canela N, Llorens F, Agell N, Itarte E, Bachs O, Jaumot M. Proteomic analysis of SET-binding proteins. Proteomics. 2007 Feb;7(4):578-87.
[3] Estanyol, Josep M; Bachs, Oriol. La proteómica como herramienta de diagnóstico y pronóstico: aplicación en el hepatocarcinoma. GH Continuada. 2010;9:172-5.
[4] John R. Yates, Cristian I. Ruse,and Aleksey Nakorchevsky. Proteomics by Mass Spectrometry: Approaches, Advances, and Applications.. Annu. Rev. Biomed. Eng. 2009. 11:49–79
[5] Adam M. Hawkridge and David C. Muddiman. Mass Spectrometry–Based Biomarker Discovery: Toward a Global Proteome. Annu. Rev. Anal. Chem. 2009. 2:265–77
[6] Peter Roepstorff. Mass Spectrometry in the Analysis of Peptides and Proteins, Past and Present Methods in Molecular Biology, Vol 61 Protein and Peptide Analysis by Mass Spectrometry. J R Chapman Humana Press Inc , Totowa, NJ