2016, Volume 3, e3195 ISSN Online: 2333-9721 ISSN Print: 2333-9705
A Graphical Classification of European Countries
According to Physical Activity Level of Its Citizens
Daniel Ríos
1, Toni Monleón-Getino
2,3*, Marta Cubedo
2, Martín Ríos
2,31INS de Sales, Viladecans, Barcelona, Spain
2Section of Statistics, Department of Genetics, Microbiology and Statistics, University of Barcelona, Barcelona, Spain 3Biostatistics and Bioinformatics Research Group (GRBIO), Barcelona, Spain
Abstract
Data on self-reported frequency of exercising or playing sport of adults aged 15 and above in 27 EU countries were collected, from the European Commission’s Special Eurobarometer. A graphical output was obtained using classical a statistical method-ology known as metric Multidimensional Scaling method to better define the inter-relationships between a large set of variables for the data from the 27 European coun-tries and “average” country included in the study. People in Sweden, Denmark and Finland had the highest level of exercise and playing sport level. High level of exercise and play sport level were detected in Slovenia, the Netherlands, Belgium, Germany, Luxembourg, the United Kingdom and France while low level of exercise and play sport level were found in Romania, Hungary, Italy, Poland and Portugal. The lowest level of exercise and play sport was observed in Bulgaria and Greece. The groups of coun-tries that result from this classification also are characterized by the extent of the dif-ference between the lowest levels of activity (never practising) and the highest (regu-larly practising); Austria, Czech Republic and Slovakia, have the highest proportion of people who seldom practising. In 4 countries, Ireland, Malta, Republic of Cyprus and Portugal, the proportion of citizens who practice exercise or play sport regularly or never (extreme behaviour) is high. This study shows what a high level and regularly of exercise and playing sport are associated with adults participating in education and training, satisfaction with household financial situation and kind of work activity.
Subject Areas
Applied Statistical Mathematics, Public Health, Sports Science, Statistics
Keywords
Physical Activity, Health, Europe, Data Analysis, Multidimensional Scaling
How to cite this paper: Ríos, D., Monleón- Getino, T., Cubedo, M. and Ríos, M. (2016) A Graphical Classification of European Coun- tries According to Physical Activity Level of Its Citizens. Open Access Library Journal, 3: e3195.
http://dx.doi.org/10.4236/oalib.1103195 Received: November 3, 2016
Accepted: December 25, 2016 Published: December 28, 2016 Copyright © 2016 by authors and Open Access Library Inc.
This work is licensed under the Creative Commons Attribution International License (CC BY 4.0).
http://creativecommons.org/licenses/by/4.0/
1. Introduction
Physical activity is closely related to the morbidity and mortality in developed coun-tries, where non-communicable diseases have increased rapidly as reported by World Health Organization (WHO) [1]. Lack of physical activity is one of the main causes of being overweight and obesity, cardiovascular disease, type-II diabetes and osteoporosis. The WHO [1] recommended that people should be physically active for at least 30 minutes each day. It is necessary to perform 30 minutes of moderate level physical ac-tivity on most days of the week to be physically active.
Regular physical activity reduces the risk of cerebrovascular and coronary events ac-cording to Guillumet et al. (1996) [2] and Powell et al. (1987) [3]. Physical activity can also help to combat psychiatric disorders: improved anxiety disorders [4] and reducing depression [5]. The relationships between physical inactivity and mental health are analyzed by Arentet et al. (2000) [6]; Bouchard & Shephard (1994) [7]; Netz et al. (2005) [8]; Petruzzello et al. (1991) [9] and McDonald & Hodgdon, (1991) [10] and Crews & Landers (1987) [11]. Physical activity may also help people maintain tobacco abstinence [12]. This is why the European Commission published a statistical report of the physical activity of the citizens of the European Union, country by country. The Commission wanted to develop an overall strategy for increasing general awareness of the effects of physical activity on health and of the positive impact of preventive health in countries with low proportion of citizens practising physical exercise. This report, however, gives too much information, for use in an objective study.
At present, large amounts of data have to be handled in quantitative analysis of physical activity. As a result, demand for multivariate data processing methods is in-creasing, using taxonomic methods and graphs [13] [14] [15]. Moreover, descriptive multivariate statistical and graphs of data now make up a significant part of the content of epidemiology course content. Haux et al., (1992) [16] and Tokarski et al. (2004) [17]
report an analysis of sports activity in the European Union, dealing with differences in the quality of the commitment to sports among the population.
Physical activity is defined as any bodily movement produced by skeletal muscles that require energy expenditure. This includes occupational physical activity, physical activity at home and physical activity related to commuting. We have mentioned some issues related to sport in Europe, but few studies examine moderate physical activity (including that previously mentioned), although it is important. Physical activity in the European Union has been a topic at conferences (see e.g. Schriften der Deutschen-Verinigungfür Sportwissenschaft in Leipzig [18] and specific training in the leisure)
[19].
In this study, we analysed the exercise and play sport level of citizens (all adults aged 15 and above) of the European Union, by means of a graphic representation, using metric Multidimensional Scaling (MDS) [20][21][22]. Data on the exercise and play-ing sport level reported in European Commission as reported by Townsend et al. (2012) [23] were summarized in order to facilitate the study of exercise and play sport
level and regularly in 27 + 1 countries, 27 European countries and 1 European Union country weighted average.
This work has allowed us to classify the countries of the E.U., according to level of physical activity behaviour. We have also related it with social aspects of the popula-tions.
2. Material and Methods
2.1. Reported Cases
The data presented in this study were provided by the European Commission [23]. 26,788 European citizens were interviewed by TNS Opinion & Social network between 2 October and 19 October 2009 in 27 European Union Member States and can be fur-ther filtered, tabulated, charted and downloaded. They are available (This information permit to repeat the work) at:
http://ec.europa.eu/sport/news/eu-physical-activity-guidelines_en.htm. The data analysed correspond to 27 European countries and one “average” country called EU. This coun-try is the weighted average of the countries comprising European Union.
2.2. Data Codification
Each country has 4 variables for exercise and play sport level. Each country is repre-sented by one n-dimensional random vectors Xh; Xh =
(
Xh1,,Xhn)
where Xhi represents the percentage of citizens from country h who stated that they performed a level i of exercise and play sport i = 1, 2, 3, 4; 1 (never), 2 (seldom), 3 (with some regu-larity, between once a week and 4 times a week) and 4 (reguregu-larity, at least 5 times a week). In this study 1 ≤ h ≤ 27and n = 4.2.3. Statistical Analysis
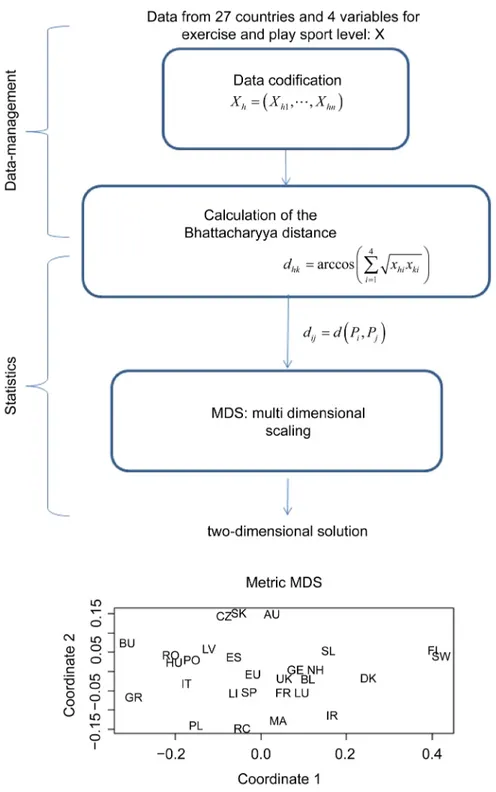
A powerful multivariate methodology was used in this study. In Figure 1 is shown, schematically, how they work the different statistical procedures are used to obtain a classification according to different sports. These processes are commented further-more.
2.3.1. Calculation of the Bhattacharyya Distance
Each country was assigned the vectors xh =
(
xh1,xh2,xh3,xh4)
a realization of randomvector Xh 100; xhi (the fraction per unit of citizens who performed level i of physi-cal activity), xh1+xh2+xh3+xh4=1.
If we consider Xh 100 as a random variables distributed as a multinomial with
pa-rameters
(
xh1,xh2,xh3,xh4)
The distance between the country h represented by(
1, 2, 3, 4)
h h h h h
P = x x x x and the country k represented by Pk =
(
xk1,xk2,xk3,xk4)
is given by d, where d is Bhattacharyya distances [24]:4 1 arccos hk hi ki i d x x = =
∑
(1)Figure 1. Algorithm of the data management and statistical processes used during this study.
2.3.2. Multidimensional Scaling
Multidimensional scaling (MDS) is a means of visualizing the level of similarity of indi-vidual cases of a dataset. It refers to a set of related ordination techniques used in in-formation visualization, in particular to display the inin-formation contained in a distance matrix. An MDS algorithm aims to place each object in N-dimensional space such that the between-object distances are preserved as well as possible. Each object is then
as-signed coordinates in each of the N dimensions [21].
Based on the Bhattacharyya distances obtained, a MDS was performed. The distance
matrix between countries,
( )
27 27 ij D d × = , dij =d P P
(
i, j)
is an distance between Pi, Pj countries i, j respectively.( )
27 27 ij A a × = , 1 2 2 ij ija = − d (is a measure of the similarity);
( )
ij 27 27H h
×
= , 1
27
H= −I EE′ where I is an identity matrix of size 27 × 27.E = (1, ∙∙∙,
1)', is a column vector of size 27. B = HAH, is the sample matrix of covariance of the values of A. Their eigenvalues are: λ1≥λ2 ≥≥λr ≥ >0 λr+1≥≥λ27 (real numbers since B is symmetrical) and eigenvectors of the matrix B were calculated.
(
1 2)(
1 2) (
1 2)(
1 2)
B=TD Tλ ′= TDλ D Tλ ′ = TDλ TDλ (2)
(
1 27)
diag , ,Dλ = λ λ (3)
where the ith column of T is the ith eigenvector associated with λi. If
1 2
Y =TDλ (4)
the rows of Y are the coordinates of 27 points (Q1, ∙∙∙, Q27) on R27. If B is a non negative definite matrix:
(
i, j) (
i, j)
d Q Q =d P P (5)
If B is a not nonnegative definite matrix, we obtain pure imaginary values when cal-culating 1 2
Dλ and the rows of Y are in the form:
(
yj1,,yjr, −1yjr+1,, −1yjm)
(6)If
(
2 2 2) (
2 2)
1 2 r 1 27
ψ = λ +λ ++λ λ ++λ is a sufficiently large value (greater than 0,
9) we can consider [20] the rows of Y in the form:
(
yj1,,yjr, 0,, 0)
(7)Then we obtain the coordinates of the EU country, considering EU as the country 28.
We calcúlate 2 2
i
d =d (EU, i), distance squared between EU and country i.
If we consider the vector
(
2 2 2)
1, 2, , 27 ,
d d d
=
d the coordinates of the new country
Q28 EU “average” will be [25],
(
)
1 1 28 1 2 Q = D Y− − b d− where b=diagonal B( )
(8)Then we performed a MDS analysis with the 28 points (Q1, ∙∙∙, Q28). This method al-lowed us to construct a diagram showing the relationships between a numbers of ob-jects. The diagram is a small p-dimensional space, generally p = 2or p = 3.The main purpose is to reduce data from a large number of variables to fewer components, so making it possible to view the similarities and differences between the countries studied
[20][22][26].
All analyses were performed using the function cmdscale() from the R package HSAUR as reported by Venables & Ripley (2002) [27] for metric MDS.
3. Results
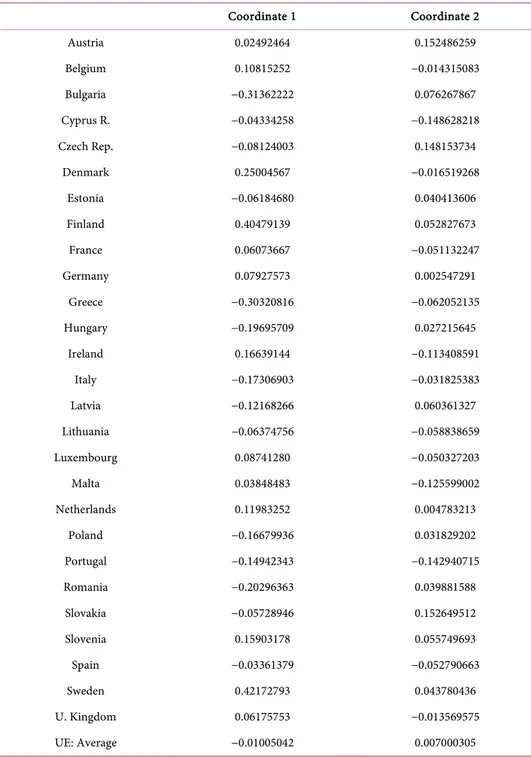
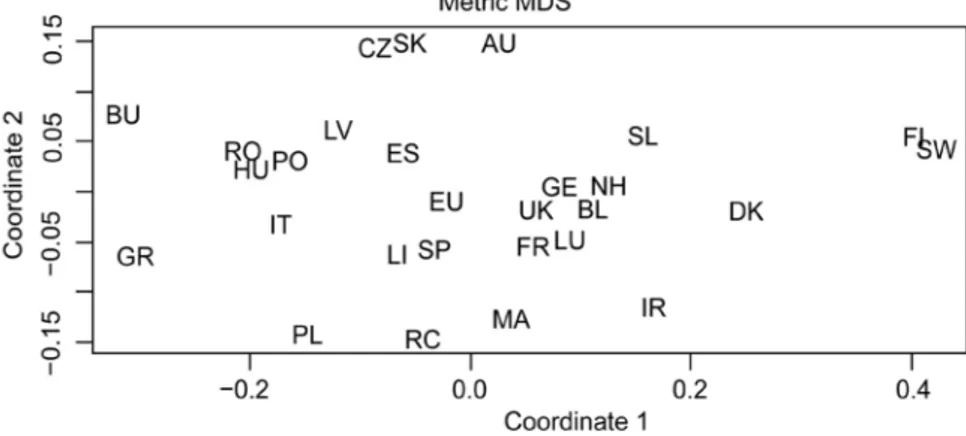
The MDS produced a two-dimensional solution. The MDS is summarised in Table 1. The inertia percentages accounted for by the first two axes were 76.4% and 15.3%. These components explained more than 91% of the total variation. The two-dimensional coordinates and display obtained is shown in Table 2 and Figure 2.
“First component” reflects the differences between countries, indicating the general level of activity. On the left-hand side of Figure 2, are the countries, whose people
Table 1. Eigenvalues, criterion of Mardia and inertia percentages. Eigenvalues
Eigenvalues (λi) for all axes
λ1 = 8.929562e−01 λ2 = 1.789157e−01 λ3 = 9.874179e−02 λ4 = 1.452291e−03 λ5 = 1.142556e−05 λ6 = 7.109765e−06 λ7 = 2.254935e−06 λ8 = 1.368391e−06 λ9 = 3.871012e−07 λ10 = 5.068683e−08 λ11 = 2.059860e−08 λ12 = 2.539000e−09 λ13 = 1.378020e−10 λ14 = 3.803231e−17 λ15 = −1.234949e−11 λ16 = −1.702620e−10 λ17 = −3.407420e−10 λ18 = −7.284797e−10 λ19 = −2.172229e−09 λ20 = −6.728008e−09 λ21 = −5.675427e−08 λ22 = −1.464371e−07 λ23 = −4.386321e−06 λ24 = −5.880097e−05 λ25 = −1.622111e−04 λ26 = −4.975911e−04 λ27 = −9.651985e−04 λ28 = −2.326658e−03
Criterion of Mardia for the first two axes
2 2 1 2 28 2 1 0.9883706 i i λ λ λ = + = ∑
Inertia percentages for the first two axes 1 2 28 1 0.9176408 i i λ λ λ = + = ∑
Inertia percentages for the first axe 1 28 1 0.7644692 i i λ λ = = ∑
Inertia percentages for by the second axe 2 28 1 0.1531716 i i λ λ = = ∑
Table 2. Coordinates of the 27 European countries and one average country from a two-dimen- sional non-metric multidimensional scaling based on physical activity levels.
Coordinate 1 Coordinate 2 Austria 0.02492464 0.152486259 Belgium 0.10815252 −0.014315083 Bulgaria −0.31362222 0.076267867 Cyprus R. −0.04334258 −0.148628218 Czech Rep. −0.08124003 0.148153734 Denmark 0.25004567 −0.016519268 Estonia −0.06184680 0.040413606 Finland 0.40479139 0.052827673 France 0.06073667 −0.051132247 Germany 0.07927573 0.002547291 Greece −0.30320816 −0.062052135 Hungary −0.19695709 0.027215645 Ireland 0.16639144 −0.113408591 Italy −0.17306903 −0.031825383 Latvia −0.12168266 0.060361327 Lithuania −0.06374756 −0.058838659 Luxembourg 0.08741280 −0.050327203 Malta 0.03848483 −0.125599002 Netherlands 0.11983252 0.004783213 Poland −0.16679936 0.031829202 Portugal −0.14942343 −0.142940715 Romania −0.20296363 0.039881588 Slovakia −0.05728946 0.152649512 Slovenia 0.15903178 0.055749693 Spain −0.03361379 −0.052790663 Sweden 0.42172793 0.043780436 U. Kingdom 0.06175753 −0.013569575 UE: Average −0.01005042 0.007000305
who practice exercise or play sport regularly in greater proportion. The first component was clearly positive values (indicating highest exercise and play sport level) in 3 coun-tries (Sweden, Finland and Denmark). In 10 councoun-tries (Slovenia, The Netherlands, Bel-gium, Luxembourg, Germany, France, United Kingdom, Austria, Ireland and Malta), the first component was positive values, indicating high exercise and play sport level. The first component was clearly negative values (indicating the lower exercise and play
Figure 2. Two-dimensional graphic display of 27 European countries and one average country, based on metric Multidimensional Scaling. (AU: Austria, BL: Belgium, CZ: Czech Republic, DK: Denmark, ES: Estonia, FI: Finland, FR: France, GE: Germany, GR: Greece, HU: Hungary, IR: Ire-land, IT: Italy, LV: Latvia, LI: Lithuania, LU: Luxembourg, MA: Malta, NH: Netherlands, PO: Poland, PL: Portugal, RC: Republic of Cyprus, SL: Slovakia, SL: Slovenia, SP: Spain, SW: Sweden, U K: United Kingdom, EU: Total E. U., BU: Bulgaria, RO: Romania).
sport level) in 2 countries (Bulgaria and Romania). In 5 countries (Romania, Hungary, Poland, Italy and Portugal), the first component was negative values, indicating low ex-ercise and play sport level. In 7 countries (Latvia, Estonia, Lithuania, Spain, The Czech Republic, Slovakia and Republic of Cyprus) the first component was moderate negative values (indicating moderate low exercise and play sport level).
“Second component” reflects the differences between countries, indicating the per-centages of people with extreme attitudes: they either practise exercise or play sport regularly or, on the contrary, never practise exercise or play sport, or percentage of people who practise exercise or play sport seldom, but not never.
The second component was positive (indicating that the proportion of citizens who practice exercise or play sport regularly or never is low) in 3 countries (The Czech Re-public, Slovakia and Austria), and negative (indicating that the proportion of citizens who practice exercise or play sport regularly or never is high) in 4 countries (Ireland, Malta, Republic of Cyprus and Portugal). Then we identified seven population groups:
Group I: Sweden, Finland and Denmark.
Group II: Group IIa: Slovenia, The Netherlands, Belgium, Luxembourg, Germany, United Kingdom and France. Group IIb: Austria. Group IIc: Ireland and Malta.
Group III: Group IIIa: Latvia, Estonia, Lithuania and Spain. Group IIIb: The Czech Republic and Slovakia. Group IIIc: Republic of Cyprus.
Group IV: Group IVa: Romania, Hungary, Poland and Italy. Group IVb: Portugal. Group V: Bulgaria and Greece.
4. Discussion
In this study, graphs were used to plot the data on physical activity levels in various countries. “Dimension 1” represents the exercise and play sport level studied. The “Di-mension 2” represents “behaviour”, i.e. people’s extreme attitudes, practice exercise or
play sport, they do it, never or regularly, or not extreme attitudes, seldom.
In those countries with points whose first dimension has a high positive value, it is interpreted that people have regularly attitudes on exercise and play sport. Conversely, if the coordinates of the points have a lower-value first dimension, this is interpreted as indicating that most of the population never or seldom practise.
This study shows differences in physical activity regularly in selected European countries. It can be seen that Bulgaria and Greece, particularly, and Romania, Hungary, Poland, Italy and Portugal are the countries where the proportion of people spent less time on exercise and play sport is lowest. These are the European Southern countries, together with Bulgaria, Romania, Hungary and Poland. The groups also includes the countries in which people are with financial problems. On the other hand, the Group I (the Nordic countries) and Group II are the countries where the proportion of people spent more time on exercise and play sport is largest, includes the countries in which the people think their household financial situation is good according to European Commission (2011) [28].
People think their household financial situation is good: Sweden (90%), Finland (88%) and Denmark (89%). On the other hand, Bulgaria (28%) and Greece (24%). Therefore we consider that physical activity is associated with percentage of people what think their household financial situation is good.
Regular physical activity is linked to employment development of the non-agricultural sector. The percentage of employment in secondary and tertiary (% total employment) of Sweden (97.9%), Finland (95.1%) and Denmark (97.4%), On the other hand, Bul-garia (80.4%), Greece (88.8%), Poland (86.7%), Portugal (88.9%), Romania (69.9%)
[29].
Regular physical activity is linked to percentage of adults participating in education and training: Sweden (25%), Finland (23.7%) and Denmark (32.3%), Luxembourg (13.5%), The Netherlands (16.7%), Austria (13.4%), Slovenia (15.9%). On the other hand, Bul-garia (1.2%), Greece (2.4%), Poland (4.5%) and Romania (1.5%). Data available at:
http://ec.europa.eu/agriculture/sites/agriculture/files/statistics/rural-development/2011/ ch35_en.pdf.
5. Conclusions
This study provides a summary of data corresponding to 4 variables using a single standard graph. The graph output allowed us to classify European countries according to physical activity regularity. Using these graphical methods, we were able to study the relationship between physical activity regularity taken by people and the features that give them their identity: People (percentage) think that their household financial situa-tion is good, percentage of employment in secondary and tertiary (% total employ-ment) or percentage of adults participating in education and training.
This study also aims to encourage future researchers to present information accom-panied by multivariate methods to appropriately summarise and describe this informa-tion.
Acknowledgements
This work is partially supported by grant 2014 SGR 464 (GRBIO) from the Departa-ment d’Economiai ConeixeDeparta-ment de la Generalitat de Catalunya (Spain).
References
[1] World Health Organization (2002) The World Health Report 2002. Reducing Risks, Pro-moting Health Life. Geneva.
[2] Guillum, R.F., Mussolino, M.E. and Ingram, D.D. (1996) Physical Activity and Stroke Inci-dence in Women and Men. The NHANES (National Health and Nutrition Examination Survey) I. Epidemiologic Follow-Up Study. American Journal of Epidemiology, 143, 860- 869. https://doi.org/10.1093/oxfordjournals.aje.a008829
[3] Powell, K.E., Thompson, P.D., Casperson, C.J. and Kendrick, J.S. (1987) Physical Activity and the Incidence of Coronary Heart Disease. Annual Review of Public Health, 8, 253-287. https://doi.org/10.1146/annurev.pu.08.050187.001345
[4] Biddle, S.J.H., Fox, K.R. and Boutcher, S.H. (2000) Physical Activity and Psychological Wellbeing. Ed. Routledge, London.
[5] Lawlor, D.A. and Hopker, S.W. (2001) The Effectiveness of Exercise as an Intervention in the Management of Depression: Systematic Review and Meta-Regression Analysis of Ran-domized Controlled Trials. BMJ, 322, 763-767. https://doi.org/10.1136/bmj.322.7289.763 [6] Arent, A.M., Landers, D.M. and Etnier, J.L. (2000) The Effects of Exercise on Mood in
Older Adults. A Meta-Analytic Review. Journal of Aging and Physical Activity, 8, 407-430. https://doi.org/10.1123/japa.8.4.407
[7] Bouchard, C. and Shephard, R.J. (1994) Physical Activity, Fitness and Health: The Model and Key Concepts. In: Bouchard, C., Shephard, R.J. and Stephens, T., Eds., Physical Activ-ity, Fitness and Health: International Proceeding and Consensus Statement. Human Kinet-ics, Ed. Champaign, Illinois.
[8] Netz, Y., Wu, M.J., Becker, B.J. and Tenenbaum, G. (2005) Physical Activity and Psycho-logical Well-Being in Advanced Age: A Meta-Analysis of Intervention Studies. Psychologi-cal and Aging, 20, 272-284. https://doi.org/10.1037/0882-7974.20.2.272
[9] Petruzzello, S.J., Landers, D.M., Hatifield, B.D., Kubitz, K.A. and Salazar, W. (1991) A Metaanalysis on the Anxiety Reducing Effects of Acute and Chronic Exercise. Sport Medi-cine, 11, 143-182. https://doi.org/10.2165/00007256-199111030-00002
[10] McDonald, D.G. and Hodgdon, J.A. (1991) Psychological Effects of Aerobic Fitness Train-ing. Research and Theory. Springer-Verlag, New York.
https://doi.org/10.1007/978-1-4612-3182-0
[11] Crews, D.J. and Landers, D.M. (1987) A Meta-Analytic Review of Aerobic Fitness and Re-activity to Psychological Stressors. Medicine & Science in Sports & Exercise, 19, 114-120. [12] Prochaska, J.J., Hall, S.M., Humfleet, G., Muñoz, R.F., Reus, V., Gorecki, J. and Hu, D.
(2008) Physical Activity as a Strategy for Maintaining Tobacco Abstinence: A Randomized Trial. Preventive Medicine, 47, 215-220.https://doi.org/10.1016/j.ypmed.2008.05.006 [13] Woolf, A., Ansley, L. and Bidgood, P. (2007) Grouping of Decathlon Disciplines. Journal of
Quantitative Analysis in Sports, 3, Article No. 5. http://www.bepress.com/jqas/vol3/iss4/5 https://doi.org/10.2202/1559-0410.1057
[14] Bracewell, P.J., Farhadieh, F., Jowett, C.A., Forbes, D.G.R. and Meyer, D.H. (2009) Was Bradman Denied His prime? Journal of Quantitative Analysis in Sports, 5, Article No. 3. [15] DeSarbo, W.S. (2010) A Spatial Multidimensional Unfolding Choice Model for Examining
the Heterogeneous Expressions of Sports Fan Avidity. Journal of Quantitative Analysis in Sports, 6, Article No. 3. http://www.bepress.com/jqas/
https://doi.org/10.2202/1559-0410.1232
[16] Haux, R., Dudeck, J., Gaus, W., Leven, F.J., Kunath, H., Michaelis, J., Pretschner, D.P., Sonntag, H.G., Thumayr, R. and Wolters, E. (1992) Recommendations of the German As-sociation for Medical Informatics, Biometry and Epidemiology for Education and Training in Medical Informatics. Methods of Information in Medicine, 31, 60-70.
[17] Tokarski, W., Steinbach, D., Petry, K. and Jesse, B. (2004) Two Players One Goal. Sport in the European Union. Meyer & Meyer, Aachen.
[18] Würth S., Panzer S., Krug J. and Alfermann D. (2005) Sport in Europa (Schriften der Deutschen Vereinigung für Sportwissenschaft, Bd. 151). Czwalina, Hamburg.
[19] Ferranti, A. (2005) Training im Freizeitsport. In: Würth, S., Panzer, S., Krug, J. and Alfer-mann, D., Eds., Sport in Europa (Schriften der Deutschen Vereinigung für Sportwissen-schaft Bd. 151), Czwalina, Hamburg.
[20] Mardia, K.V., Kent, J.T. and Bibby, J.M. (1979) Multivariate Analysis. Academic Press, London.
[21] Borg, I. and Groenen, P.J.F. (2005) Modern Multidimensional Scaling: Theory and Applica-tions. 2nd Edition, Springer, New York.
[22] Zimmermann, K. and Gibrat, J.F. (2010) Amino Acid “Little Big Bang”: Representing Amino Acid Substitution as Dot Products of Euclidean Vectors. BMC Bioinformatics, 11, 4.
https://doi.org/10.1186/1471-2105-11-4
[23] Townsend, N., Bhatnagar, P., Wickramasinghe, K., Scarborough, P., Foster, C.H. and Rayner, M. (2012) Physical Activity Statistics 2012. British Heart Foundation Health Pro-motion Research Group, Department of Public Health, University of Oxford, Oxford. http://www.bhf.org.uk/publications/view-publication.aspx?ps=1001983
[24] Bhattacharyya, A. (1946) On a Measure of Divergence between Two Multinomial Popula-tions. Sankhyä, 7, 401-406.
[25] Gower, J.C. (1968) Adding a Point to Vector Diagrams in Multivariate Analysis. Biometrika Trust, 55, 582-585.https://doi.org/10.1093/biomet/55.3.582
[26] Manly, B. (2004) Multivariate Statistical Methods: A Primer. 3rd Edition, Chapman & Hall/CRC, London.
[27] Venables, W.N. and Ripley, B.D. (2002) Modern Applied Statistics with S. 4th Edition, Springer, New York.https://doi.org/10.1007/978-0-387-21706-2
[28] European Commission (2011) Eurobarometer 76: Public Opinion in the European Union. First Results. Standard Eurobarometer 76/Autum 2011. TNS Opinion & Social.
http://ec.europa.eu/public_opinion/index_en_htm
[29] European Commission (2012) Rural Development in the European Union. Statistical and Economic Information. Report 2012, European Union.
Submit or recommend next manuscript to OALib Journal and we will provide best service for you:
Publication frequency: Monthly
9 subject areas of science, technology and medicine Fair and rigorous peer-review system
Fast publication process
Article promotion in various social networking sites (LinkedIn, Facebook, Twitter, etc.) Maximum dissemination of your research work
Submit Your Paper Online: Click Here to Submit