SAPIENZA
University of Rome
Department of Biology and Biotechnology “Charles Darwin”
Reverse Engineering of Natural Systems by Graph Theory
Daniele Capocefalo XXXI cycle
PhD PROGRAMME IN LIFE SCIENCES
Supervisor Marco Tripodi
Tutor Coordinator
Director of PhD program: Prof. Marco Tripodi
Department of Cellular Biotechnology and Hematology, “Sapienza” University, Rome
Scientific Supervisors: Prof. Marco Tripodi
Department of Cellular Biotechnology and Hematology, “Sapienza” University, Rome
Scientific Tutor: Dr. Tommaso Mazza Bioinformatics Unit,
To Eva and Amelia. Always Forward.
Table of Contents
TABLE OF CONTENTS ... 8 SUMMARY ... 1 INTRODUCTION ... 3 SYSTEMS BIOLOGY ... 3 NETWORK BIOLOGY ... 10NETWORK INFERENCE METHODS ... 13
RESULTS ... 17
AIM OF THE WORK ... 17
NETWORK ANALYSIS REVEALS RNA-RNA CROSSTALK AND HIGHLIGHTS THE ROLE OF MICRO RNA-SOCIETIES IN HUMAN COLORECTAL CANCER ... 19
1. Background ... 19
2. Inferring Gene-Regulatory networks from enriched biological processes ... 25
3. Functional modules in literature-based and experimental miRNA networks ... 28
4. The leading topological position of miRNA-145 is fundamental for the upholding of cohesiveness and functional cooperation among modules ... 38
5. Measuring the effect of the induced expression of miR-145 in CRC cell lines ... 41
6. MAPK signaling pathway is modulated by miR-145 ectopic expression in CRC cell lines... 42
7. Conclusions ... 45
PYNTACLE: A TOOL FOR THE ASSESSMENT OF CRITICAL PROPERTIES OF NETWORKS ... 49
1. Background ... 49
2. Pyntacle functionalities ... 53
3. Pyntacle benchmarks and performance comparisons ... 62
4. The future of Pyntacle ... 65
THE NESTEDNESS OF FOOD-WEBS ... 69
1. Background ... 69
2. Food Webs network analysis ... 73
3. Key player and nestedness analyses reveal common features in food webs ... 76
4. Conclusions ... 84
CHARACTERIZATION OF SEX-SPECIFIC MECHANISMS OF AGING IN CORRELATION NETWORKS OF ADULT DROSOPHILA MELANOGASTER ... 87
1. Background ... 87
2. Co-Expression analysis of sex-specific transcriptomes reveals different co-expression module hubs ... 91
3. Network analysis of consensus overlap reveals common key-players in male and female co-expression modules in Drosophila ... 97
4. Conclusions ... 103
DISCUSSION ... 107
MATERIALS AND METHODS ... 113
NETWORK ANALYSIS REVEALS RNA-RNA CROSSTALK AND HIGHLIGHTS THE ROLE OF SOCIETIES OF MICRORNAS IN HUMAN COLORECTAL CANCER ... 113
1. Data sources ... 113
2. Statistical analyses ... 113
3. Gene selection strategy and in silico functional and pathway analyses ... 114
4. MiRNA selection strategy ... 115
5. Networks construction ... 116
6. Topological network analysis ... 117
7. Strongly connected components ... 118
8. MiRNAome and MAPK signaling pathway profiling after miR-145 transfection in CRC cell lines ... 118
PYNTACLE ... 121
1. Technical specifications ... 122
2. Availability, installation, and testing ... 124
3. Shortest Path search strategies ... 125
4. Canonical and non-canonical centrality indices ... 127
5. Group-centrality and key-player metrics ... 135
6. Key player search optimizations ... 140
7. Ancillary operations ... 143
8. Supported network file formats ... 145
9. Benchmarks data ... 148
10. Benchmarks specifications ... 150
THE NESTEDNESS OF FOOD-WEBS ... 153
1. Food webs ... 153
2. Network analysis ... 154
4. Nestedness ... 155
CHARACTERIZATION OF SEX-SPECIFIC MECHANISMS OF AGING IN CORRELATION NETWORKS OF ADULT DROSOPHILA MELANOGASTER ... 157
1. RNA-Seq data availability and processing ... 157
2. Sex-specific co-expression network analysis and module eigengenes detection ... 157
3. Paired consensus analysis of module eigengenes of male and female flies... 160
4. Network analysis of overlapping genes among consensus and sex-specific modules ... 161
REFERENCES ... 163
ACKNOWLEDGEMENTS ... 185
APPENDIX - EXCERPT OF PYNTACLE SITE MATERIAL ... 187
QUICK STARTUP GUIDE ... 187
1. Setting Pyntacle for the first use ... 187
2. Dataset description... 188
3. Command line Startup Guide ... 190
4. Pyntacle library startup guide ... 201
MINIMUM GRAPH REQUIREMENTS ... 211
1
Summary
With the advent of high-throughput technology, Biological research widened its horizons in terms of biomarkers and mechanisms of action of several diseases and phenotypes. On the other hand, complex diseases, like diabetes, several neurodegenerative pathologies and cancer, are still orphan of a cause and then of a cure. One of the possible reasons is that these are not strictly monogenic diseases since they result from a global interplay between molecular players and master regulators. In this context, where “the whole is something over and above its parts and not just the sum of them all” (Aristotle 384-322 B.C.), is clear that the Cartesian reductionism cannot completely help understand how a disease arises and develops.
Systems Biology comes on the stage here and puts emphasis on whole behavior as being basically indivisible. It sustains the Smuts’s holistic theory according to which whole systems such as cells, tissues, organisms, and populations were proposed to have unique
emergent properties and that it was impossible to reassemble the behavior of the whole
from the properties of the individual components. Hence, new technologies were necessary to define and understand the behavior of systems.
New mathematical models and computational approaches emerged in the past decades. Thereby taking inspiration from the theory of graphs. Aspects of nature that could be explained by the interaction of individual agents were modeled as networks and their properties studied topologically. Speculations on the global structure of biological systems were based on two important assertions: systems have a hierarchical structure,
2
and the structure is held together by numerous linkages to construct very complex networks.
In this work, we retrace this path by first reconstructing and studying a complex molecular system made by gene and microRNA expression profiles in patients affected by colorectal cancer. We show how the study of topological properties of the system helped identifying a tiny subnetwork of master-regulator and effectors that, individually, were associated to poor survival rates when extremely expressed. Group-effects were not captured, until the development of Pyntacle, a cross-platform and open source Python suite of high-performance computing algorithms for the discovery of key-players in networks. Pyntacle is introduced and presented in this work and then used proficiently in two other case studies. The former regards ecological food webs and reports on the assessment of their nestedness property, which is an indicator of their global robustness and redundancy. The latter is an exploration of the relationships between sex and ageing process in Drosophila melanogaster, which developed into two computational steps: definition of co-expressing modules of genes and identification of sex independent key-players molecules in male and female flies.
3
Introduction
Systems Biology
The 19th century focused on two important concepts that originate already in the 17th century. The former is based on the Cartesian notion of complexity according to which a system can be reduced to pieces that can be more easily managed individually and, then, reassembled to deduce the whole behavior. The theory of Reductionism was strongly influenced by the Newton’s success in mathematically describing planetary movements and characterizing gravity, and resisted till the present days, where, for example, plant biology grounds on the simple assumption that higher levels in a biological hierarchy can easily be understood from the behavior of the lower levels.
Reaction against this reductionist attitude began among a few biologists (Von Bertalanffy, 1950; Smuts and Holst, 1926) in the early part of the 20th century. They spoke a new language of life in which complexity, organization, orchestration, holism,
interconnectedness, and evolution became more dominant terms. Their objections to
reductionism were twofold. First, it was apparent from simple investigations on the brain and animal development that the structure of an entire system actually constrained the behavior of the component parts. Reductionist mechanistic investigations would miss the vital element of orchestration. Second, many scientists were still bound to the much older Aristotelian view of the natural phenomena, according to which “the whole is something over and above its parts and not just the sum of them all” (Aristotle 384-322 B.C.). This theory dominated science up to the 17th century. It was then abandoned with the
4
Smuts (1870–1950), naturalist, philosopher and twice Prime Minister of South Africa. He coined the commonly used term holism. Whole systems such as cells, tissues, organisms, and populations were proposed to have unique emergent properties (Trewavas, 2006) and it was impossible to reassemble the behavior of the whole from the properties of the individual components. New technologies were hence required to define and understand the biological systems.
The technological response did not take long to arrive. The new microarray chips and
high-throughput sequencing platforms were used to massively profile the Human
Genome in the early 2000s (Venter et al., 2001), and hundreds of thousands of other genomes in the coming years by means of increasingly more efficient Next-Generation Sequencing (NGS) platforms. These new laboratory techniques allowed to dissect and study the individual “components” of cells, tissues, and organisms with high resolution and specificity, thereby opening new scientific horizons on all the omics layers (Levy and Myers, 2016).
The term ‘omics’ refers to any technique that enables the massive analysis of entire catalogues of molecular reservoirs, such as, for example, the whole genome sequencing (genomics), the overall expression levels of the mRNA species (transcriptomics), or the quantification of the abundance of mature protein products within a cell (proteomics). Probably the most famous example of use of NGS techniques on multi-omics layers is
The Cancer Genome Atlas (TCGA) (Tomczak et al., 2015). This project, started in 2006
as a joint initiative by the National Cancer Institute (NCI) and the National Human Genome Research Institute (NHGRI) and was the first global attempt to characterize and unravel the genomic and molecular landscapes of a few cancers. It later expanded on
5
many other cancer types and included several other institutions that, together, collaborated to produce genomic data for more than 11,000 patients across 33 tumor types. For each tumor type, information on single nucleotide variations (SNV), copy number variations (CNV), gene and microRNA expression profiles, and methylation profiles were made available together with clinical, treatment and follow-up information for most subjects.
While the TCGA is a clear example of Reductionism, the consequent Pan-Cancer Atlas, which issued from the TCGA, is a notable example of holism. The Pan-Cancer Atlas provides, in fact, a uniquely comprehensive, in-depth, and interconnected understanding of how, where, and why tumors arise in humans (Hoadley et al., 2018). This is a contingent example of how reductionism and holism can be reconciled, although being often posed in opposition to each other. There is a need to understand how organisms are put together (reductionism) just as in turn there is a need to understand why they are put together in the way that they are (systems; holism). Systems Biology is an attempt to explain this embedded complexity.
Although Systems Biology did not stem from Molecular Biology, but originated from the convergence of thermodynamics and chemical kinetics (Westerhoff and Palsson, 2004), it is widely recognized that the omics revolution widely contributed to its spreading and popularity. Being Systems Biology an interdisciplinary field that has its roots in the theorization of a mathematical model behind observational data to infer the properties of the system, its knowledge base can be applied to a plethora of disciplines, from Ecology (Purdy et al., 2010) to drug design (Cho et al., 2006). Its widespread use and the variety of its forms make difficult, even for researchers in the field, to give a unanimous
6
definition of Systems Biology. However, besides all point of views, being them methodological (Breitling, 2010), technical (Kitano, 2002; Potters, 2010) or philosophical (Boogerd et al., 2007), all agree on the fundamental concept that Systems Biology is not a mere collection of biological entities and their measurements, but of the relationships among them, that, if known, can be used to build a computational model of the system of interest. Such structure is generally named network.
A network, often referred to as graph, is a mathematical system made by nodes, the entities that populates the system, and edges, the interactions that occur between nodes. The level of abstraction used with real world systems makes networks the model of choice in a variety of fields other than Biology, from Information Theory to Social Sciences. For example, a network might be made by all the web pages of the World Wide Web (WWW), the nodes being pages and the edges being hyperlinks among them. A kind of network like this is used by the Google search engine to traverse all web pages of the WWW and to rank and identify the ones that are important in terms of the number of hyperlinks that points to them (Page et al., 1998). Recently, studies on the dynamics of social networks became popular because they attempted to explain complex social events and to capture the spreading of information across communities of people united by common beliefs. These communities, known as tribes or echo chambers (Del Vicario et al., 2016) spread news about their topics of interest much faster than people who do not belong to them can do, and often reinforce their convictions, turning people with moderate beliefs into one with more extreme views on the subject, a phenomenon often called polarization (Del Vicario et al., 2017).
7
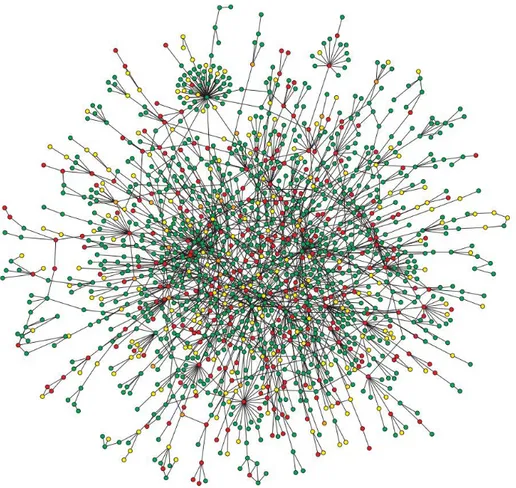
Nowadays, networks are used ubiquitously in Systems Biology. They mainly differ for assortment and completeness of information. In fact, most biological networks focus on and depict only a portion of a natural phenomenon. This is the main reason why several kinds of biological networks exist: protein–protein interaction (PPI) networks, gene regulatory networks (DNA–protein interaction networks), signaling networks, gene co-expression networks (transcript–transcript association networks), metabolic networks, neuronal networks, food webs, between-species interaction networks and within-species interaction networks. The p53 transcription factor of Homo sapiens is an example of PPI network (Figure 1A) that particularly focuses only on the proteins that physically interact with the human p53 transcription factor. All these kinds of networks may also be composed by heterogeneous nodes, namely by nodes representing different kinds of molecules (e.g., enzymes, genes, miRNAs). Signaling networks, also known as pathways, are notoriously heterogeneous networks, since they represent not only the different types of interactions among protein products, but the whole cellular signaling cascades and their actors, which enable them to function. The p53 pathway (available from the KEGG database (Kanehisa and Goto, 2000), Figure 1B) adds to its PPI interaction network available from the STRING web service (Szklarczyk et al., 2015) information on the nature of the interactions among protein products, feedbacks loops of activation and inhibition, types of molecules represented by nodes (i.e., genes, enzymes, substrates) and on the processes that are activated downstream.
Irrespective of the inner semantics of networks, Systems Biology developed a big area of research aimed at characterizing the architectural structure of networks, irrespective of whether they were molecular or social. Several evidences support indeed the existence of a global hierarchy and, then, that the network organization is not the fruit of chance, but
8
of the emergent need to protect important properties of networks, like the robustness, which hold when the topology of their nodes and edges is preserved. A system is robust when it resists to any kind of interference in the structures of nodes and edges, thus still retaining most of its key functions (Csete and Doyle, 2002). The bacterial chemotaxis process is a notable example. E. coli has been proven to exhibit strong variations in enzymes concentration and time to adapt in response to chemotaxis stimuli (Alon et al., 1999), still responding precisely to exogenous stimuli. This area of research is named
10
Figure 1: A) the interaction network of the TP53 human transcription factor and its closest neighbors as reported by the latest version of the STRING database (accessed Sept. 2018). B) the pathway of TP53 as reported by KEGG is itself a direct network in which coding genes, protein product and transcription factors are linked not only on the base of interactions, but by activation, inhibition, phosphorylation and other stimuli. A pathway is indeed a network, and each link may correspond to a class of edges that compose it.
Network Biology
Understanding the topology of networks is the main purpose of Network Biology. Mathematically speaking, networks are actually graphs, which collect points and lines connecting some (possibly all) nodes. The points of a graph are most commonly known as graph vertices, but they may also be called “nodes” or “points”. Similarly, the lines are most commonly known as edges, even if they may also be called “arcs” or “lines”. The vertices belonging to an edge are called the ends or end vertices of the edge. The edges may either connect one vertex to another or a vertex to itself. In the second case, they form self-loops. It is then possible that a vertex is not connected with any other vertex. In this case it is called isolated node.
Different kinds of graphs exist. When the orientation of the edges matters, the graph is called directed. In the opposite case, it is called undirected. One important class of graphs consists of those that do not have self-loops or parallel edges. Such graphs are called
simple. In a simple graph, no two edges share the same ends, then the specification of
two ends is sufficient to identify an edge. A simple graph G can be defined as the ensemble of (V, E), where V is a set of vertices and E is a set of edges. Hence, E = {(i, j)
11
| i, j ∈ V} and (i, j) is equals to (j, i) in undirected graphs. If two vertices are adjacent to each other, namely they are linked by one edge, they are called neighbors. When instead multiple edges join the same pair of nodes, the graph is said multigraph. In such case, each connection indicates a different type of information. This is an important feature since there are networks such as PPI networks in which two proteins might be evolutionary related, co-occur in the literature or co-express in some experiments, resulting by this way in three different connections, each one with a different meaning and representing a different layer of information. If a graph contains multiple edges and self-loops it is called pseudograph.
Molecular pathways are notable examples of directed graphs (Figure 1B) since their edges describe the subjects and the objects of the interactions. Undirected graphs were extensively used to represent many other natural systems, from ecological, to population dynamics and molecular systems. In particular, PPI networks are actually undirected graphs (or multigraphs), since edges often represent a kind of relationship of which both the connected nodes are equally subjects and objects. Irrespective of the direction of edges, a graph can be weighted or unweighted, depending on the availability of numerical attributes of edges (Figure 2).
A graph may be comprised of several connected components and isolates. In this case, the graph is a supergraph made by two or more subgraphs. The bigger subgraph is the
largest connected component.
As the only relevant factor that shapes a Graph is represented by the links among nodes, the aesthetics of the graph does not matter as long as the links are not rewired. For example, it does not matter whether the edges drawn are straight or curved. Edges
12
(sometimes referred to as links) can connect nodes in any way possible or curved, or whether one node is to the left or right of another.
Figure 2: Different types of graphs. (Left) undirected graphs, where no orientation of edges is specified; (center) directed graphs, where edges have directions; (right) weighted graphs, where links are accompanied by numerical values indicating a sort of strength factor.
13
Network inference methods
Several methods exist to build biological networks. These are mainly divided into two classes according to whether they take information from literature or public databases (literature-based methods) or straight from experimental data (experimental-based methods).
The former class makes use of highly curated sources of molecular interactions, like for example STRING and BioGRID. STRING is a database of known and predicted protein-protein interactions that contains 9.643.763 protein-proteins from 2.031 organisms (Szklarczyk et al., 2015). The interactions include direct (physical) and indirect (functional) associations; they stem from computational prediction, from knowledge transfer between organisms, and from interactions aggregated from other (primary) databases. Interactions are derived from five main sources: genomic context predictions; high-throughput lab experiments, (conserved) co-expression, automated text-mining and previous knowledge in databases. Similarly, the Biological General Repository for Interaction Datasets (BioGRID) is a public database that archives genetic and protein interaction data from model organisms and humans (Chatr-aryamontri et al., 2017). It currently holds over 1,400,000 interactions curated from both high-throughput datasets and individual focused studies, as derived from over 57,000 publications in the primary literature. Current curation drives are focused on particular areas of biology to enable insights into conserved networks and pathways that are relevant to human health. A known tool using these and other similar databases is, for example, GeneMANIA (Mostafavi et al., 2008). It finds other genes that are related to a set of input genes, using a very large set of functional association data. Association data include protein and genetic interactions,
14
pathways, co-expression, co-localization and protein domain similarity. The resulting network will be a multigraph made by as many nodes as the input genes plus the number of found interacting genes, and as many edges as the total number of literature hits. We still miss, however, detailed database that store interaction among non-coding genes, or non-coding-coding relationships, such as the relationships among small non-coding RNAs, such as miRNA and their target genes. In this regulatory network, links are drawn if a miRNA has a direct effect on a gene ectopic expression. Although these networks proved useful in the characterization of the regulatory network of several diseases (Jiang et al., 2012; Yang et al., 2017; Ye et al., 2018), and some tools were developed to use network analysis techniques to provide insights on the role of non-coding-RNAs and their coding counterparts (da Silveira et al., 2018), there is plenty of room for improvement.
The latter class is made by slightly more complex methods that infer interactions from experimental data. Gene expression data are used to deduce gene co-expression. Co-expressing genes are linked by edges in a network which, in turn, are eventually weighted by the statistics used to assess the co-expression. Researchers trained in statistics often measure gene co-expression by the correlation coefficient. Computer scientists, trained in information theory, tend to use a mutual information (MI) based measure. Thus far, the majority of published articles use the correlation coefficient as co-expression measure (Zhang and Horvath, 2005; Zhou et al., 2002), but hundreds of articles have used the mutual information (MI) measure with notable results, showing that the contribution of
15
these two means to assess gene-to-gene relationships are equivalent (Daub et al., 2004; Priness et al., 2007; Song et al., 2012). Several articles have used simulations and real data to compare the two co-expression measures when clustering gene expression data. Allen et al. have found that correlation based network inference method WGCNA (Langfelder and Horvath, 2008) and mutual information based method ARACNE (Margolin et al., 2006) both perform well in constructing global network structure (Allen et al., 2012). Steuer et al. show that mutual information and the Pearson correlation have an almost one-to-one correspondence when measuring gene pairwise relationships within their investigated data set, justifying the application of Pearson correlation as a measure of similarity for gene-expression measurements (Steuer et al., 2002). In simulations, no evidence could be found that mutual information performs better than correlation for constructing co-expression networks (Lindlöf and Lubovac, 2005). However, MI continues to be used in recent publications. Some authors have argued that MI is more robust than Pearson correlation in terms of distinguishing various clustering solutions (Priness et al., 2007). On the other hand, although MI is well defined for discrete or categorical variables, it is non-trivial to estimate the mutual information between quantitative variables, and corresponding permutation tests can be computationally intensive. In contrast, the correlation coefficient and other model-based association measures are ideally suited for relating quantitative variables. At last, it must be noted that the majority of network inference methods was built using microarray as main source of expression and questions. Co-expression analysis based on RNA-Seq data is still in its primes and thus many of these techniques are forwarded from one experimental setting
16
to another. This may lead to incorrect results, as the two techniques are overlapping, but have different source of noise that, if not addressed carefully, may undermine the connections in a co-expression of MI network. Appropriate evaluations of the factors that may affect functional connectivity and topology in co-expression network is thus a main concern within the network biology community. For this purpose, a detailed evaluation of all the methods used in co-expression analysis was performed and revealed that the simpler the measure of distance, the highest is the reliability of co-expression network (Ballouz et al., 2015). On this regard, the size and the depth of the samples are more important than the normalizing procedures each method apply for noise reduction.
17
Results
Aim of the Work
The use of network models in Systems Biology is not just a nuance within the broad landscape of bioinformatics approaches, but it is the backbone, which they rely on, to uncover system-wide relationships among molecules. Network-based methods exploit solid mathematical tools to identify molecules that play critical roles in pathophysiological cellular processes, to unravel the complexity of natural systems, their structure, i,e. their topology, and to reveal the presence and the interplay of subgroups of nodes (communities). This work aims at presenting and using a broad set of graph-based algorithms and tools in several contexts, proving the usefulness of biological network analysis as a framework on which to rephrase biological questions.
First, we reviewed and used the standard methods used in the Network Biology community to describe the architecture of the colorectal cancer molecular network formed by coding and non-coding genes. We studied and assessed the role of some small non-coding RNAs, the microRNAs, on the protein-protein interaction network made by the deregulated genes in colorectal cancer and found the communities of miRNAs that, together, contributed to the carcinogenesis. Moreover, by studying the indirect and long-range relationships among molecules, we assessed the role of miR-145 as a master regulator of the population of all miRNAs. This showed that the miRNAs network is hierarchically organized.
Second, we applied the same topological indices to a set of ecological networks plus some new metrics that accounted not only for the centrality of individual molecules but also
18
for that of groups of nodes. Group centrality metrics were developed in other scientific contexts and were extensively used in Ecology to search and find the species that, together, are responsible for an ecosystem development and maintenance. These group centrality metrics are almost unknown in the Network Ecology community. In fact, the existing software tools in this area of research still lack the ability to determine the
team-play effects in networks.
For this reason, using Python dynamic programming, we developed Pyntacle, a swiss knife tool for network analysis that exploits many of the current standard analysis methods to find key-players. Key-players are groups of nodes that appear to be determinant for the fragmentation or the reachability of the network boundaries. We compared Pyntacle to the only other existing software tool that performs group centrality analysis and found that it outperforms the competitor R package by several orders of magnitude, with a gap in performance that increases with the network sizes.
We thus tested Pyntacle with real ecological networks. In particular, we have characterized the topological structures of 27 food-webs, belonging to terrestrial ecosystems, and identified a nested structure within them. Then, we resorted to Molecular Biology and used Pyntacle to identify critical groups of molecules that, together, may contribute to the sex-specific aging phenotype in Drosophila melanogaster.
19
Network analysis reveals RNA-RNA crosstalk and highlights the role of
microRNA-societies in human colorectal cancer
1. Background
Network analysis has particularly impacted on Biology in the understanding of the mechanisms that underlie the onset and progression of cancer whenever it dealt with
high-throughput data. Cancer is a multifaceted disease that causes a dramatic reshaping of the
cellular molecular processes. This phenomenon is specific for each cancer type and individuals, although molecular hallmarks can be largely found in the literature (Fouad and Aanei, 2017; Hanahan and Weinberg, 2000). The reason why many cancer subtypes exhibit a low survival, coupled with the difficulty of treating two tumors of the very same nature can be ascribed, at least in part, in its irregular cellular heterogeneity, which makes diverse subpopulations of tumor cells in every individual with distinct characters (molecular signatures). The obvious consequence is that it is quite complicated to trace-back the time and the causative event (the point of origin or the cellular Big Bang (Sottoriva et al., 2015)) which the tumor originated from. What makes things worse is that cellular heterogeneity impacts significantly also in the efficacy of the response to therapies (Fisher et al., 2014), since cells may be less susceptible to some drugs than others (Dagogo-Jack and Shaw, 2017). These points have encouraged the development of a new area of research: precision medicine (Drew, 2016; Hodson, 2016). The underlying concept of precision medicine is that health care is individually tailored on the basis of a person's genes, lifestyle and environment. Although this concept was not new, advances in genetics, the growing availability of health data and progress in the
20
omics, is now presenting an opportunity to make precise personalized patient care a
clinical reality.
Network Biology is a keystone of personalized medicine techniques, since it bridges all the omics and their data and helps to determine the so-called “master regulators” (Kin Chan, 2013). Master regulators are pivotal molecules, which are not necessarily tightly connected with other molecules, but which plays critical roles in sustaining cancer and its deadly mechanisms. Since they are supposed to be the closest molecules to the point
of origin of a tumor, several attempts were made to discover them in different cancers.
Colorectal cancer (CRC), also known as bowel cancer and colon cancer, is the development of cancer from the colon or rectum (parts of the large intestine). CRC that are confined within the wall of the colon may be curable with surgery, while cancer that has spread widely are usually not curable, with management being directed towards improving quality of life and symptoms. According to the 2014 World Cancer Report, the five-year survival rate in the United States is around 65%. The individual likelihood of survival depends on how advanced the cancer is, whether or not all the cancer can be removed with surgery and the person's overall health. Globally, colorectal cancer is the third most common type of cancer, making up about 10% of all cases. In 2012, there were 1.4 million new cases and 694,000 deaths from the disease. It is more common in developed countries, where more than 65% of cases are found (Stewart and Wild, 2014). It is less common in women than men.
In the context of CRC, we studied the transcriptomic regulation of messenger RNA mediated by micro-RNAs (miRNAs), a class of a small non-coding RNA molecules that are involved in the post-transcriptional regulation of RNA transcripts, by base-pairing to
21
partially complementary sites on the target messenger RNAs (mRNAs), usually in the 3-untranslated region (3 UTR). Each miRNA has the potential to target many genes, with many miRNAs able to synergistically regulate the same mRNA transcript (Huntzinger and Izaurralde, 2011; Kim and Nam, 2006). The alterations in the population of non-coding transcripts may play important roles in cancer pathogenesis. Numerous miRNA encoding genes are frequently located at fragile genomic sites or within regions frequently deleted or amplified in neoplastic diseases (Calin et al., 2004). The accumulation of alteration in the miRNA population, with processes such as deletion, mutation or methylation of miRNA-encoding genes may cause deregulated expression of critical miRNAs, which can then act as oncomiRs or tumor suppressors (Calore et al., 2013).
In colorectal cancer, the main hallmark of carcinogenesis is the accumulation of genetic alterations in oncogenes and tumor suppressor genes, which control crucial cellular processes such as proliferation, differentiation and apoptosis in the colorectal epithelium (Markowitz and Bertagnolli, 2009). The first group of genetic alterations includes inducers of chromosomal instability, which is driven by amplifications/deletions of whole or subsections of chromosomes that can underlie both the progressive inactivation of tumor suppressor genes, such as adenomatous polyposis coli (APC), deleted in colorectal cancer SMAD4 and TP53, and the activation of oncogenes such as KRAS (Cunningham et al., 2010; Tarafa et al., 2000). The second group of genetic alterations induces microsatellite instability (MSI), which is associated with mutations in genes containing simple repeats, such as those encoding the epidermal growth factor receptor (EGFR), the apoptotic factor BCL2-associated X protein (BAX) and the transforming growth factor β receptor II (TGFBR2). MSI results in the inactivation of genes belonging to the DNA
22
mismatch repair family (Jensen et al., 2009; Wright et al., 2005). These two genetic alterations rarely occur together in the same colorectal cancer specimen (Gervaz et al., 2002)and have a different impact on survival, with MSI showing an improved prognosis compared to chromosomal instability (Boland and Goel, 2010a; Saridaki et al., 2014). The third group of genetic alterations includes epigenetic alterations, which together make the so said CpG island methylator phenotype (CIMP). CIMP is characterized by epigenetic instability and by high methylation levels of the promoters of some tumor suppressor genes, such as the Cyclin-Dependent Kinase Inhibitor 2A (CDKN2/p16), insulin-like growth factor 2 (IGF2) and MLH1 (Pritchard and Grady, 2011).
All these events impact several key-signalling pathways that are commonly deregulated in carcinogenesis, including WNT-β-catenin, EGFR, mitogen-activated protein kinase(MAPK), TGF- β and phosphatidylinositol 3-kinase (PI3K). Alterations in the WNT-β-catenin pathway are responsible for many epithelial tumors, being involved in approximately 30–70% of human sporadic colorectal cancers (CRCs). Mutations in the APC gene, affecting the carboxy-terminal region, are implicated in β-Catenin and axin binding, leading to the deregulated nuclear translocation of the β-catenin transcription factor from the cytoplasm (Polakis, 2000). This induces the genesis of a tumor phenotype by enhancing the transcription of several oncogenes and target genes, such as MYC and
CCND1 (Kobayashi et al., 2000). Sporadic CRCs, negative for APC or CTNNB1 gene
mutations, are characterized by activation of the WNT signaling pathway via APC inhibition by miR-135, which, in turn, is upregulated in CRC, or by direct modulation of β-catenin by miR-200a, which alternatively interacts with the 3’ UTR of CTNNB1 or drives the down-regulation of the ZEB1/2 gene (Huang et al., 2010). EGFR is an important player in colorectal carcinogenesis, being a modulator of critical cellular
23
processes such as proliferation, adhesion and migration. The EGFR intracellular signal transduction pathways include components of the MAPK, PI3K, signal transducer and activator of transcription, protein kinase C and phospholipase D pathways. In particular, the MAPK pathway modulates numerous key kinases, which, in turn, control cell growth, differentiation, proliferation, apoptosis and migration through a series of intermediate proteins, including RAF, MEK and RAS (Dhillon et al., 2007). The latter is a critical gene since it can unleash its signalling cascade either by PI3K, thereby inhibiting apoptosis, or by RAF, thereby stimulating cellular proliferation. The anomalous activation of the receptor tyrosine kinases or the gain-of-function mutations occurring in the RAS or RAF genes are reported to cause the deregulation of the RAS-RAF-MEK-ERK-MAPK axis, which, in turn, is a frequent therapeutic target (Phipps et al., 2013; Roberts and Der, 2007; Santarpia et al., 2012). Interestingly, the down-regulation of miR143 was shown to contribute to ERK/MAPK activation, as well as to KRAS and ERK5 repression (Akao et al., 2007).
The onset and progression of colorectal cancer are linked to a combination of causal perturbations occurring at any omics layer (Muzny et al., 2012) and relevant studies have brought out the anomalous interactions between gene transcripts and miRNA molecules as crucial causes of carcinogenesis (Caldas and Brenton, 2005; Hecker et al., 2013; Mezlini et al., 2013; Piepoli et al., 2012). Bearing these findings, we sought to define the mRNA–miRNA cross-talks in search of mutual and combined effects on the colorectal carcinogenesis process by means of computational and analytical methods from Systems Biology, in particular using network analysis techniques, to inspect both transcriptome layers and their interactions, and to look for socially central (groups of) molecules. We
24
addressed this issue by a multifaceted analysis strategy, encompassing a series of functional enrichment, topological and clustering analyses, which were conducted on genome-wide mRNA and miRNA expression profiles of matched pairs of tumor and adjacent non-tumorous mucosa samples obtained from CRC patients. In-silico analyses highlighted the prominent topological position of miRNA-145 and its mechanistic role in maintaining cohesiveness and functional cooperation among groups of key miRNAs and genes. Given the critical tumor suppressive role of miR145, its action, combined with several other miRs, was deemed responsible for a coordinated program of patterned gene regulation, whose master regulator was miR-145. The discovery of its partners and of the unexplored effects of their interactions in colorectal carcinogenesis was, therefore, a further objective of this work. This was achieved by first identifying in- silico the co-expressing partners of miR-145, and then, by perturbing them in vitro in four CRC cell lines. We verified that the ectopic expression of miR-145 impacts the whole miRNA network and that, downstream, this perturbs the MAPK signalling cascade.
25
2. Inferring Gene-Regulatory networks from enriched biological processes
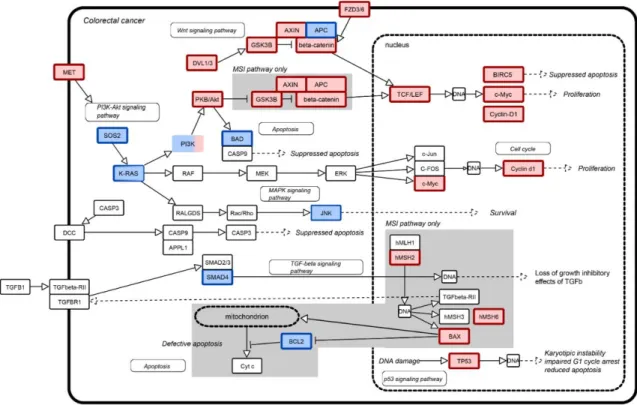
Differential expression analysis of CRC stage IV tumor tissues at versus their matched adjacent non-tumorous tissues defined a total of 4.441 genes significantly deregulated between matched tumor and (2.549 up-regulated and 1.892 down-regulated in the CRC specimens), of which 1.645 and 878, respectively, maintained the same expression direction in at least five experiments deposited in the EBI Gene Expression ATLAS (Kapushesky et al., 2012). To confirm these findings, we verified that the CRC pathway (hsa05210 KEGG pathway, in Figure 3) was significantly impacted. Twenty-eight out of 45 genes of this pathway were deregulated in a statistically significant way (p =1.32e-10). These genes are known to functionally participate in four macro biological processes (BPs): proliferation, (anti)-apoptosis, growth and cell cycle control.
This list of genes was used to perform the gene enrichment functional analysis. 2091 genes, 83% of the whole gene pool was found to be significantly associated to these BPs with respect to the 9089 genes, that accounted for 52.1% of the background set of genes, known to carry out these processes (p < 0.0001). By confronting the log-Odds ratios, the classes of BPs were classified as favourable (adjusted p =0.016) and
cancer-protection. This classification was done on their positive or negative association to
colorectal carcinogenesis and in general to cancer-related processes (adjusted p < 0.001). Specifically, cancer-favourable processes included 48 genes hampering apoptosis, 23 genes promoting cell cycle progression, 92 genes increasing proliferation and 9 genes promoting cell growth. Cancer-protection genes encompassed 106 apoptosis-favourable genes, 53 genes promoting cell cycle control, 95 genes hindering proliferation and 24
26
Figure 3: The landscape of the genes involved in CRC onset. Up-regulated genes (in red) and down-regulated genes (in blue) of the CRC pathway (KEGG id: hsa05210). TFC7 and LEF1 symbols are encompassed in TCF/LEF, while PI3K includes PIK3R2, PIK3CG PIK3C.
genes decreasing cell growth. The remaining genes fell in the cancer-related set of BPs, 158 of which were apoptosis-associated, 105 involved in cell cycle regulation, 199 were proliferation modulators and 42 were related to cell growth. 391 genes were selected on the bases of these findings and were submitted to the GeneMania (Mostafavi et al., 2008) Cytoscape plugin, to reconstruct the interaction map among these genes. Genes were connected among them if at least one verified experimental interaction was stored in the
27
GeneMania database. As GeneMania also stores information from other sources, the resulting link in the interaction network were enriched by means of relationships of co-expression (52.65% of the total number of relationships), co-localization (14.85%), physical interactions (13.52%), shared pathways (9.06%), shared predicted interactions (8.44%), shared genetic interactions (1.23%) and shared protein domains (0.26%). The network is hence a multigraph since it allows more than one edge connecting two nodes. As the information in this multigraph was redundant, and in order to process the network for further analysis, the network was reduced to a simple graph, as described in the Materials and Methods chapter, section 1.5.
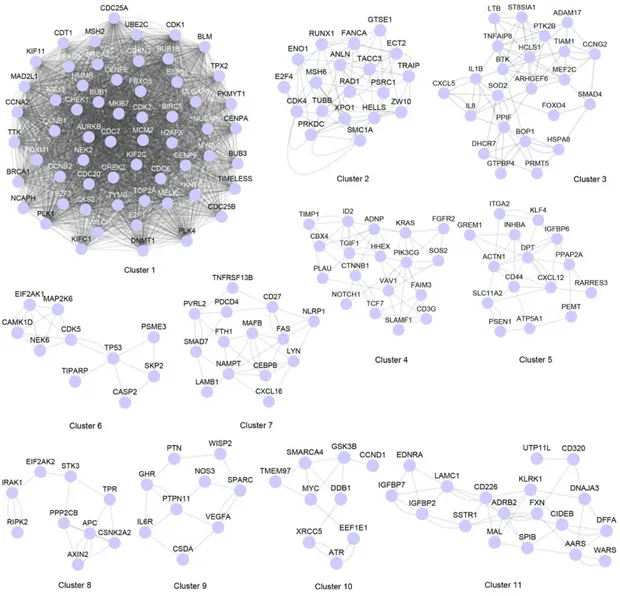
The resulting network is made of one connected component with relative complexity. The global properties of this component, when measured, yielded clustering coefficient = 0.257, diameter = 4 and network density = 0.095. Network density ranges from 0 to 1, and measures how densely a network is populated with edges (so the ratio between the total number of edges in a network and the number of nodes in the network). A network with no edges and solely isolated nodes has a density equal to 0. This network was divided using the clusterONE algorithm (Nepusz et al., 2012), with default parameters. The tool performs modular decomposition searching for communities (i.e., groups of nodes) in the network, identifying 11 distinct communities in the overall interaction network (Figure 4). This procedure identified 11 modules, classified and divided into two
cancer-protection and nine cancer-favourable modules, according to the BPs of the genes
that populate them, and as to whether their genes are up-regulated or down-regulated. Among the most central genes, also known as intramodular hubs TP53 (module 6), MYC (module 10), CDK4 (module 2), CTNNB1 (module 4), CHEK1 and CDK2 (module 1) were found to be the top six genes, in terms of centrality measures, for at least three out
28
of the four centrality metrics (degree, closeness, betweenness, clustering coefficient), hence confirming their central role in the network. Intramodular hubs link to several proteins that are highly self-connected and that are, therefore, more likely to perform any biological task in cooperation (Liang and Li, 2007). Such hubs are almost never pleiotropic, meaning they do not take part in other functions other than the ones reported for each one.
3. Functional modules in literature-based and experimental miRNA networks
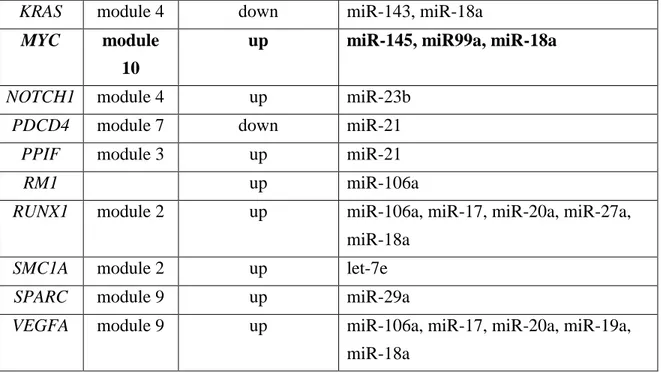
To uncover the miRNAs regulatory network for the genes responsible for the CRC development for the transcriptional regulation of genes responsible for the CRC, the 391 genes were screened against the Human Molecular Disease Database (Li et al., 2014) and only those known to be associated to CRC were selected. The miRNAs that directly target these genes were retrieved through to the miRSystem online resource (Lu et al., 2012). The miRNA-target list is reported in Table 1. Selected miRNAs are given in input to the Ingenuity Pathway Analysis Software (IPA) to recreate a literature-based network for 19 of these miRNAs, altogether with the genes controlled by them (Figure 5A). Links were drawn if the physical interaction between miRNAs and genes were found to be experimentally validated or there was concrete evidence of the participation of the same
29
Figure 4: Modules identified by network clustering using the ClusterONE algorithm. Nodes are genes that are connected by undirect relationships (edges). An edge between a pair of genes when at least one experimental evidence of interaction is present between the genes.
30 Gene Module Expression level in
CRC Targeting miRNAs
BCL2 down miR-17, miR-20a, miR-18a
CCNA2 module 1 up miR-145
CCND1 module 10 up miR-17, miR-195, miR-20a, miR-19a,
miR-99a
CDC25A up miR-21
CDK6 up miR-185, miR-195, miR-21, miR-29a
CXCL12 module 5 down miR-23a-3p
E2F1 module 1 up miR-17, miR-20a, miR-21, miR-93, miR-18a
E2F3 module 1 up miR-195
FAS module 7 down miR-21
FOXO1 down miR-183, miR-27a
HEXIM1 down miR-17
HSPA8 module 3 up miR-106a, miR-17, miR-20a, miR-26b, miR-93
IL6R module 9 down miR-21
IL8 module 3 up miR-17, miR-20a
LRP5 module 8 up 23a-3p, 23b, 27a, miR-375
31
KRAS module 4 down miR-143, miR-18a
MYC module 10
up miR-145, miR99a, miR-18a
NOTCH1 module 4 up miR-23b
PDCD4 module 7 down miR-21
PPIF module 3 up miR-21
RM1 up miR-106a
RUNX1 module 2 up miR-106a, miR-17, miR-20a, miR-27a,
miR-18a
SMC1A module 2 up let-7e
SPARC module 9 up miR-29a
VEGFA module 9 up miR-106a, miR-17, miR-20a, miR-19a,
miR-18a
Table 1: MiRNAs targeting de-regulated genes n CRC tumor samples when compared to matched-normal tissues. Cells with text in bold identify the five genes with the best scores in terms of observed identification probability (O) and expected probability (E) ratios.
32
An experimental network was derived from the 41 above-mentioned miRNAs. A miRNA was selected to populate this network only if it was differentially expressed between tumor and adjacent non-tumorous tissues and significantly correlated with at least a miRNA within the network. The sign of correlation was not kept into account, as we focused only on miRNA-gene relationships rather than their regulation pattern. Thirty-nine out of 41 miRNAs resulted to be linked by 148 edges (Figure 5B). The experimental network almost included the literature-based network. MiRNAs with no links with other miRNAs were discarded. Moreover, the experimental network contained miRNAs not present in the literature-based network, such as miR-335.
The two networks were compared in search of similarity and differences. Edges were compared using the assumption that if two miRNAs are connected to the same target gene, they are connected the same way. This analysis showed that the two networks presented distinct topological features. This may imply that the literature network is incomplete and misses unknown functional relationships between miRNAs involved in CRC development.
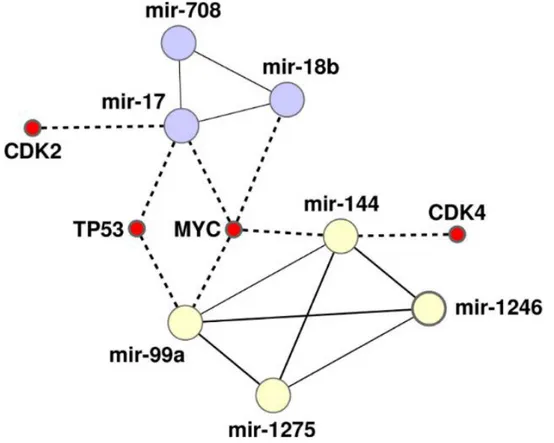
Topological analysis based on several key centrality metrics such as degree, closeness, betweenness clustering coefficient and radiality of the experimental network indicated two significant clusters: a triangle made of miR-708, miR-18b and miR-17 and a clique made of miR-144, miR-1246, miR-1275 and miR-99a. Both modules were made of nodes not present in the literature-based network, except for miR-17. MiR-17 and miR-1246 or miR-99a were used as seeding nodes by Cluster ONE for the detection of the modules. Among these, 708, 18a, 18b and 17, together with 92b, miR-10b and let-7e were the most important miRNAs of the network, from a positional
33
perspective (Table 2). These miRNAs control four of six intramodular hubs, namely TP53, MYC, CDK4 and CDK2 which, in this context, can be considered as intermodular hubs, as they connect the two modules (as depicted in Figure 6). This intermodular hubs are for the most part pleiotropic and are directly linked to different biological modules, interacting with different partners at different moments and/or within different cellular compartments. These miRNAs also control the top five genes in terms of O/E scores (see Material and Methods, section 1.4 for a detailed explanation of the O/E scoring criterion): CCNA2 (module 1), MYC (module 10), LRP5 (module 8), E2F1 (module 1), HSPA8 (module 3), from the initial list of 391 genes.
34
Figure 5: Literature-based and experimental networks of miRNA interactions. (A) Literature-based network: two miRNAs are connected if there is any evidence of physical or (cancer-related) functional interactions. (B) Experimental network: it connects any two miRNAs if they are differentially expressed between matched pairs of tumor and adjacent, non-tumoral mucosa samples and their expression values correlates significantly. Colors represent miRNA clusters. Labels are colored according to the topological importance of the miRNA in the network by means of classical centrality metrics: degree, clustering coefficient, closeness, betweenness. Edges in red emphasize if the miRNA makes a closed triangle or a clique.
35
Figure 6: The heterogeneous network of MiRNAs–mRNAs intermodular hubs. The triangle made of miR-708, miR-18b, miR-17 and the clique made of miR-144, miR-1246, miR-1275, miR-99 interacts with four intermodular hub coding genes: TP53, CDK4 and MYC, while the triangle formed by miR-708, miR-18b, miR-17 controls CDK2.
36
ID Degree Betweenness Closeness Radiality Clustering Coefficient rank
hsa-mir-17 7 0.12114046 0.48611111 0.82380952 0.52380952 4 hsa-mir-18a 9 0.13434641 0.51470588 0.84285714 0.30555556 4 hsa-mir-92b 10 0.16535814 0.51470588 0.84285714 0.24444444 4 hsa-mir-708 14 0.32231693 0.55555556 0.86666667 0.14285714 4 hsa-mir-106a 8 0.0688362 0.49295775 0.82857143 0.32142857 3 hsa-mir-18b 10 0.10160731 0.47945205 0.81904762 0.31111111 3 hsa-mir-10b 8 0.17204106 0.44444444 0.75 0.28571429 2 hsa-mir-31 2 0 0.38043478 0.72857143 1 1 hsa-mir-149 2 0 0.31818182 0.64285714 1 1 hsa-mir-19a 3 2.40E-01 0.37634409 0.72380952 0.66666667 1 hsa-mir-567 2 0 0.36082474 0.7047619 1 1 hsa-mir-144 3 0 0.33333333 0.66666667 1 1 hsa-mir-21 4 0.00640056 0.41666667 0.76666667 0.5 1 hsa-mir-1280 3 0.15368357 0.45283019 0.75833333 0.33333333 1 hsa-mir-27a 5 0.00584634 0.40697674 0.75714286 0.4 1 hsa-mir-20a 5 0.01515806 0.43209877 0.78095238 0.4 1 hsa-mir-182 8 0.09012205 0.42682927 0.77619048 0.28571429 1 hsa-mir-1246 5 0.05109044 0.41666667 0.76666667 0.4 1 hsa-mir-1275 7 0.03921769 0.38888889 0.73809524 0.28571429 1 hsa-mir-99a 8 0.0829972 0.41176471 0.76190476 0.17857143 1 hsa-mir-23b 2 0.00487995 0.39772727 0.74761905 0 0 hsa-mir-26b 2 0.0096732 0.36842105 0.71428571 0 0 hsa-mir-375 2 0.05714286 0.33653846 0.67142857 0 0 hsa-mir-422a 2 0.01171669 0.30434783 0.61904762 0 0 hsa-mir-497 3 0.00642857 0.32407407 0.65238095 0 0 hsa-let-7e 3 0.01291116 0.41176471 0.76190476 0.33333333 0 hsa-mir-345 3 0.0507403 0.39325843 0.74285714 0 0
37 hsa-mir-23a 5 0.01582166 0.40697674 0.75714286 0.3 0 hsa-mir-143 3 0.07103641 0.32407407 0.65238095 0 0 hsa-mir-150 5 0.049175 0.43209877 0.78095238 0 0 hsa-mir-195 5 0.06793451 0.42682927 0.77619048 0.2 0 hsa-mir-93 4 0.03502268 0.43209877 0.78095238 0 0 hsa-mir-145 4 0.12216687 0.4375 0.78571429 0 0 hsa-mir-133b 1 0 0.36082474 0.7047619 0 0 hsa-mir-215 1 0 0.3271028 0.65714286 0 0 hsa-mir-183 1 0 0.30172414 0.61428571 0 0 hsa-mir-29a 1 0 0.33802817 0.60833333 0 0 hsa-mir-224 1 0 0.25362319 0.50952381 0 0 hsa-mir-185 1 0 0.24647887 0.49047619 0 0
Table 2: Topological centralities for the miRNAs targeting CRC genes in the co-expression and interaction network. Yellow labeled miRNAs identify the closed triangles and the clique identified in the network.
38
4. The leading topological position of miRNA-145 is fundamental for the upholding of cohesiveness and functional cooperation among modules
Upstream analysis of intra/intermodular hub genes revealed a noticeable mechanistic and topological position of miR-145 score = 2.35), miR-9 score 2.11) and miR-137 (z-score = 2.07). Among these, only mir-145 was found to be differentially expressed in CRC samples.
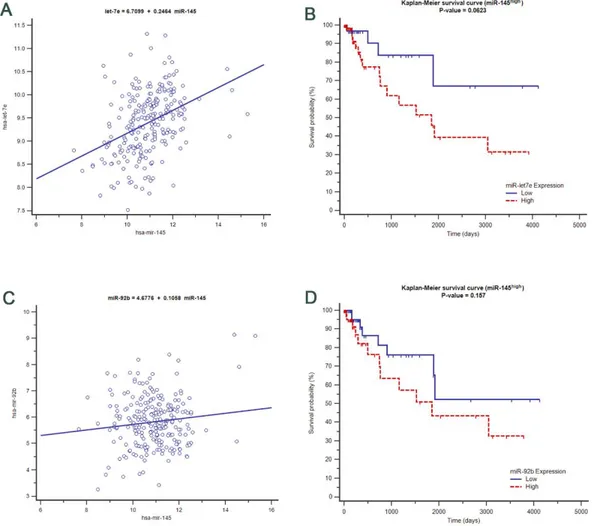
The hypothesis that miR-145 could be identified as a master regulator of the CRC network was sustained both statistically, by the experimental network and functionally by the literature-based network. MiR-145 was strongly correlated with the miRNAs in Figure 5B. To verify the importance of miR-145 in the upstream regulation of these miRNAs, the expression profiling was compared in the TCGA database by downloading CRC profile expressions. This analysis not only confirmed that the expression of miR-145 correlates with that of miR-17, miR-23b and miR-99a (one of the seeding nodes) but also that these were likely to be causally dependent on miR-145 (P < 0.0001). Besides, let-7e and miR-92b positively correlate with miR-145 (Figures 7A and 7C) and high expression values of let-7e and miR-92b resulted in moderate risk factors, if coupled with high expression values of miR-145 (Figures 7B and 7D). Similarly, low profiles of let-7e and 92b conferred a worse prognosis, if coupled with low expression values of miR-145. High values of miR-10b and miR-143, instead, were risk factors if concomitant with low values of miR-145 (data not shown).
39
More generally, miR-145 resulted to be directly connected with several components of important clusters of miRNAs, which in turn targeted relevant intra/inter-modular hub genes, as reported in Supplementary Table S3. Topologically, miR-145 was linked through miR-93 to the triangle made of miR-708, miR-18b and miR-17 and to the clique made of miR-144, miR-1246, miR-1275 and miR-99a, thereby controlling, even indirectly, four intramodular hubs, specifically TP53, MYC, CDK4 and CDK2.
We will not discuss the importance here of miR-145 deregulation in colorectal carcinogenesis, well aware that molecular competition represents a universal and frequent form of gene regulation that operates also in RNA regulatory networks. Instead, we will focus here on the short-range interactions of miR-145 with the aim to highlight its apical regulative role on key genes and biological functions related to CRC development.
40
Figure 7: miR-145 associations with important deregulated miRNAs in CRC using TCGA expression level profiles A) correlation between miR-145 expression values and let-7e B) Kaplan-Meier curve of low (below median) and high (above median) expression values of let-7e compared with miR-145 C) correlation between miR-92b and miR-145 D) Kaplan-Meier curve of miR-92b when expression is low (below median) and high (above median) compared to miR-145 expression profiles.
41
5. Measuring the effect of the induced expression of miR-145 in CRC cell lines
To test the importance of the deregulation of miR-145 and its specific effect on its miRNA partners, we assessed whole miRNA expression in vitro in four human colorectal cancer cell lines after miRNA-145 induction (Material and Methods section 1.7). Only miRNAs showing statistically significant differential expression (P < 0.05, log2FC ≥ 1.5,
log2FC ≤ −1.5) after miR-145 ectopic expression were considered. Several miRNAs were
differentially expressed in the four tested cell lines: 82 miRNAs in the CaCo2 cell line (32 up-regulated and 50 down-regulated), 120 miRNAs in HT-29 cells (58 up-regulated and 62 regulated), 90 miRNAs in HCT116 cells (49 up-regulated and 41 regulated) and 95 miRNAs in the SW480 cell line (58 up-regulated and 37 down-regulated). Among these, three direct partners of miR-145 were modulated in three of four cell lines. In particular, miR-99a was highly down-regulated in CaCo2 cells (p = 0.036, log2 FC = −4.36), miR-23b was mildly down-regulated in the HT29 cell line (p = 0.004, log2 FC = −1.81), and miR-143 was up-regulated in SW480 cells (p = 0.046, log2 FC =1.52). Furthermore, among the deregulated miRNAs, we found at least one miRNA, for each cell line, that was indirectly connected to the miR-145: miR-23a (p =0.004, log2 FC = −5.14) in CaCo2 cells; miR-23a (p =0.008, log2 FC = −1.84) and miR-27a (p =0.039, log2 FC = −2.5) in HT29 cell, with both included in miR23a∼miR27a∼miR24-2 cluster, and being down-regulated; miR-18a* (p = 0.00miR23a∼miR27a∼miR24-2, logmiR23a∼miR27a∼miR24-2 FC = miR23a∼miR27a∼miR24-2.3miR23a∼miR27a∼miR24-2), included in the miR17∼miR92a cluster, and miR-24-1* (P < 0.001, log2 FC = 2.4), included in miR23b∼miR27b∼miR3074 cluster, were up-regulated in SW480 cells. MiR-1246 was also up-regulated in HCT-116 cells (p = 0.041, log2 FC = 3.47) and mildly in HT29 cells (p = 0.038, log2 FC = 1.32).
42
The enrichment of the direct and indirect targets of miR-145 that resulted from our
in-silico analysis, other than providing enrichment with several expected cell-cycle related
processes, did significantly enrich two important pathways: the PI3K pathway through FGF3, FRAP1 and RPTOR (p = 0.000049), the WNT signaling pathway through FZD5, FZD8 and PPP3CA (p = 0.00039), and the MAPK signaling pathway through CRK, FAS, MAP3K5, MAP3K8, MAPK14, RAPGEF2, RPS6KA5, TGFBR2, CHUK, DUSP5, MAP4K3, PDGFA, RRAS2, DUSP8, FGF4, HSPA8, FGFR3, FRAP1 and PPP3CA genes (p = 0.0289).
6. MAPK signaling pathway is modulated by miR-145 ectopic expression in CRC cell lines
The main impact of miR-145 over-expression induced the expression of several genes participating in the MAPK signalling pathway. Their expression profiles were compared with those measured in cells without miR-145 overexpression, as well as in matched tumorous and adjacent non-tumorous colon tissues obtained from CRC patients (Figure 8A).
Looking in depth at the genes responsible for the CRC development, CDKN2C greatly increased its expression both in CaCo2 and in HT-29 cells (log2 FC = 3.43 and 4.46,
respectively), while this differential expression was not observed in the genome-wide profiling study. On the other hand, MAP2K4 slightly increased its expression in both HCT116 and HT-29 cells (log2 FC =1.69 and 1.37, respectively), whereas it was
43
observed in HT29 cells for the following genes: CDKN1A, CDKN2B, KRAS, PRDX6 and
SMAD4. KRAS and SMAD4 that were up-regulated after transfection (log2 FC =1.53 and
2.74, respectively), but were down-regulated in our CRC specimens (log2 FC = −2.63 and
−3.1, respectively). Finally, ELK1 and CDK2, which exhibited elevate closeness and degree centrality scores, were both up-regulated in our CRC specimens (log2 FC = 4.56
and 4.34, respectively). In contrast, ELK1 was down-regulated in HCT116 cells (log2 FC
= −4.64) and up-regulated in HT-29 cells (log2 FC = 1.93), while CDK2 was
imperceptibly down-regulated in SW480 cells (log2 FC = −1.17) and up-regulated in
HT-29 cells (log2 FC = 2.27), after miR-145 transfection (Figure 7B). Interestingly, HT29
cells showed up-regulation of most of the MAPK pathway genes, except for CDKN1C,
LAMTOR3 and RLPO.
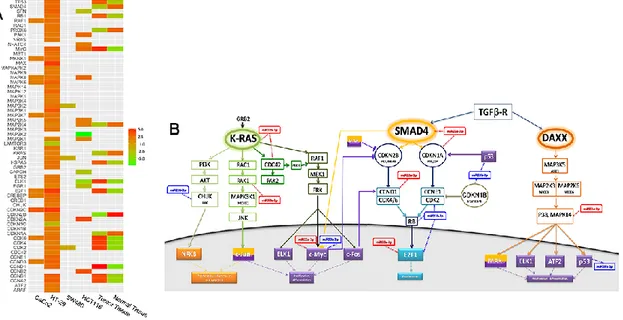
These genes are not direct targets of 145, but of miR23a, 23b, 26b, miR-99a and miR-18a, which in turn, were deregulated in the four cell lines, as an effect of the ectopic expression of 7. miR-145. In fact, we found alterations of both miR-23a and miR-23b in HT-29 cells. Being highly similar in their mature sequences, they are expected to control the same transcripts, which are known to mostly belong to the KRAS and TGFβ signalling pathways, and which, in our study, are those of the K-RAS, cMYC and E2F1 genes, as reported in Figure 8B.
44
Figure 8: A) Heatmap of the expression levels of the genes composing the MAPK signaling pathway in four CRC cell lines after miR-145 ectopic expression. For comparative purposes, gene expression values of matched pairs of tumor and adjacent non-tumorous mucosa samples are also reported. B) The downstream effects of miR-145 ectopic expression: Pathway map representing the downstream effects of the miR-145 ectopic expression in the HT-29 cell line.
45 7. Conclusions
The integrative analysis of mRNA–miRNA and miRNA–miRNA interactions identified two cancer-protection and nine cancer-favourable modules of genes and provided interesting evidence on mRNA–miRNA crosstalk in CRC. Several genes emerged that demonstrated a relevant dual role, both being intramodular and intermodular hubs in the interaction network built from experimental interaction evidences. A strongly connected sub-network was made up, in fact, by TP53, MYC, CDK4, CTNNB1, CHEK1 and CDK2, which were the most central genes (some of the intramodular hubs). CDK4, CDK2 and especially TP53 and MYC also acted as intermodular hubs because they connected two cohesive clusters, the one made of 99a, 144 and 1275, for which 1246 worked as seeding node, and the triangle made up of 18b, 708 and miR-17, the latter being the seeding node.
The expression level of miR-145 was highly correlated with the above-mentioned clique and triangle and, directly or indirectly, with miR-93, miR-143, miR-18a, miR-23a and miR-23b, miR-31, miR-345, miR26b, miR-185 and miR-20a, thus acting as potent modulator of four intramodular hubs, namely TP53, MYC, CDK4 and CDK2I, and as the genuine actuator of a number of important biological functions and pathways (Mogilyansky and Rigoutsos, 2013; Olive et al., 2010; Sylvestre et al., 2007).
First, miR-145 demonstrated to exert a certain control on the cell cycle process through a series of partners: BCL2, FAS, PPIF, MYC and E2F1. The control of mir-145 over
MYC is of particular importance, as it promotes the transcription of the polycistronic