UNIVERSITÀ DEGLI STUDI DI SASSARI
CORSO DI DOTTORATO DI RICERCA IN SCIENZE BIOMEDICHE
Coordinatore del Corso: Prof. Andrea PianaCURRICULUM IN GENETICA MEDICA
Referente di Curriculum: Prof.ssa Margherita Maioli
XXXI CICLO
The eQTLs Catalog and LinDA browser:
a platform for determining the effects on transcription of GWAS variants
Stefano Onano
Tutor:
Prof. Francesco Cucca
Co-tutor:
Dott. Mauro Pala
Tesi di dottorato di:
Summary
Introduction
1Overview on eQTLs 3
Lacks in eQTL studies 4
LinDA Project
5Goals 5
The IRGB-CNR eQTL Catalog 6
Description of studies (sample type and population) 7
Comparison to the other eQTLs catalogs. 8
eGenes and year of publication 10
Intersection Gencode, QTLcatalog, Gwas, Druggability 12
Coherence eGene-Gwas genes 14
Linda Web 16
The LD browser 17
the AF Browser 18
The Pairwise Variants Browser 18
Methods 19
Data collection and standardization 19
Intersection of the eQTLs with the GWAS. 21
LinDA Browser implementation. 23
Conclusions
241
I
NTRODUCTIONThe linkage analysis approach, widely used to dissect the genetic cause of Mendelian disorders, has not proved as effective for common diseases, leading the genetics community to the assumption that they have different genetic mechanism1 and to the hypothesis of common disease/common
variant (CD/CV)2 namely that common diseases are due to common variant
with small effect sizes.
The genome wide association studies (GWAS) have demonstrated have a powerful method to identify risk factors for complex traits in the population and especially in medical genetics, they are used to predict the degree of susceptibility for a disease in order to develop new preventive treatment and pharmacological strategies3.
In 2007 the first large well-designed GWAS for complex diseases employing a SNP chip with good coverage of the genome4 was published in Nature, and
since then thousands of DNA sequence variations correlated with human complex traits and diseases have been discovered5,6,7,8. GWAS attempt to
detect the common genetic variants correlated with a particular complex trait or disease status through statistical association tests that provide association signals: genetic loci which can be functional variants directly associated at the trait/disease (direct association) or sentinel variants in high Linkage Disequilibrium (LD) with the influential variant (indirect association)3.
A limitation of this analysis is due to the fact that the associated genetic variants are mostly located in non-coding regions of the genome9,10,11,12, and
thus the identification of the genes and the molecular mechanisms affected by the genetic variants is challenging13,14.
A common approach has been to propose as the candidate gene the most proximal to the GWAS variants or to suggest those among the proximal genes
2 limited to the biological knowledge, sure enough gene expression can be
regulated by variants over large genomic distances15.
A clear example that illustrates this limitation are the studies that identified a molecular mechanisms affected by the GWAS variants associated with Body Mass Index and mapping to the FTO gene16,17, reinforced by the effect of FTO
on adiposity18–20. Nevertheless, eventual studies21,22 rejected this hypothesis,
indeed, supported by eQTL and chromatin-capture analysis they discovered interactions between the locus on FTO and regions in Irx3 and Irx5 genes but not with FTO itself; highlighting the role of this SNP as obesity promoter by influencing the adipocyte development and function through IRX3/523.
Nicolae et al. 201024 showed that single nucleotide polymorphisms (SNPs)
associated with complex phenotypes are especially enriched for a particular type of variants modulating gene transcriptional levels (eQTLs, expression Quantitative Traits Loci) compared to other SNPs with matched allele frequency along the genome; demonstrating that these variants often act on the traits by influencing the quantity of transcripts rather than the sequence. These findings suggest that a large proportion of the GWAS variants could have a regulatory role, usually in gene expression, and studying eQTLs may provide key information about the regulation of genes and prioritization of the target genes of these association peaks 25,26,27.
The eQTL analysis has proven to be one of the most efficient approaches to investigate the regulatory role of genetic variants on gene expression28, 29,30
and many of these have been used to prioritize target genes of variants associated with multifactorial traits31,22 and diseases 31,32,33.
This represents an initial step both in analyzing mechanism and in inferring drug targets involved in the pathogenesis of disease34,35,36,37, since indicating
whether an allele gives a positive or negative direction of effect indicates whether therapeutic modulation of a drug target should be agonistic or antagonistic.
3
Overview on eQTLs
As previously anticipated, an eQTL is a genetic variant that regulates gene expression, and thus whether the effect allele is present will cause an increase or decrease in mRNA quantity (transcription).
So far the majority of the eQTLs findings act in cis38; in literature a cis-eQTL
is mainly defined as a variant located within 1 Mb, up or down streaming of the transcriptional start site (TSS), except for some studies where distance is reduced (as 250/500 kb39).
Whereas the trans-eQTLs are those eQTLs that act on remote transcripts, i.e. are located on the same chromosome of the target gene but far (e.g. more than 5Mb) from its TSS or mapped on different chromosome.
As demonstrated in several studies, the eQTLs can act differentially among human populations of different ancestry, already in 2007 Stranger 40 reported
as 17–29% of loci show significant differences in mean expression levels between population pairs.
This topic has been resumed and confirmed by Lappalainen28 in the first
uniformly processed RNA-seq data from multiple human populations with high-quality genome sequences.
Analysis performed in multi-tissue samples have shown that a high percentage of eQTLs are cell-type specific41,42,43.
In particular, GTEx44 it is highlighted that closely related tissues show strong
correlation, that greater tissue-specificity in cis-eQTLs is observed in larger sample sizes , and that trans-eQTLs tend to be markedly more tissue-specific. In addition in Fairfax 201445 they note that, within the same cell population,
the eQTLs can be affected and thus have an effect on expression only in particular cell activation states.
4
Lacks in eQTL studies
Despite the increasing interest and utility of eQTLs in interpreting GWAS peaks, in literature there is no comprehensive collection of the public eQTL findings. As of 2018 few eQTLs catalogs exist and those have compiled only one or a small portion of the sources available in the literature.
For example, large multi-tissue studies, in addition to the large GTEx44 for
healthy individuals and PancanQTL46 for cancer patients, contain eQTLs only
from their own projects and do not cover blood cell subpopulations. Multi-study catalogs as the Gilad/Pritchard group catalog (http://eqtl.uchicago.edu/Home.html), SeeQTL47 (https://seeqtl.org) and
eSNPO48 contain at most only 12 studies and 12 cells/tissues. GRASP v2.0 49
contains ~50 eQTL studies, but lacks the largest recent ones (as GEUVADIS28, Battle30, BIOS QTL50, GTEx44, BLUEPRINT51) and its
format does not include effect alleles and False Discovery Rate (FDR). Existing eQTL catalogs further lack a way to assess the status of the query variant supplied by the user to the top (or top independent) eQTLs; indeed, it is usually assumed that a lead GWAS variant and eQTL belong to the same association signal (i.e., are tagging the same causal variant) when they are in strong Linkage Disequilibrium (LD) using an arbitrary elevated threshold (usually r2>0.8), here called LD-overlap.
However, co-localization methods exist that can critically assess statistically whether or not an LD-overlap is indeed due to the same causal variant31,52,53
even when a shared causal variant between eQTL and association signal falls below a "standard" threshold31. Only one current platform [ExSNP
(http://www.exsnp.org] permits a search for LD, and it does not let the user specify the population in which LD should be computed.
5
L
INDA
P
ROJECTGoals
For the reasons mentioned in the introduction and sustained by the applicative use derivable, we decided to construct the fullest possible public eQTL catalog to standardize the data available in literature, to facilitate the investigation and determine amount and characteristics of the genes with at least an eQTL (eGenes) and through the intersection with the GWAS identify the level of coincident association with the peaks linked to complex traits and disease.
The catalog is building along with a user friendly web-based browser in order to optimize and simplify the interrogation and to automatically retrieve LD-proxy information
6
The IRGB-CNR eQTL Catalog
We collected 302,835 eQTLs (275,727 of which we re-annotated as cis-eQTLs corresponding to 33,241 genes with at least one eQTL in cis (cis-eGenes) and 12,151 trans-eQTLs, corresponding to 8,421 trans-(cis-eGenes). Here we define eQTLs as those variants associated with gene expression at “global level”, i.e. summing up the signal of the gene isoforms. Variants associated with splicing (isoform ratios or exon usage) are taggetd as sQTLs; variants associated with alternative polyadenilation sites50 are tagged
polyAQTLs, variants associated with Allelic Specific Expression30,50 are
tagged aseQTL and repeatsQTL are those variants associated with expression levels of repeated regions28.
We collected 188,577 sQTLs (174,790 of which we re-annotated as cis-sQTLs corresponding to 23,917 cis-sGenes and 1,784 trans-cis-sQTLs, corresponding to 534 trans-sGenes). QTLs for the different expression categories are reported in Table 4.
For each study we annotated the main summary statistic as the effect (beta or correlation coefficient); the significance (p-value or Bayes Factor) and the FDR; and the effect alleles (contacting the authors whenever they were not otherwise available).
Furthermore, we annotated features of the publication (e.g. PubMed ID, the year of publication, the paper or database of the data source) and experimental design (metadata): sample size (with minimum and maximum sample size for multi-tissue or complex experimental designs) the populations; the number of the eQTLs discovered; the number of tested genes (whenever possible); the number of eGenes; and the sample source (tissue, cell type, stimulation method and disease state).
7
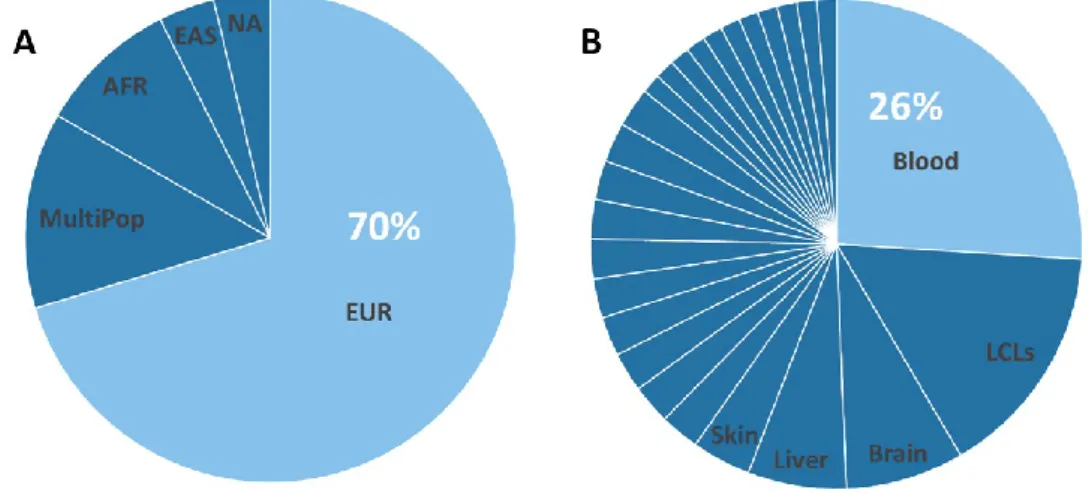
Description of studies (sample type and population)
Most available studies have been conducted on individuals of European ancestry (70.4%), similar to the case for GWAS54,55,56,57.
On average, this leads to privileged discovery of GWAS variants with higher minor allele frequencies in Europeans and would lead to the under-representation of those variants (or their LD proxies) common in other populations but rarer in Europe.
Furthermore, the extent to which the results of GWAS could be transferred to populations of different ethnic origin than those considered in the original study has also been discussed58.
In our collection, 13% of eQTL studies have been performed in more than one ethnic group (called MultiPop in Figure 1A) -- e.g., the V6p44 collected
83.7% European Americans, 15.1% African Americans.Only two studies did not specifically report ethnicity (NA in Figure 1A); e.g. Zeller59 reported that
the individuals had been generally collected in Germany without reporting additional information about ancestry.
Figure 1B reports the tissues or cell-types represented in our catalog. The most represented tissue/cell-type is blood (26%) followed by lymphoblastoid cell-lines (15.6%), expected given the convenience of access to collection.
8 Among the other tissues, brain (7.8%) and liver (6.5%) are the most
represented. In general, the individuals profiled are healthy (82% of the studies).
Comparison to the other eQTLs catalogs.
To assess the degree of novelty of the eQTLs in the IRGB-CNR eQTLs Catalog, we compared it to the largest datasets already publicly available.
As summarized in Table 1, GTEx44 is the largest multi-tissue study thus far,
covering 44 tissues and 135,017 eQTLs variants (version V6p).
Our catalog, including GTEx, has 10 additional tissues from healthy individuals not present in GTEx such as pons60 (N=142), thalamus61 (N=124);
and 16 tissues from patients including ER-negative and ER-positive breast tissue62 (N=48 and N=171), psoriatic lesional and uninvolved skin63 (N=53)
and cerebellum in Alzheimer’s disease affected patients64 (N=197).
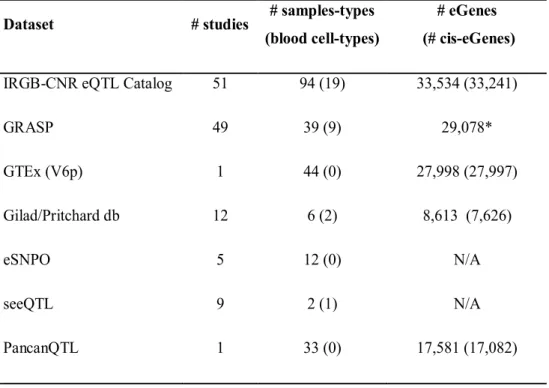
Table 1. Main feature of eQTLs catalogs available in literature and our eQTL catalog (IRGB-CNR eQTLs Catalog). Blood specific cell-type here means cell types more specific than leukocytes or Peripheral Blood Mononuclear Cells (PBMCs). (*) Results are collapsed by gene (different isoform for the same gene in counted one time).
Dataset # studies # samples-types (blood cell-types)
# eGenes (# cis-eGenes)
IRGB-CNR eQTL Catalog 51 94 (19) 33,534 (33,241)
GRASP 49 39 (9) 29,078* GTEx (V6p) 1 44 (0) 27,998 (27,997) Gilad/Pritchard db 12 6 (2) 8,613 (7,626) eSNPO 5 12 (0) N/A seeQTL 9 2 (1) N/A PancanQTL 1 33 (0) 17,581 (17,082)
9 Further, with respect to GTEx, our catalog includes 5 non blood
sub-populations, including osteoblasts65 (N=94-101) and 19blood specific
sub-populations, including monocytes59 from Gilad/Pritchard group eQTL
database (N=1490); dendritic cells66 (N=284-528); leukocytes67 (N=606); B
cells32 (N=283); T cells51 (N=132); and neutrophils68 (N=114), with some
studies also collecting both naïve and stimulated cells45.
GRASP 49(Genome-Wide Repository of Associations Between SNPs and
Phenotypes) is a large collection of genetic association results (not only restricted to eQTLs). It provides eQTLs results in a dedicated file (290,238 variants in their eQTLs results, v2.0.0.0) and under the eQTL category includes also QTL for expression traits that we are not considering here as strictly eQTLs (e.g. ASE and differential exon level) but are classified under different categories (see later).
In our comparison we also considered the datasets, Gilad/Pritchard lab eQTLs, seeQTL47, eSNPO 48 and PancanQTL46. The first study has already
included in our dataset, while seeQTL and eSPNPO report respectively 4 and 3 more studies that are not included in our collection. PancanQTL is focused only on cancer tissues, covering 33 different cancer types while the design of our eQTL catalog covers both healthy individuals and is not dedicated to specific diseases.
10
eGenes and year of publication
To annotate eQTL target genes we used GENCODEv1969 as the reference
gene annotation. This is because GENCODE covers several gene biotypes (including protein coding and linc-RNAs) and also because large recent eQTLs studies used some version of GENCODE 28,44,50,67.
We found that the 93% of the protein coding genes have at least one cis-eQTL; 94% have at least one eQTL (both cis and trans); 80% have at least one cis-sQTL (cis-sGene); and 80% have at least one sQTL.
If we segment the eQTL studies based on when they were released, there has been a progressive increase in the number of cis-eGenes discovered, and that large contributions have been given by Fehrmann, Fairfax and GTEx 32,44,70
(Figure 2A). On the contrary, only 56%, of linc-RNA expression levels have been associated with at least one cis-eQTLs; 56% with at least one cis or trans eQTL; 25% with at least one sQTL; and 25% with at least one cis or trans sQTL.
Fig. 2. Cumulative number of eGenes discovered segmented by the year of publication. Results are reported separately for protein-coding eGenes (A) lincRNAs (B). In dark blue are represented eGenes with eQTLs found in at least two studies, while in light blue are represented those eGenes found identified in a single publication. The number of cis-eGenes is reaching saturation for protein coding genes (93%, 18770 over 20242 in GENCEODE V19 annotation) while a smaller fraction has been identified for lincRNAs (56%, 3950 over 7105).
11 With respect to the protein-coding eGenes, the number of linc-RNA eGenes
discovered rapidly increased recently (Figure 2B) and large contributions have been made by GTEx V6p44 and by Zhernakova50 (Figure 2B).
The discrepancy between the discovery profile for protein coding and lnc-RNAs could be explained by the fact that protein-coding genes have been largely studied since the advent of microarrays, whereas the study of the lncRNAs has been more common only with the later introduction of RNAseq71.
lncRNAs have thus sharply increased in commonly used gene annotation resources like GENCODE 69, a sub-project of the ENCODE11 (ENCylcopedia
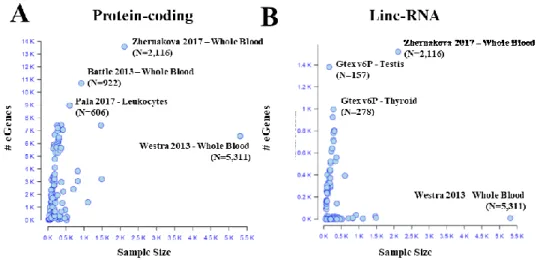
Of DNA Elements) project, focused on highly accurate annotation of all evidence-based gene features (genes, transcripts, coding sequences, etc…). Furthermore, lncRNAs tend to be expressed only at low levels, and can be recovered more easily in recent studies with increased sample size (e.g. Zhernakova50 with 2,116 individuals profiled) (Figure 3B).
Fig. 3. eQTLs subprojects (e.g. GTEx in each tissue is considered as a subproject; eQTLs in naïve and stimulated cell-types in the same publication has been considered as a subproject) scattered by the number of eGenes discovered and the sample size for (A) protein-coding genes (B) lincRNAs. For some of the projects (top two for sample size and top three for number of eGenes discovered) reference to the publication, Tissue/cell-type and sample size is reported.
12
Intersection Gencode, QTLcatalog, Gwas, Druggability
A goal of identifying eQTLs is to provide insights about the target genes by which the GWAS variants mediate and modulate complex traits and diseases. Thus, we searched for the overlap of the eQTLs from our catalog with the GWAS variants reported in two commonly used GWAS repositories, the NHGRI-EBI GWAS Catalog8, focused on both complex traits and diseases
(1,957 traits and disease) and Immunobase, focused on autoimmune diseases (19 immune system diseases).
To identify the overlap between eQTLs and GWAS variants we considered not just the top associated but also the sentinel variants (variants in LD, r2>0.8, with the top associated variant). LD was computed in the European
population as the source of most of the eQTL studies. We found that ~22% of the protein coding cis-eGenes overlap with the NHGRI-EBI GWAS Catalog variants (GWAS-eGenes),~26% of which are considered druggable according to the classification of Finan72 (Figure 4).
For the protein-coding cis-sGenes (protein-coding genes with at least one sQTL), ~18% had at least one sQTL overlapping with the NHGRI-EBI GWAS Catalog and ~25% of them considered druggable as described above. As expected, because Immunobase focused just on autoimmune-diseases, the intersection of the eQTLs with Immunobase was lower, in particular, ~4% of the cis-eGenes (29% druggable) and ~3% of the cis-sGenes (32% druggable) (Figure 4). Concerning the linc-RNAs, the intersection with the NHGRI-EBI GWAS Catalog was 6% for both the cis-eGenes and the cis-sGenes, whereas the intersection with Immunobase was 1% of both the eGenes and the cis-sGenes.
14
Coherence eGene-Gwas genes
To assess how many effects on traits might involve changes in transcription we computed the number of trait, disease and LD-independent associated loci with at least one LD-overlapping eQTL.
Among 1,268 traits/diseases tested in the NHGRI-EBI GWAS Catalog, 889 (70%) have at least one associated locus overlapping with eQTLs; and among the 10,364 loci-trait pairs 4,901 (47%) overlapped with at least one eQTL. In addition to the associated variant, GWAS studies usually report a candidate target gene for the GWAS variant. The gene is chosen based on proximity and/or a biology-based hypothesis. The list of the GWAS proposed target genes is also listed in the NHGRI-EBI GWAS Catalog for the respective studies.
Comparing the proposed target genes with the target genes found in our eQTL catalog for the same variants, we found that 30% of the entries in the list of GWAS candidate genes included no eGene (Figure 5) and the 42% of the instances include no eGenes in the candidate list. To avoid redundancies based on LD correlation, we performed our estimation after grouping the GWAS variants into LD-independent loci.
15 Because complex trait and diseases are polygenic, i.e., their genetic
component would involve hundreds of genes and conceivably a large fraction of those genes expressed in the relevant tissue/cell-type (omnigenic model73),
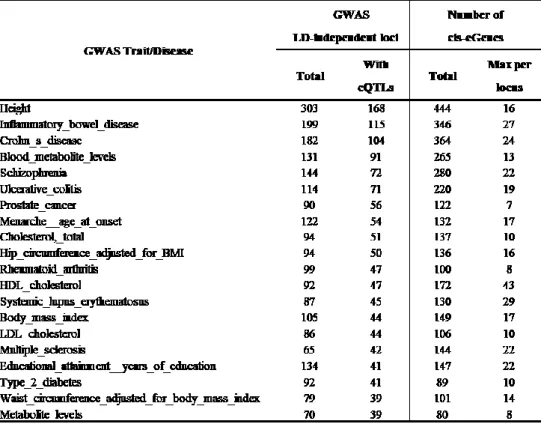
to describe the distribution of the number of eGenes for each complex traits and diseases we grouped the eGenes with eQTLs overlapping for the same complex traits and diseases, and ranked the results by the total number of overlapping cis-eGenes (Table 3).
Height has the top rank with 444 cis- eGenes, and top twenty include autoimmune diseases (Crohn’s disease with 364, Inflammatory bowel disease with 346 and Ulcerative colitis with 220 cis-eGenes respectively), Schizophrenia (280), Blood metabolite levels (265), HDL cholesterol (172), Body mass index (149), Educational attainment (147) and Cholesterol (137 cis-eGenes).
Table 3. Number of cis-eGenes with the respective eQTL overlapping (LD-overlap with r2≥0.8 computed in Europeans) with variants associated with complex traits or diseases in the NHGRI-EBI GWAS Catalog.
16
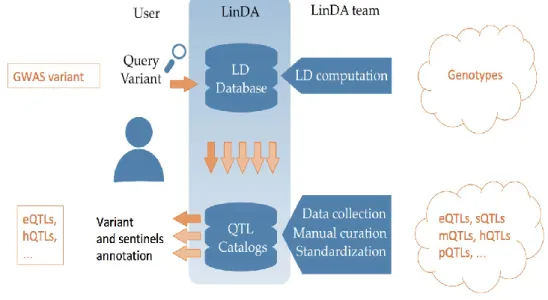
Linda Web
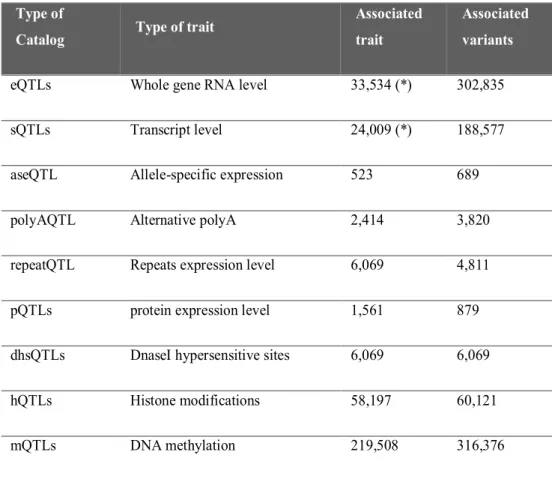
In order to facilitate the use of the data collected also to non-bioinformatics users, we have developed a web interface, called LinDA (http://linda.irgb.cnr.it), which host the eQTL catalog and other minor catalogs collecting splicing, epigenetic (DNA methylation, Histonic modifications, DNAsiI hypersensitive sites) and proteomic data as reported in the table 4.
Within LinDA platform we have implemented three major browsers the LD browser, the AF Browser and the Pairwise Variants Browser.
Type of
Catalog Type of trait
Associated trait
Associated variants
eQTLs Whole gene RNA level 33,534 (*) 302,835
sQTLs Transcript level 24,009 (*) 188,577
aseQTL Allele-specific expression 523 689
polyAQTL Alternative polyA 2,414 3,820
repeatQTL Repeats expression level 6,069 4,811
pQTLs protein expression level 1,561 879
dhsQTLs DnaseI hypersensitive sites 6,069 6,069
hQTLs Histone modifications 58,197 60,121
mQTLs DNA methylation 219,508 316,376
17
The LD browser
The LD browser is the main tool. For a given variant of interest, it determines all the variants in Linkage Disequilibrium and whether they intersect with other association studies (QTLs and GWAS).
The user can specify a range of LD and the specific population for which the LD range is implemented. There are 32 populations of the 1000 Genomes project than can be queried. The output of the LD browser is a sequence of tables, each reporting the intersection with other association studies (e.g., our eQTL Catalog).
The tables can be inspected directly on the web interface and can also be downloaded in CSV and EXCEL formats.
The first table output lists the variants in LD in the range specified by the user. The other tables show intersection with the eQTLs catalog (eQTLs, sQTLs, polyA QTLs, aseQTLs, and repeat QTLs). In each table are details about the statistical association, the gene annotation, and the experimental metadata.
18 The details include the variant in the association study (e.g., the eQTL or
GWAS variant), and its LD (in r2) with the query variant, the trait ID,
summary statistics (e.g. effect, p-value, FDR), and other experimental design details of the original study (e.g., sample size, the tissue/cell).
the AF Browser
Beside the main LD Browser tool, LinDA offers other utilities that can facilitate the interpretation of the results. These are the AF Browser (Allele Frequency Browser) and the Pairwise Variants Browser. The AF Browser returns, for a query genetic variant, the allele frequency in 32 human populations. The output is a scatterplot with the allele frequency per population segmented by the continent of origin. A tabular format of the results is also provided. The allele frequency can indicate the degree of statistical power to find an eQTL in different populations.
The Pairwise Variants Browser
The Pairwise Variants Browser interrogates a pair of variants and returns the number of combinations of their genotypes. This permits the determination of which allele in a query variant is phased (i.e., more likely to be o the same chromosome) with one of the alleles of the sentinel variant. This information is useful to interpret the effect size direction of the sentinel variants alleles (e.g. those outputted by the LD Browser) with respect to the direction of the query variant alleles.
19
Methods
Data collection and standardization
Starting from a preliminary bibliographic study we have drawn up a list of public studies and databases to collect in our catalogue (IRGB-CNR eQTL Catalog).
The genetic variants have been encoded as “chrom:position” in hg19 build. If this was not already available in the original paper, we used the liftover software74 for converting between genome builds. To update the rsID to the
dbSNP149
(ftp://ftp.ncbi.nlm.nih.gov/snp/organisms/human_9606_b149_GRCh37p13/ VCF/All_20161121.vcf.gz) we used the script liftRsNumber.py (from https://genome.sph.umich.edu/wiki/LiftRsNumber.py) and the respective annotation files, RsMergeArch.bcp.gz and SNPHistory.bcp.gz both downloaded from ftp://ftp.ncbi.nlm.nih.gov respective on December 2016 and on November 2016. Then, we converted the rsID (dbSNP149) into the hg19 genotype position. When needed we also considered the manufacturer annotation files (e.g. for converting microarray probe sets IDs to the rsID or the positions).
To standardize the expression traits, whenever possible we converted the gene ID or the gene symbol aliases to the gene symbol used in GENCODEv19 69,
downloaded from, https://www.gencodegenes.org). To retrieve the aliases we used a custom script to interrogated HGNC database75, downloaded from
https://www.genenames.org,), NCBI database (NCBI Resource Coordinators 2016,
ftp.ncbi.nlm.nih.gov/gene/DATA/GENE_INFO/Mammalia/Homo_sapiens. gene_info.gz) and GENCODEv19 annotations and in some cases, we considered the manufacturer annotation files (e.g. for converting microarray probe sets IDs to the gene symbol or the gene ID). Gene biotype (e.g., coding,
20 For downstream analysis that required a homogeneous definition of cis and
trans, we recomputed the distance of the TSS of the target gene to the eQTL (by using the annotations as above) and defined cis all the distances <1Mb, and trans all the others.
Some studies did not indicate the top associated variant to the expression trait (eQTL) but reported the summary statistics for all the variants tested or all those under a large FDR cutoff (e.g. FDR<0.5). In these cases, we identified the top associated variant (e.g. the lowest p-value or the largest Bayes Factor) that we called TopVar.
If available, we considered as eQTL only those with FDR<0.05 (in Zou64 we
kept two version of the dataset, one - TopVar1 - with both PBonf value and Qvalue and another one - TopVar2 - with just the Qvalue in order to use this value for the FDR filtering), otherwise we kept those reported by the original study metadata about the study and experimental design details have been manually curated from the original papers (see Results).
21
Intersection of the eQTLs with the GWAS.
NHGRI-EBI GWAS catalog8 has been downloaded from
https://www.ebi.ac.uk/gwas/ and Immunobase from https://www.immunobase.org.
We considered an eQTL intersecting the NHGRI-EBI GWAS Catalog (or Immunobase) if the eQTL was in LD (r2≥0.8 in the European population) with the GWAS variant.
To compute the LD we downloaded the genotypes of 1000 Genomes project76
in VCF format, downloaded from http://www.internationalgenome.org), we generated a VCF with European individuals only and computed the LD with plink77 version plink-1.90_b3.38, downloaded from
http://pngu.mgh.harvard.edu/purcell/plink/).
To assess whether, in case of a trait/disease with LD overlap (r2≥0.8) between the GWAS Catalog and the eQTL catalog, the eGenes were present in the list of the GWAS target genes we proceeded as follows.
I. We considered the GWAS variants having a cis-eQTL in LD (r2≥0.8) and a p-value < 5x10⁻⁸ (GWAS-eQTL variants). Because cis effects were defined based on the distance from the TSS of the target gene as annotated in GENCODE V19, eGenes for which we didn’t find an alias in GENCODE V19 were automatically excluded from the downstream steps.
II. We obtained the independent loci by clumping the GWAS-eQTLs variants with plink (default parameters, r2≥0.5, distance 250Kb). Genotypes were from 1000 Genomes VCF files containing only the GWAS-eQTLs variants. We split the GWAS variants list by chromosome to speed up the pipeline.
22 III. For each independent locus we listed all the proposed target genes by the
GWAS catalog for a given trait/disease and the eGenes of our eQTL catalog.
IV. We excluded those independent loci in which there was at least one proposed gene in the GWAS Catalog for which we didn’t find an alias in GENCODE V19.
V. We determined for how many independent loci every (or at least one) eGene associated with that locus was also present in the list of the GWAS target genes.
23
LinDA Browser implementation.
The server is based on apache HTTP and cgi and python. The web browser pages are based on HTML, Bootstrap (https://getbootstrap.com), jQuery (https://jquery.com), DataTables (https://datatables.net), JSZip (https://stuk.github.io/jszip/) and AjaxJs ad d3 (https://d3js.org).
The web browser engine is based on python, tabix ( (Li H. , 2011)) and bgzip. The largest genomic data (the eQTLs catalog, the LD and the Allele frequency) are bgzip compressed and tabix indexed for fast queries. CGI and pysam78 python libraries are used for querying and fetching results. In
addition to d3, images have been generated with Gimp (used for pixel based images, https://www.gimp.org) and Inkscape (used for vectorial images, https://inkscape.org/en/).
LD data has been stored has been generated and stored as following. We computed the LD by using the 1000 genomes genotypes with a similar strategy as above. Here in particular we generated a VCF for each population and subpopulation (32 VCFs in total) and by using vcftools we computed the LD for each possible pair of variants and kept only those in r2>0.4. We then indexed the outputs by using tabix79.
Allele Frequency data has been generated and stored as following. We computed the Allele Frequency (AF) for each human population by using the 1000 Genomes data. Briefly, genotypes in VCF format for each population and subpopulation generated above, have been processed with vcftools to compute the Allele Frequency.
24
C
ONCLUSIONSWe built, in our knowledge, the largest comprehensive collection of eQTLs findings thus far, collecting studies published from 2007 to 2017.
Our eQTL-Catalog can be used to easily access to public data in order to simplify the interpretation of the GWAS signals, especially allowed to prioritize their causal genes, infer drug targets and the desired direction of therapeutic modulation.
It helps in identify possible pleiotropic effects and can be also used as a reference to measure the degree of novelty for feature eQTLs studies.
Furthermore, it is provided with a user friendly web interface (LinDA) which already contains other QTL studies (such as splicing, epigenetic, proteomic QTLs already implemented and Metabolomic and Microbiota composition QTLs in future) to facilitate the interpretation of the molecular impact of the GWAS variants.
R
EFERENCES1. Hirschhorn, J. N. & Daly, M. J. Genome-wide association studies for common diseases and complex traits. Nat. Rev. Genet. 6, 95–108 (2005).
2. Reich, D. E. & Lander, E. S. On the allelic spectrum of human disease. Trends Genet. 17, 502–10 (2001).
3. Bush, W. S. & Moore, J. H. Chapter 11: Genome-Wide Association Studies. PLoS Comput. Biol. 8, e1002822 (2012).
4. Burton, P. R. et al. Genome-wide association study of 14,000 cases of seven common diseases and 3,000 shared controls. Nature 447, 661–678 (2007).
5. Stranger, B. E., Stahl, E. A. & Raj, T. Progress and Promise of Genome-Wide Association Studies for Human Complex Trait Genetics. Genetics 187, 367–383 (2011).
6. Visscher, P. M., Brown, M. A., McCarthy, M. I. & Yang, J. Five Years of GWAS Discovery. Am. J. Hum. Genet. 90, 7–24 (2012). 7. Welter, D. et al. The NHGRI GWAS Catalog, a curated resource of
SNP-trait associations. Nucleic Acids Res. 42, D1001–D1006 (2014). 8. MacArthur, J. et al. The new NHGRI-EBI Catalog of published
genome-wide association studies (GWAS Catalog). Nucleic Acids Res. 45, D896–D901 (2017).
9. Project, G. et al. An integrated map of genetic variation from 1,092 human genomes. Nature 135, 0–9 (2012).
10. Frazer, K. A., Murray, S. S., Schork, N. J. & Topol, E. J. Human genetic variation and its contribution to complex traits. Nat. Rev. Genet. 10, 241–251 (2009).
11. Consortium, T. E. P. An integrated encyclopedia of DNA elements in the human genome. Nature 489, 57–74 (2012).
12. Manolio, T. A. Genomewide Association Studies and Assessment of the Risk of Disease. N. Engl. J. Med. 363, 166–176 (2010).
M. Linking disease associations with regulatory information in the human genome. Genome Res. 22, 1748–1759 (2012).
14. Hindorff, L. A. et al. Potential etiologic and functional implications of genome-wide association loci for human diseases and traits. Proc. Natl. Acad. Sci. U. S. A. 106, 9362–7 (2009).
15. Ragvin, A. et al. Long-range gene regulation links genomic type 2 diabetes and obesity risk regions to HHEX, SOX4, and IRX3. Proc. Natl. Acad. Sci. 107, 775–780 (2010).
16. Frayling, T. M. et al. A Common Variant in the FTO Gene Is
Associated with Body Mass Index and Predisposes to Childhood and Adult Obesity. Science (80-. ). 316, 889–894 (2007).
17. Dina, C. et al. Variation in FTO contributes to childhood obesity and severe adult obesity. Nat. Genet. 39, 724–726 (2007).
18. Church, C. et al. Overexpression of Fto leads to increased food intake and results in obesity. Nat. Genet. 42, 1086–1092 (2010).
19. Fischer, J. et al. Inactivation of the Fto gene protects from obesity. Nature 458, 894–898 (2009).
20. Gao, X. et al. The Fat Mass and Obesity Associated Gene FTO Functions in the Brain to Regulate Postnatal Growth in Mice. PLoS One 5, e14005 (2010).
21. Smemo, S. et al. Obesity-associated variants within FTO form long-range functional connections with IRX3. Nature 507, 371–375 (2014).
22. Claussnitzer, M. et al. FTO Obesity Variant Circuitry and Adipocyte Browning in Humans. N. Engl. J. Med. 373, 895–907 (2015).
23. Herman, M. A. & Rosen, E. D. Making Biological Sense of GWAS Data: Lessons from the FTO Locus. Cell Metab. 22, 538–539 (2015). 24. Nicolae, D. L. et al. Trait-Associated SNPs Are More Likely to Be
eQTLs: Annotation to Enhance Discovery from GWAS. PLoS Genet.
6, e1000888 (2010).
25. Emilsson, V. et al. Genetics of gene expression and its effect on disease. Nature 452, 423–428 (2008).
26. Cookson, W., Liang, L., Abecasis, G., Moffatt, M. & Lathrop, M. Mapping complex disease traits with global gene expression. Nat. Rev. Genet. 10, 184–194 (2009).
27. Westra, H.-J. et al. Systematic identification of trans eQTLs as putative drivers of known disease associations. Nat. Genet. 45, 1238– 1243 (2013).
28. Lappalainen, T. et al. Transcriptome and genome sequencing uncovers functional variation in humans. Nature 501, 506–511 (2013).
29. Lonsdale, J. et al. The Genotype-Tissue Expression (GTEx) project. Nat. Genet. 45, 580–585 (2013).
30. Battle, A. et al. Characterizing the genetic basis of transcriptome diversity through RNA-sequencing of 922 individuals. Genome Res.
24, 14–24 (2014).
31. Nica, A. C. et al. Candidate Causal Regulatory Effects by Integration of Expression QTLs with Complex Trait Genetic Associations. PLoS Genet. 6, e1000895 (2010).
32. Fairfax, B. P. et al. Genetics of gene expression in primary immune cells identifies cell type-specific master regulators and roles of HLA alleles. Nat. Genet. 44, 502–510 (2012).
33. Lawrenson, K. et al. Cis-eQTL analysis and functional validation of candidate susceptibility genes for high-grade serous ovarian cancer. Nat. Commun. 6, 8234 (2015).
34. Gamazon, E. R., Huang, R. S., Cox, N. J. & Dolan, M. E.
Chemotherapeutic drug susceptibility associated SNPs are enriched in expression quantitative trait loci. Proc. Natl. Acad. Sci. 107, 9287– 9292 (2010).
35. Folkersen, L. et al. Applying genetics in inflammatory disease drug discovery. Drug Discov. Today 20, 1176–1181 (2015).
36. Pritchard, J.-L. E., O’Mara, T. A. & Glubb, D. M. Enhancing the Promise of Drug Repositioning through Genetics. Front. Pharmacol.
Druggable Target Identification and Validation. Trends Genet. 34, 558–570 (2018).
38. Nica, A. C. & Dermitzakis, E. T. Expression quantitative trait loci: present and future. Philos. Trans. R. Soc. B Biol. Sci. 368, 20120362– 20120362 (2013).
39. Heap, G. A. et al. Complex nature of SNP genotype effects on gene expression in primary human leucocytes. BMC Med. Genomics 2, 1– 13 (2009).
40. Stranger, B. E. et al. Population genomics of human gene expression. Nat. Genet. 39, 1217–1224 (2007).
41. Heinzen, E. L. et al. Tissue-Specific Genetic Control of Splicing: Implications for the Study of Complex Traits. PLOS Biol. 6, e1000001 (2008).
42. Dimas, A. S. et al. Common regulatory variation impacts gene expression in a cell type-dependent manner. Science (80-. ). 325, 1246–1250 (2009).
43. Nica, A. C. et al. The Architecture of Gene Regulatory Variation across Multiple Human Tissues: The MuTHER Study. PLoS Genet.
7, e1002003 (2011).
44. Aguet, F. et al. Genetic effects on gene expression across human tissues. Nature 550, 204–213 (2017).
45. Fairfax, B. P. et al. Innate Immune Activity Conditions the Effect of Regulatory Variants upon Monocyte Gene Expression. Science (80-. ). 343, 1246949–1246949 (2014).
46. Gong, J. et al. PancanQTL: Systematic identification of cis -eQTLs and trans -eQTLs in 33 cancer types. Nucleic Acids Res. 46, D971– D976 (2018).
47. Xia, K. et al. SeeQTL: A searchable database for human eQTLs. Bioinformatics 28, 451–452 (2012).
48. Li, J. et al. eSNPO: An eQTL-based SNP Ontology and SNP functional enrichment analysis platform. Sci. Rep. 6, 30595 (2016). 49. Eicher, J. D. et al. GRASP v2.0: an update on the Genome-Wide
Repository of Associations between SNPs and phenotypes. Nucleic Acids Res. 43, D799–D804 (2014).
50. Zhernakova, D. V. et al. Identification of context-dependent
expression quantitative trait loci in whole blood. Nat. Genet. 49, 139– 145 (2017).
51. Chen, L. et al. Genetic Drivers of Epigenetic and Transcriptional Variation in Human Immune Cells. Cell 167, 1398–1414.e24 (2016). 52. Giambartolomei, C. et al. Bayesian Test for Colocalisation between
Pairs of Genetic Association Studies Using Summary Statistics. PLoS Genet. 10, e1004383 (2014).
53. Hormozdiari, F. et al. Colocalization of GWAS and eQTL Signals Detects Target Genes. Am. J. Hum. Genet. 99, 1245–1260 (2016). 54. Need, A. C. & Goldstein, D. B. Next generation disparities in human
genomics: concerns and remedies. Trends Genet. 25, 489–494 (2009).
55. Bustamante, C. D., De La Vega, F. M. & Burchard, E. G. Genomics for the world. Nature 475, 163–165 (2011).
56. Petrovski, S. & Goldstein, D. B. Unequal representation of genetic variation across ancestry groups creates healthcare inequality in the application of precision medicine. Genome Biol. 17, 157 (2016). 57. Popejoy, A. B. & Fullerton, S. M. Genomics is failing on diversity.
Nature 538, 161–164 (2016).
58. Martin, A. R. et al. Human Demographic History Impacts Genetic Risk Prediction across Diverse Populations. Am. J. Hum. Genet. 100, 635–649 (2017).
59. Zeller, T. et al. Genetics and Beyond – The Transcriptome of Human Monocytes and Disease Susceptibility. PLoS One 5, e10693 (2010). 60. Gibbs, J. R. et al. Abundant Quantitative Trait Loci Exist for DNA
Methylation and Gene Expression in Human Brain. PLoS Genet. 6, e1000952 (2010).
1418–1428 (2014).
62. Li, Q. et al. Integrative eQTL-Based Analyses Reveal the Biology of Breast Cancer Risk Loci. Cell 152, 633–641 (2013).
63. Ding, J. et al. Gene expression in skin and lymphoblastoid cells: Refined statistical method reveals extensive overlap in cis-eQTL signals. Am. J. Hum. Genet. 87, 779–789 (2010).
64. Zou, F. et al. Brain Expression Genome-Wide Association Study (eGWAS) Identifies Human Disease-Associated Variants. PLoS Genet. 8, e1002707 (2012).
65. Grundberg, E. et al. Global Analysis of the Impact of Environmental Perturbation on cis-Regulation of Gene Expression. PLoS Genet. 7, e1001279 (2011).
66. Lee, M. N. et al. Common Genetic Variants Modulate Pathogen-Sensing Responses in Human Dendritic Cells. Science (80-. ). 343, 1246980–1246980 (2014).
67. Pala, M. et al. Population- and individual-specific regulatory variation in Sardinia. Nat. Genet. 49, 700–707 (2017). 68. Andiappan, A. K. et al. Genome-wide analysis of the genetic
regulation of gene expression in human neutrophils. Nat. Commun. 6, 7971 (2015).
69. Harrow, J. et al. GENCODE: The reference human genome
annotation for The ENCODE Project. Genome Res. 22, 1760–1774 (2012).
70. Fehrmann, R. S. N. et al. Trans-eQTLs Reveal That Independent Genetic Variants Associated with a Complex Phenotype Converge on Intermediate Genes, with a Major Role for the HLA. PLoS Genet. 7, e1002197 (2011).
71. Tripathi, R., Chakraborty, P. & Varadwaj, P. K. Unraveling long non-coding RNAs through analysis of high-throughput RNA-sequencing data. Non-coding RNA Res. 2, 111–118 (2017).
72. Finan, C. et al. The druggable genome and support for target
identification and validation in drug development. Sci. Transl. Med.
73. Boyle, E. A., Li, Y. I. & Pritchard, J. K. An Expanded View of Complex Traits: From Polygenic to Omnigenic. Cell 169, 1177–1186 (2017).
74. Hinrichs, A. S. et al. The UCSC Genome Browser Database: update 2006. Nucleic Acids Res. 34, D590–D598 (2006).
75. Gray, K. A., Yates, B., Seal, R. L., Wright, M. W. & Bruford, E. A. Genenames.org: the HGNC resources in 2015. Nucleic Acids Res. 43, D1079–D1085 (2015).
76. 1000 Genomes Project Consortium, R. A. et al. A global reference for human genetic variation. Nature 526, 68–74 (2015).
77. Purcell, S. et al. PLINK: A Tool Set for Whole-Genome Association and Population-Based Linkage Analyses. Am. J. Hum. Genet. 81, 559–575 (2007).
78. Li, H. et al. The Sequence Alignment/Map format and SAMtools. Bioinformatics 25, 2078–2079 (2009).
79. Li, H. Tabix: fast retrieval of sequence features from generic TAB-delimited files. Bioinformatics 27, 718–719 (2011).