UNIVERSITÀ DEGLI STUDI DI SASSARI
SCUOLA DI DOTTORATO DI RICERCA Scienze e Biotecnologie dei Sistemi Agrari e Forestali e delle Produzioni Alimentari
Indirizzo Scienze e Tecnologie Zootecniche
Ciclo XXVI
APPROACHES FOR INVESTIGATING GENOME
VARIABILITY IN CATTLE
dr. Gabriele Marras
Direttore della Scuola prof. Alba Pusino
Referente di Indirizzo prof. Nicolò P.P. Macciotta
Docente Guida prof. Nicolò P.P. Macciotta
Tutor dott.ssa Silvia Sorbolini dott. Giustino Gaspa
UNIVERSITÀ DEGLI STUDI DI SASSARI
SCUOLA DI DOTTORATO DI RICERCA Scienze e Biotecnologie dei Sistemi Agrari e Forestali e delle Produzioni Alimentari
Indirizzo Scienze e Tecnologie Zootecniche
Ciclo XXVI
La presente tesi è stata prodotta durante la frequenza del corso di dottorato in “Scienze e Biotecnologie dei Sistemi Agrari e Forestali e delle Produzioni Alimentari” dell’Università degli Studi di Sassari, a.a. 2012/2013 - XXVI ciclo, con il supporto di una borsa di studio finanziata con le risorse del P.O.R. SARDEGNA F.S.E. 2007-2013 - Obiettivo competitività regionale e occupazione, Asse IV Capitale umano, Linea di Attività l.3.1 “Finanziamento di corsi di dottorato finalizzati alla formazione di capitale umano altamente specializzato, in particolare per i settori dell’ICT, delle nanotecnologie e delle biotecnologie, dell'energia e dello sviluppo sostenibile, dell'agroalimentare e dei materiali tradizionali”.
Gabriele Marras gratefully acknowledges Sardinia Regional Government for the financial support of her PhD scholarship (P.O.R. Sardegna F.S.E. Operational Programme of the Autonomous Region of Sardinia, European Social Fund 2007-2013 - Axis IV Human Resources, Objective l.3, Line of Activity l.3.1.)
La mente è come un paracadute. Funziona solo se si apre.
Index
CHAPTER 1General introduction
INTRODUCTION 2
From phenotype to genotype 5
The molecular (r)evolution 6
Encoding DNA 8
Intergenic DNA 9
Genomic Tools For Investigating Differences Between Individuals 10
OBJECTIVE OF THE THESIS 16
REFERENCES 17
CHAPTER 2
Use of Locally Weighted Scatterplot Smoothing (LOWESS) regression to study selection signatures in Piedmontese and Italian Brown cattle breeds
SUMMARY 26
INTRODUCTION 27
MATERIALS AND METHODS 28
RESULTS AND DISCUSSION 31
CONCLUSIONS 44
REFERENCES 46
CHAPTER 3
Detection of selection signatures in five Italian cattle breeds with different productive specialization
ABSTRACT 53
INTRODUCTION 53
MATERIAL AND METHODS 55
Experimental population and genotypic data 55
Detection of signatures of selection 56
RESULTS AND DISCUSSION 59
CONCLUSIONS 69
REFERENCES 70
CHAPTER 4
Analysis Of Distribution Of Runs Of Homozygosity And Of Their Relationship With Inbreeding In Five Cattle Breeds Farmed In Italy
ABSTRACT 76
INTRODUCTION 77
Inbreeding definition, its measure and consequences 77 A Measure of Autozigosity derived from SNP data: Run of Homozigosity 78 Usefulness of ROH in animal breeding and formulas to calculate molecular inbreeding 79
OBJECTIVE OF THE WORK 80
MATERIALS AND METHODS 81
Data 81
Criteria used for ROH detection 81
RESULTS AND DISCUSSION 83
Number of ROH 83
Average Length of ROH and Sum of ROH 87
Length of ROH vs Number of ROH 91
Inbreeding measure based on ROH 93
CONCLUSION 100 REFERENCES 102 CHAPTER 5 General Conclusions GENERAL CONCLUSIONS 106 SUPPLEMENTAL MATERIAL
“Use of Locally Weighted Scatterplot Smoothing (LOWESS) regression to study selection signatures in
Piedmontese and Italian Brown cattle breeds” 110
“Detection of selection signatures in five Italian cattle breeds with different productive specialization” 140
CHAPTER 1
INTRODUCTION
Evolution is a continuous and progressive process of small mutations whose accumulation results in a huge variability among individuals. These mutations can be both favorable and unfavorable and represents the basis of the biological ability to adapt to different environments. In the human genome it has been estimated that approximately 70-75% of the mutations affecting a change in amino acid undergo a negative selection. This is because strongly deleterious mutations are eliminated immediately, or within a few generations. In contrast, a mutation can bring a positive benefit to the organism and through a selection artificial or natural, is also maintained in successive generations (Nielsen et al., 2007).
Domestication is considered one of the first event responsible for the phenotypic changes. In this process, which lasted thousands of years, man has selected plants and animals to be used as a support for his own growth. The first domesticated animal was the dog around 15,000 years ago. Only later, around 10,000 years ago, were selected cattle, sheep, goats and pigs as a source of fresh food (FAO, 2007; Toro and Màki-Tanila, 2007; Ajmone-Marsan et al., 2010). The main purposes of animal domestication have been the reduction of aggressiveness, the increase of the degree of adaptation, and the enhancement of some production characteristics (Toro and Màki-Tanila, 2007).
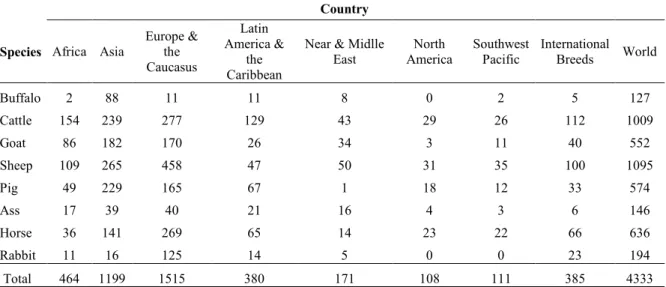
The combination of artificial selection and evolutionary processes has led the appearance of new breeds (Ross-Ibarra et al., 2007). In the world there are more than 4,000 breeds of farm animal species (Table 1), including local and international breeds. More of 50% of local breeds are present in Europe (about 1,500 breeds) and Asia (about 1,200 breeds). Sheep and cattle are among the most represented livestock species in the world.
Cattle is an interesting model for studying the molecular basis of genetic variability between individuals, due to the intense action of genetic improvement operated by man. Through the combination of natural and artificial selection, there has been a gradual and continuous change in the phenotype that led to the about 1,000 local breeds currently distributed worldwide (FAO, 2007). The modern species of the genus Bos are the Bos
Taurus and the Bos indicus. They are both descendant of the Bos primigenius (Bradley et
al., 1996). The divergence between the two species has been estimated between 250,000 and 850,000 years ago and their domestication occurred separately in near East and India, respectively (Bolormaa et al., 2013).
Table 1. Number of breeds of farm animals in the world (FAO, 2007) Country
Species Africa Asia
Europe & the Caucasus Latin America & the Caribbean
Near & Midlle East North America Southwest Pacific International Breeds World Buffalo 2 88 11 11 8 0 2 5 127 Cattle 154 239 277 129 43 29 26 112 1009 Goat 86 182 170 26 34 3 11 40 552 Sheep 109 265 458 47 50 31 35 100 1095 Pig 49 229 165 67 1 18 12 33 574 Ass 17 39 40 21 16 4 3 6 146 Horse 36 141 269 65 14 23 22 66 636 Rabbit 11 16 125 14 5 0 0 23 194 Total 464 1199 1515 380 171 108 111 385 4333
The genetic variability of a population results from the action of demographic (drift, migrations, mating), genetic forces (mutations, recombination and selection) (Cavalli-Sforza and Feldman, 2003) or of random processes (Windig and Engelsma, 2010). The modification of phenotypes caused by selection involved not only morphological features but, as expected, also traits of economic interest. In particular, in the last decades artificial selection has resulted in the development of specialized cattle breeds (dairy, beef) that represent the largest part of the cattle stock in many developed countries. The other main category is represented by local breeds, i.e. those that had been lees subjected to selection and whose main feature is represented by a great adaptability to specific environment. If it is widely accepted that selection has been one of the major driving forces for breed differentiation, on the other hand it has to be remembered that the high selection pressure often resulted in the elimination of less favorable alleles thus reducing the genetic variability within breeds. Generally, the effects of artificial selection on the genome tend to drastically reduce the levels of heterozygosity (Andersson, 2012). For positive mutations, selected alleles tend to become more frequent in the population. (Nielsen, 2005; Scheinfeldt and Tishkoff, 2013). This selection does not only affect a particular allele, but can also involve neighbouring neutral sites. This phenomenon is called hitch-hiking (Smith and Haigh, 1974). In a structured population, the fixation of a beneficial allele distorts patterns of variation also at linked sites leaving distinct signatures from that expected under the standard sweep model (Przeworski et al., 2005). To better understand the genetic basis of phenotypic variation induced by directional selection the pattern of heterozygosity can be studied in domestic species (Wiener and Wilkinson, 2011).
In cattle, the effective population size of highly selected breeds experienced a further huge reduction due to the widespread use of artificial insemination (Hayes et al., 2009). On the contrary, the poor or absence of selection for local breeds has guaranteed the maintenance of a large allelic richness. The recent development of studies on biodiversity of cattle breeds, due to the action of several international research projects (Elsik et al., 2009), has highlighted the role of these populations as reservoirs of allelic diversity. The maintenance of genetic diversity of local breeds represents a key point for their contribution to current or future traits of interest and for their potential role in future breeding options (Groeneveld et al., 2010).
As a consequence of the different evolution history of the various breeds, two main sources of genetic variability can be considered: between and within breeds, respectively. These two have different meaning and different practical relevance. The study of the genetic basis of differences between two breeds with different production aptitude (for example beef and dairy) may be of great help for identifying genomic regions involved in the genetic determinism of the different categories of traits. On the other hand, genetic differences between animals of the same breed represent the source of variation that is exploited by purebred selection programmers.
The variability between individuals has been investigated for long time. In the specific case of livestock, the understanding of the genetic architecture of complex traits remains one of the main goals for animal breeders and evolutionary geneticists (Stranger et al., 2011). Describing the genetic architecture of a phenotype means to estimate the heritability, the number and distribution of loci underlying phenotypic variation, as well as to highlight possible interaction phenomena such as dominance, epistasis or pleiotropy (Stranger et al., 2011). The unravelling of the genomic architecture of a polygenic trait is fundamental to study variability within and between population.
The tools changed according to achievements in molecular and quantitative genetics, nanotechnology, computer science, statistics and bioinformatics. Such a dynamic situation has resulted in a progressive increase of the power of investigation and in a subsequent continuous improvement of the knowledge on the molecular basis of genetic variability. Changes as the switch from phenotypic to molecular markers or the outbreak of molecular genetics had a great impact not only on the knowledge about the organism investigated but also on the upgrade of theoretical models used to explain the genetics of the different traits.
From phenotype to genotype
First characteristics of animals used to measure diversity were the external phenotypes as, for example size, morphology, coat colour, polledness, double muscling and some production traits (milk yield, growth, wool). These traits are characterized by different level of genetic complexity: single gene for “double muscle” (Kambadour et al., 1996); few genes with large effect but complicated relationships between loci for coat colour (Capitan et al., 2009) and for polledness (Seichter et al., 2012); many loci with small effects as in the case of type traits (Hayes et al., 2010); several loci with both large and small effects for many yield traits. In case of single genes, the identification of underlying genetic structure from the phenotype variability was complicated by the existence of dominance (as in the case of polledness) or exceptions of Mendelian inheritance such as epistasis (as the case of coat colour). Identification of genotypes was also based on the use of pedigree information. These external phenotypes have been fundamental for the definition of the standard characteristics of the various breeds.
A particular case of measure of genetic difference is the evaluation of the genetic merit of candidates to selection. This measure is essential in breeding programs, where it is used to rank individuals in order to plan matings aimed at obtaining a genetic improvement in the offspring. The genetic merit is estimated through the breeding value (EBV), which is obtained by combining phenotypes and pedigree information using a suitable statistical methodology as for example BLUP (Henderson, 1975). EBV have been conceived according to the infinitesimal model theory of Fisher, that assumes that observed phenotypes are determined by an infinite number of loci, each with an infinitesimal additive effect plus the deviation due to environmental effect (Fisher, 1918; Falconer and Mackay, 1996). The use of EBV to select best animals has resulted in a great enhancement of performances in specialised breeds: for example, the average 305d milk production per cow for the Italian Holstein shifted from less than kg/year 7000 in 1985 up to kg/year 9000 of milk in 2012 (www.anafi.it). For beef traits, the average daily gain of young bulls during performance test increased from kg/d 1.51 and kg/d 1.61 in 1990 to kg/d 1.82 and kg/d 1.92 in 2011 for Marchigiana and Chianina breeds, respectively (ANABIC, 2012). Since the middle of the last century, however, the availability of new laboratory techniques made feasible the use of biochemical markers. The widespread use of electrophoresis allowed for detecting the genotype of individuals for many loci coding for proteins expressed in the blood or milk, or in many organs and tissues. Biochemical markers have represented a powerful tool for studying genetic diversity. In livestock they have been used
for many purposes as the study of genetic distances between populations, the identification of individuals, the parentage testing (as the blood groups), the identification of monozygotic twins (Masina et al., 1989; Katanen et al., 1999). Many researches have been carried out on relationships between polymorphisms and traits of economic interest: examples are studies on milk protein genes in cow and goat ( Aschaffenburg, 1966; Aleandri et al., 1990; Ng-Kway-Hang, 1997; Kantanen et al., 2000), the phosphohexose
isomerase (PHI) for meat quality in pigs (Davies et al., 1988).
Main limitations of biochemical markers were the relative low degree of polymorphism (i.e. limited number of alleles) and the need for phenotypic expression, as the case of milk protein alleles (expressed only in lactating females). A main consequence of the dependence from phenotypes was that this approach was able to detect genetic variation only in the expressed portion of the genome. But, also when the use of biochemical markers was widespread, the disproportion between the estimated number of genes (around a hundred thousand) and the size of the whole genome (3*109 bp in mammals) was evident. These issues were addressed by the advent of molecular genetics, which allowed the study of the basis of genetic variability at DNA level.
The molecular (r)evolution
The development of molecular genetics technologies that has occurred during the last five decades and the integration with tools of quantitative genetics has had a tremendous impact on the study of genetic variability of farm animals (Przeworski et al., 2005). Whole genome sequencing and mapping allowed the quantification of differences between genomes of various species, the development of new categories of powerful genetic markers, the deciphering of the genetic architecture of traits of importance, and the study of structural element that contribute to the genetic differences between individuals (Windig and Engelsma, 2010).
First sequencing analyses of living organisms were performed on bacteria (Haemophilus
influenzae), yeasts (Saccharomyces cerevisiae) and insects (Drosophila melanogaster).
Only in 2001 it was possible to sequence the entire human genome (Lander et al., 2001). Afterwards, other organisms such as plants (i.e. Arabidopsis thaliana) and animals (i.e. cattle, dog, mice) have been sequenced (Griffiths, 2013).
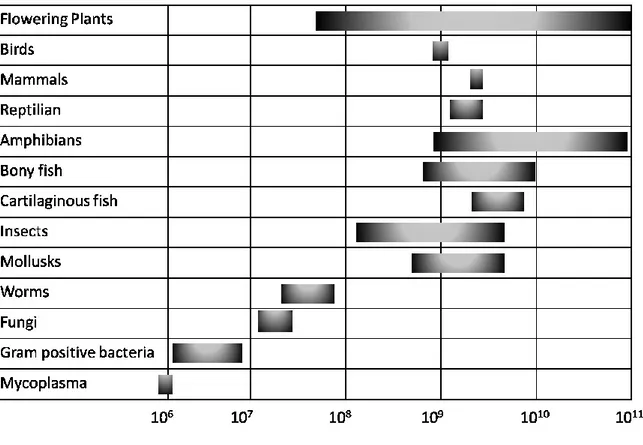
Table 2 reports the comparison between the size of the genome (in number of base pairs) for different living organisms. A huge variation could be clearly observed.
Sequencing has allowed not only the comparison between sizes of the genomes of different species, but also the detection of differences in their structural organization. By using
molecular genetics techniques, scientists have realised that phenotypic variability was not only due to differences in the expressed sequences (genes), but could also reside in portions of the genome that were not directly expressed.
Table 2 Genome size in different living organisms (Lewin, 2004).
The organization of the genomes of eukaryotic cells is characterized by two main types of DNA: the encoding DNA, which comprises all the genes; and the intergenic DNA, that is mainly represented by transposons and retrotransposons (Lander et al., 2001).
The encoding DNA, represents a small portion of the genomes (about 3% in the human genome) (Kass and Batzer, 2001), whereas most part is represented by intergenic DNA, also called junk DNA, which is divided into unique DNA and repeated sequences, respectively.
Thanks to the analysis of genomic sequences, it is now possible to compare different organisms. For example, it was possible to determine that 5% of the human genome has been strongly conserved during evolution (Strachan and Read, 2011). Moreover, among human populations, the individual genetic diversity was quantified in ~0.1% base pairs.
This apparent little number represents however differences among 3.2 billions base pairs. The variability among genomes resides mainly in the intergenic DNA, which is characterized by repeated sequences, and to a lesser degree, in regions of the encoding DNA.
Encoding DNA
The part of DNA which consists of genes is highly conserved across species, i.e. sequences are similar in structure and position. The first studies to identify genes were made on mutant organisms of Drosophila melanogaster, by exploiting the difference between phenotypes. Advanced technologies have made also possible to identify genes in which mutations do not generate phenotypic changes (Lewin, 2004; Griffiths, 2013). This has speeded up the process of identifying and cataloging genes. To date, in humans have been identified about 21,000 genes that represent 1.5% of the total genome (http://www.ensembl.org/index.html).
The studies of genetic divergence has given the opportunity to identify genes that have the same biological function in different species. These genes, called homologues can be divided into two categories: the orthologous, which are derived from a common ancestor; and the paralogs, which are represented by genes that have undergone a process of duplication and independent evolution in the same genome (Griffiths, 2013). In mouse, about 80% of the 25,000 annotated genes have been identified as orthologous with the genes present in humans, although a phylogenetic separation occurred 75 million years ago (Guénet, 2005).
It has been estimated that there are about 26,000 genes in the cattle genome. A comparison with genes of other six different species (dog, human, mouse, rat, opossum, platypus), showed that about 14,000 genes are orthologous. (Elsik et al., 2009). Another study conducted on a set of genes of cattle, human, dog and mouse, showed that about 3,800 bovine genes are not orthologs between the species being compared. (Mazza et al., 2009). A very interesting aspect that emerged from bioinformatics studies, is the presence of non-coding genes defined pseudogenes. These sequences are numerous in the genome, and can arise for accumulation of nonsense mutations or by the destruction of the gene function (Griffiths, 2013).
Intergenic DNA
The intergenic DNA is the represented by all those sequences which do not apparently exhibit a biological function. These regions have been previously defined “junk DNA” or “non-coding sequences”. They are characterized by a high genetic variability between individuals 60-70%) (Kass and Batzer, 2001).
The intergenic DNA can be divided into two categories: unique DNA, which consists of regulatory sequences, which modulate gene expression (promoters and enhancers); and the repeated DNA, which consist of repeated sequences. These sequences in turn are divided into moderately and highly repeated sequences, respectively (Lewin, 2004).
The unique DNA contain promoters that are located upstream of the gene and are divided into three highly conserved sequences (TATA box, CAAT box, GC box). The enhancers are located distant from the gene in position upstream or downstream and play the role of promoting the frequency of transcription (Lewin, 2004).
The repeated sequences are mainly represented by transposons, genomic elements that move within the genome with a mechanism to cut-and-past. Within the genome could be found also retrotransposons, which are able to move within the genome using RNA as intermediate and represent the main mechanism by which copies of a sequence in the genome are generated. The amount of transposons in the genome can vary in different organisms. In fact, they may represent approximately 46% of the genome in bovine, 37% in mouse and 45% in humans. (Lander et al., 2001; Waterston et al., 2002; Lewin, 2004). In addition to transposable DNA, there are other repeated sequences that occur several times in the genome. They are represented by the satellite DNA.There are three types of satellite DNA:
Satellite DNA, consisting of sequences larger than 100 bp that may be repeated hundreds of times;
Minisatellites, which are tandem repeats of sequences that have between 10 and 100 base pairs;
Microsatellite repeats of short sequences (<6 bp) within the genome, also called Simple Sequence Repeats (SSRs) or Short Tandem Repeats (STRs).
The most widespread are the simple sequence repeats (SSR). These evenly dispersed markers are characterized by tandem repeats of 1-6 bp. and it is thought that their origin is due to slippage of DNA polymerase during DNA replication. Although it is not clear its role within the genome, the microsatellite DNA has been most studied especially for the
analysis of the genetic variability or for phylogenetic reconstructions. The amount and the kind of SSR present in the genome of different species is variable. For example, the density of these markers in the human genome can reach 3%, and the most frequent repeated sequence is the triplet AAT.
In cattle the percentage of SSR present in the genome amounts to 2.27%, and the most represented triplet is the AGC (55%), as in sheep (40%) (Elsik et al., 2009).
Microsatellites have been frequently identified in the intergenic DNA. However, studies in different organisms, report that microsatellites can localize also in the coding regions. (Moran, 1993); VanLith and VanZutphen, 1996; Edwards et al., 1998). However the amount of microsatellites present in these regions is very low and it can represent between 9-15% of the total of the SSR in the genome of vertebrates. (Chistiakov et al., 2006). Genomic Tools For Investigating Differences Between Individuals
The study of genetic variability nowadays essentially relies on the use molecular markers. Such a definition comprises DNA sequences that are abundant throughout the genome, express a large variability between individuals, could be unambiguously detected, and are transmitted to offspring with simple Mendelian inheritance. (Woolliams and Toro, 2007). The development of PCR (Polymerase Chain Reaction) technology made feasible the set up of several classes of powerful molecular markers such as RAPD (Random Amplification Polymorphic DNA), AFLP (Amplified Fragment Length Polymorphism), RFLP (Restriction Fragment Length Polymorphism) and SSR (Simple Sequence Repeat ) (Abdel-Mawgood, 2012).
The most widely used class of molecular markers in the last decades have been the microsatellites, that belong to the SSR category. There are several reasons for their success. One is represented by their high reproducibility compared to the other markers: for example, RAPD are randomly generated and are therefore not reproducible. Another important feature of microsatellites is their high degree of allele polymorphism, whereas RFLP generally have only two alleles. Moreover they are abundant throughout the genome. Last, but not least, the analysis is easy to perform: small amounts of DNA are sufficient to obtain rapid results (Vignal et al., 2002; Abdel-Mawgood, 2012) and the process can be automatized by the use of sequencers.
Microsatellites have been used in studies of animal biodiversity, mainly to study genetic distance between breeds. Researches have been carried out on different livestock species: Cattle (MacHugh et al., 1997, MacHugh et al., 1998), Sheep (Arranz et al., 2001), Goat
(Okpeku et al., 2011), Swine (SanCristobal et al., 2006), Chicken (Hillel et al., 2003). The presence of high variability of microsatellites in the genome has prompted FAO to propose a panel of 30 microsatellites for the study of animal genetic diversity for the following species: cattle, buffalo, sheep, goat, horse, donkey, camelid, pig and chicken (FAO, 2011). Microsatellites have been also extensively used in experiments carried out on several livestock species for QTL detection. They have been powerful tools to identify genomic regions involved in the genetic determinism of quantitative traits in both in studies where ad hoc populations were generated (i.e. F2 or back-cross) and in investigations carried out outbred populations, as dairy cattle breeds, using specific statistical approaches as the Daugther and the Granddaughter designs (Weller et al., 1990; Georges et al., 1995).
In spite of their great power, the use of microsatellites has experienced a relevant reduction in the last decade. Starting from the 2000’, Single Nucleotide Polymorphisms become the genetic marker of reference in animal genetics studies on biodiversity, on association phenotype-genotype and on marker assisted selection. A main reason of the success of SNP is represented by their great abundance of SNP throughout the genome, in comparison with microsatellites.
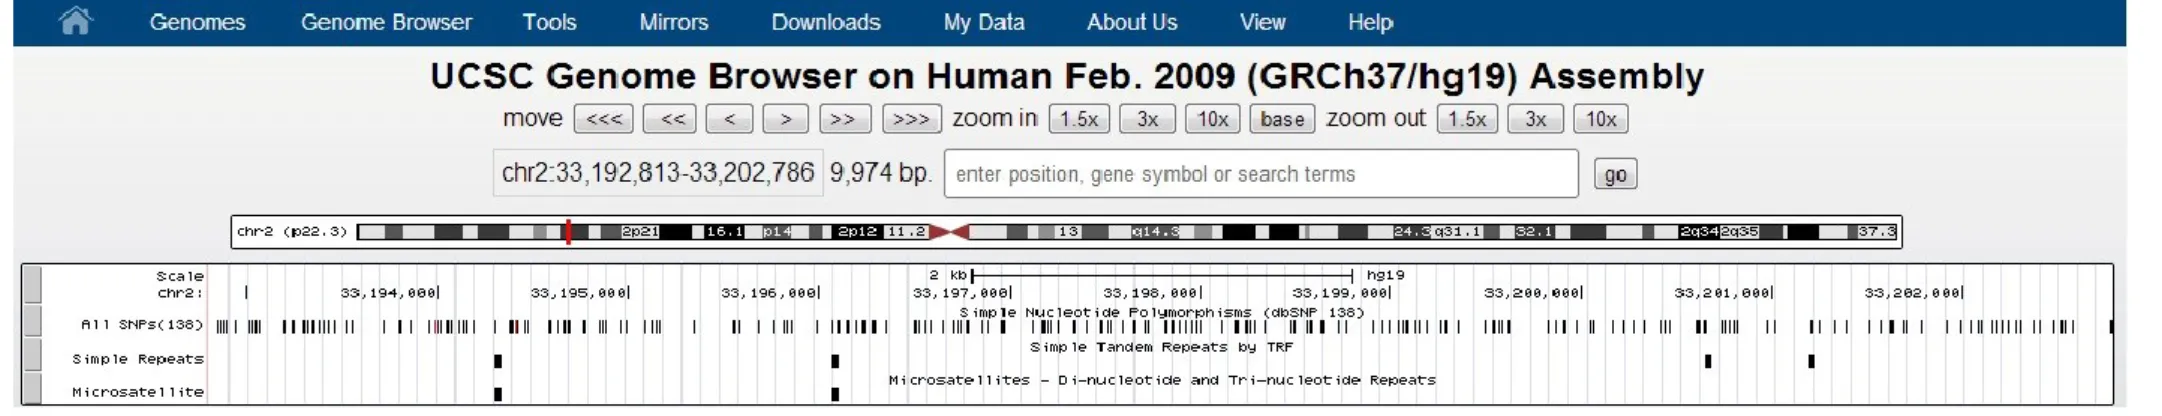
Figure 1 shows a sequence of about 10,000 bp in the human genome, along which densities of SNP and microsatellites are compared. It can be clearly seen that SSR represent a small fraction of this sequence, whereas the SNP exhibit a higher coverage and an homogeneus distribution.
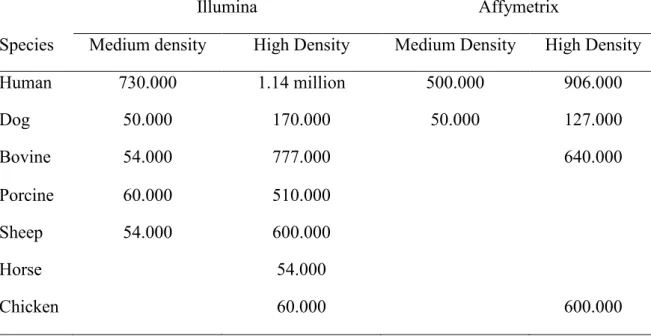
In the human genome SNPs represent about 90% of sequence variants. It has been estimated that there are about 1.42 million SNPs with an average distribution of about 1.9 per kilobase (Sachidanandam et al., 2001, Abdel-Mawgood, 2012). About 2.2 million SNPs have been discovered in the cattle genome at a density of 1 kb (Fan et al., 2010). Only a small part of these SNP is used for association studies and genetic diversity (Table 3).
A further reason for the great success of SNP as genetic markers is represented by the development of high throughput platforms (SNP arrays) able to simultaneously genotype hundred thousand SNP for each individual. Currently, there are chips with
different densities for the various species (Table 3) (http://www.illumina.com/) (http://www.affymetrix.com/estore/).
Table 3. Number of SNPs contained in the different chips produced by the Illumina and Affymetrix companies.
Illumina Affymetrix
Species Medium density High Density Medium Density High Density
Human 730.000 1.14 million 500.000 906.000 Dog 50.000 170.000 50.000 127.000 Bovine 54.000 777.000 640.000 Porcine 60.000 510.000 Sheep 54.000 600.000 Horse 54.000 Chicken 60.000 600.000
The SNP have proved to be excellent molecular markers for genetic studies. The high repeatability of the analysis and the easy interpretation of the results makes them very reliable and comparable among different laboratories (FAO, 2011). However some problems still exist, as the ascertainment bias of alleles that may occur when are genotyped individuals from different breeds of those that have been used to select SNP included in the bead-chip (Nielsen and Signorovitch, 2003).
The combined use of sequencing techniques and high density SNP genotyping has led to the discovery of structural elements of DNA sequence that may be of great importance in the identification of sources of variation between and within breeds. Examples of these structural features are copy number variations and runs of homozygosity.
The CNVs are the results of DNA deletions or duplications that lead to a change in the number of copies of a specific chromosome region. The CNVs may have a size that varies from one kilobase (kb) to several megabases (Mb). These structural variations may involve segments of DNA containing whole genes (Redon et al., 2006). The mechanisms of formation of CNV can be different, resulting in different modifications of the genome structure. The decrease or increase in the number of copies of a gene can be the results of micro-homologous recombination (Hastings et al., 2009). Currently it is estimated that the CNV cover about 12% of the human genome (Hastings et al., 2009). CNV regions have a
different lengths: 35% range between 100 bp and 1 Kb and 65% have a size between 1-10 Kb, respectively (Scherer et al., 2007) (http://projects.tcag.ca/variation/). CNV have been investigated in cattle. Kijas et al. (2011) identified 51 CNV in 10 cattle (3 Angus, 6 Brahman and one composite animal one third Bos Taurus Indicus e two thirds Bos Taurus) using a microarray-based comparative genomic hybridization (array-GCH) technique. Fadista et al. (2010), using the same technique, has identified 304 CNV summing to a total of 23 Mb on a sample of 14 Holsteins, 3 Simmental, 2 Red Danish and 1 Hereford animals. Hou et al. (2011) reports a set of about 680 regions of CNV with a total size of 139 Mb identified in a population of 539 animals using a SNP chip.
As a general definition, a run of homozygosity (ROH) is intended as a chromosomal segment where an interrupted succession of homozygotes markers occurs. There are some specific features in the definition of ROH that may vary between studies as the minimum length of a ROH, the minimum number of SNP included, the average SNP density, presence of just one heterozygote SNP (Ferencakovic et al., 2013).
The length of the ROH is connected to the degree of relationship of animals and to the inbreeding coefficient of the parents of the individual under consideration. Short ROH can be found in abundance on outbred individuals whereas long ROH are generated mainly by a recent inbreeding (Ferencakovic et al., 2013). However the length of the ROH can also be generated by a low recombination of a particular region of the genome (Kirin et al., 2010).
Runs of homozygosity have been investigated mainly in human populations. In particular, relationships between ROH and diseases (Lencz et al., 2007) and inbreeding (Woods et al., 2006) have been investigated. Studies on ROH have been also carried in livestock, mainly for estimation of inbreeding levels (Ferencakovic et al., 2012). Measures of inbreeding based on ROH could then further be used for estimation of inbreeding depression.
In cattle the estimate of ROH is a valid method for the identification of the level of inbreeding of individuals. Studies have shown that a greater length of ROH is attributable to a recent inbreeding (about 3 generation ago for ROH larger than 16 Mb) and it is a good indication of the levels of inbreeding (Ferencakovic et al., 2011, 2012). It is much more complicate to detect shorter ROH (under 4 Mb in length using 54K chipset) since most of the time these homozygous fragment are not truly Identical by descend, hence they do not represent the true level of autozigosity. Ferencakovic (2013) and Purfield (2012) demonstrate how only autozigous segment >5 Mb can be effectively detected using 54K SNP chip, for shorter true autozygous segment it is necessary to increase the SNP density.
Analysis on segments of homozygosity can be used for the study of the history of domesticated populations and to determine inbreeding coefficient when pedigree is not available or is not sufficiently depth (Purfield et. Al 2012). Purfield analyzed cattle ROH data of 42 different breeds from different continents, using a core of nearly 900 bulls of multiple breed genotyped at 800K and a group of 1,162 animals gentyped at 54K.
Furthermore, the association between phenotypes and ROH has been used to measure the inbreeding depression in US dairy Cattle. It has been shown that an increase in the values of genomic based inbreeding coefficient (FROH) lead to a lowering of production values for most of productive, reproductive traits (Bjelland et al., 2013).
OBJECTIVE OF THE THESIS
Aim of the present thesis is to study the genetic variability of cattle breeds farmed in Italy. These were selected in order to represent different origin, selection history and production aptitudes. The variation at genome level was investigated by using three approaches that allow for disentangling different aspects of the genetic difference between animal populations. One approach checked the difference between two breeds by using a modification of the Fst metric methodology, developed in order to make the signal pattern more readable through a local regression smoothing and to identify outlier signals based on statistical evidence. This study was focused a identifying genomic regions that harbor genes involved in the differences between dairy and beef cattle. Then a multi-breed investigation was performed based on the comparison between allele frequencies under the hypothesis of the binomial distributions. The research was mainly aimed at looking for genes shared between breeds grouped according to production aptitudes. Finally a third study was carried out to analyse the structural differences in the genome by investigating the variation of the distribution of ROH between breeds. Relationships between runs of homozygosity features and inbreeding coefficients have been investigated within and between breeds.
REFERENCES
http://jul2012.archive.ensembl.org/index.html http://www.anafi.it/
Abdel-Mawgood, A. L. 2012. DNA Based Techniques for Studying Genetic Diversity, Genetic Diversity in Microorganisms. Genetic Diversity in Microorganisms.
Ajmone-Marsan, P., Garcia, J. F., Lenstra, J. A. & Globaldiv, C. 2010. On the Origin of Cattle: How Aurochs Became Cattle and Colonized the World. Evolutionary Anthropology, 19, 148-157.
Aleandri, R., Buttazzoni, L. G., Schneider, J. C., Caroli, A. & Davoli, R. 1990. The Effects Of Milk Protein Polymorphisms On Milk Components And Cheese-Producing Ability. Journal of Dairy Science, 73, 241-255.
Aschaffenburg, R. 1966. Modified procedure of starch gel electrophoresis for β-casein phenotyping. J. Dairy Sci. 49: 1284.
Associazione Italiana Allevatori Bovini Italiani Carne (ANABIC). 2012. Annuario.
Andersson, L. 2012. How selective sweeps in domestic animals provide new insight into biological mechanisms. Journal of Internal Medicine, 271, 1-14.
Arranz, J. J., Bayón, Y. & San Primitivo, F. 2001. Differentiation among Spanish sheep breeds using microsatellites. Genetics Selection Evolution, 33, 529-542.
Bjelland, D. W., Weigel, K. A., Vukasinovic, N. & Nkrumah, J. D. 2013. Evaluation of inbreeding depression in Holstein cattle using whole-genome SNP markers and alternative measures of genomic inbreeding. Journal of Dairy Science, 96, 4697-4706.
Bolormaa, S., Pryce, J. E., Kemper, K. E., Hayes, B. J., Zhang, Y., Tier, B., Barendse, W., Reverter, A. & Goddard, M. E. 2013. Detection of quantitative trait loci in Bos indicus and Bos taurus cattle using genome-wide association studies. Genetics Selection Evolution, 43.
Bradley, D. G., Machugh, D. E., Cunningham, P. & Loftus, R. T. 1996. Mitochondrial diversity and the origins of African and European cattle. Proceedings of the National Academy of Sciences of the United States of America, 93, 5131-5135.
Capitan, A., Grohs, C., Gautier, M. & Eggen, A. 2009. The scurs inheritance: new insights from the French Charolais breed. Bmc Genetics, 10, 33.
Cavalli-Sforza, L. L. & Feldman, M. W. 2003. The application of molecular genetic approaches to the study of human evolution. Nature Genetics, 33, 266-275.
Cavalli-Sforza, L. L., Menozzi, A., and Piazza, A. (1994). The History and Geography of Human Genes. Princeton: Princeton University Press
Chistiakov, D. A., Hellemans, B. & Volckaert, F. A. M. 2006. Microsatellites and their genomic distribution, evolution, function and applications: A review with special reference to fish genetics. Aquaculture, 255, 1-29.
Davies, W. , Harbitz, I., Fries, R., Strazinger, G., Hauge, J. G. 1988. Porcine malignant hyperthermia carrier detection and chromosomal assignment using a linked probe. Animal Genetics 19: 203-212.
Edwards, Y. J. K., Elgar, G., Clark, M. S. & Bishop, M. J. 1998. The identification and characterization of microsatellites in the compact genome of the Japanese pufferfish, Fugu rubripes: Perspectives in functional and comparative genomic analyses. Journal of Molecular Biology, 278, 843-854.
Elsik, C. G., Tellam, R. L., Worley, K. C., Gibbs, R. A., Abatepaulo, A. R. R., Abbey, C. A., Adelson, D. L., Aerts, J., Ahola, V., Alexander, L., Alioto, T., Almeida, I. G., Amadio, A. F., Anatriello, E., Antonarakis, S. E., Anzola, J. M., Astashyn, A., Bahadue, S. M., Baldwin, C. L., Barris, W., Baxter, R., Bell, S. N., Bennett, A. K., Bennett, G. L., Biase, F. H., Boldt, C. R., Bradley, D. G., Brinkman, F. S. L., Brinkmeyer-Langford, C. L., Brown, W. C., Brownstein, M. J., Buhay, C., Caetano, A. R., Camara, F., Carroll, J. A., Carvalho, W. A., Casey, T., Cervelatti, E. P., Chack, J., Chacko, E., Chandrabose, M. M., Chapin, J. E., Chapple, C. E., Chen, H.-C., Chen, L., Cheng, Y., Cheng, Z., Childers, C. P., Chitko-McKown, C. G., Chiu, R., Choi, J., Chrast, J., Colley, A. J., Connelley, T., Cree, A., Curry, S., Dalrymple, B., Diep Dao, M., Davis, C., de Oliveira, C. J. F., de Miranda Santos, I. K. F., de Campos, T. A., Deobald, H., Devinoy, E., Dickins, C. M., Yan, D., Dinh, H. H., De Donato, M., Donohue, K. E., Donthu, R., Dovc, P., Dugan-Rocha, S., Durbin, K. J., Eberlein, A., Edgar, R. C., Egan, A., Eggen, A., Eichler, E. E., Elhaik, E., Ellis, S. A., Elnitski, L., Ermolaeva, O., Eyras, E., Fitzsimmons, C. J., Fowler, G. R., Franzin, A. M., Fritz, K., Gabisi, R. A., Garcia, G. R., Garcia, J. F., Genini, S., Gerlach, D., German, J. B., Gilbert, J. G. R., Gill, C. A., Gladney, C. J., Glass, E. J., Goodell, J., Grant, J. R., Graur, D., et al. 2009. The Genome Sequence of Taurine Cattle: A Window to Ruminant Biology and Evolution. Science, 324, 522-528.
Fadista, J., Thomsen, B., Holm, L.-E. & Bendixen, C. 2010. Copy number variation in the bovine genome. Bmc Genomics, 11.
Fan, B., Du, Z. Q., Gorbach, D. M. & Rothschild, M. F. 2010. Development and Application of High-density SNP Arrays in Genomic Studies of Domestic Animals. Asian-Australasian Journal of Animal Sciences, 23, 833-847.
Falconer D.S., and Mackay T.F.C. Introduction to quantitative genetics. Fourth Edition. Longman, UK, 1996.
FAO. 2007. The State of the World’s Animal Genetic Resources for Food and Agriculture, edited by Barbara Rischkowsky & Dafydd Pilling. Rome.
FAO. 2011. Molecular genetic characterization of animal genetic resources. FAO Animal Production and Health Guidelines, N. 9.
Ferencakovic, M., Hamzic, E., Gredler, B., Curik, I. & Sölkner, J. 2011. Runs of homozygosity reveal genomewide autozygosity in the Austrian Fleckvieh cattle. Agriculturae Conspectus Scientificus, 76, 325-328.
Ferencakovic, M., Hamzic, E., Gredler, B., Solberg, T. R., Klemetsdal, G., Curik, I. & Soelkner, J. 2012. Estimates of autozygosity derived from runs of homozygosity:
empirical evidence from selected cattle populations. Journal of Animal Breeding and Genetics, 130, 286-293.
Ferencakovic, M., Sölkner, J. & Curik, I. 2013. Estimating autozygosity from high-throughput information: effects of SNP density and genotyping errors. Genetics Selection Evolution 2013, 45:42.
Fisher R.A. 1918. The correlation between relatives on the supposition of Mendelian inheritance. Trans. Roy. Soc. Edimburgh, 52:399-433.
Georges, M., Nielsen, D., Mackinnon, M., Mishra, A., Okimoto, R., Pasquino, A. T., Sargeant, L. S., Sorensen, A., Steele, M. R., Zhao, X. Y., Womack, J. E. & Hoeschele, I. 1995. Mapping Quantitative Trait Loci Controlling Milk-Production In Dairy-Cattle By Exploiting Progeny Testing. Genetics, 139, 907-920.
Griffiths A.J., W. S. R., Carroll S.B. 2013. Genetica. In: Zanichelli (ed.).
Groeneveld, L. F., Lenstra, J. A., Eding, H., Toro, M. A., Scherf, B., Pilling, D., Negrini, R., Finlay, E. K., Jianlin, H., Groeneveld, E. & Weigend, S. 2010. Genetic diversity in farm animals - A review. Animal Genetics, 41, 6-31.
Guénet, J. L. 2005. The mouse genome. Genome Research, 15, 1729-1740.
Hastings, P. J., Lupski, J. R., Rosenberg, S. M. & Ira, G. 2009. Mechanisms of change in gene copy number. Nature Reviews Genetics, 10, 551-564.
Hayes, B. J., Chamberlain, A. J., Maceachern, S., Savin, K., McPartlan, H., MacLeod, I., Sethuraman, L. & Goddard, M. E. 2009. A genome map of divergent artificial selection between Bos taurus dairy cattle and Bos taurus beef cattle. Animal Genetics, 40, 176-184.
Hayes, B. J., Pryce, J., Chamberlain, A. J., Bowman, P. J. & Goddard, M. E. 2010. Genetic architecture of complex traits and accuracy of genomic Prediction: Coat colour, Milk-fat percentage, and type in holstein cattle as contrasting model traits. Plos Genetics, 6.
Henderson, C. R. 1975. Best linear unbiased estimation and prediction under a selection model. Biometrics, 31, 423-447.
Hillel, J., Groenen, M. A. M., Tixier-Boichard, M., Korol, A. B., David, L., Kirzhner, V. M., Burke, T., Barre-Dirie, A., Crooijmans, R. P. M. A., Elo, K., Feldman, M. W., Freidlin, P. J., Mäki-Tanila, A., Oortwijn, M., Thomson, P., Vignal, A., Wimmers, K. & Weigend, S. 2003. Biodiversity of 52 chicken populations assessed by microsatellite typing of DNA pools. Genetics Selection Evolution, 35, 533-557 Hou, Y., Liu, G. E., Bickhart, D. M., Cardone, M. F., Wang, K., Kim, E. S., Matukumalli,
L. K., Ventura, M., Song, J., VanRaden, P. M., Sonstegard, T. S. & Van Tassell, C. P. 2011. Genomic characteristics of cattle copy number variations. Bmc Genomics, 12, 127.
Kambadur, R., Sharma, M., Smith, T. P. L. & Bass, J. J. 1997. Mutations in myostatin (GDF8) in double-muscled Belgian blue and Piedmontese cattle. Genome Research, 7, 910-916.
Kantanen, J., Olsaker, I., Adalsteinsson, S., Sandberg, K., Eythorsdottir, E., Pirhonen, K. & Holm, L. E. 1999. Temporal changes in genetic variation of North European cattle breeds. Animal Genetics, 30, 16-27.
Kantanen, J., Olsaker, I., Brusgaard, K., Eythorsdottir, E., Holm, L. E., Lien, S., Danell, B. & Adalsteinsson, S. 2000. Frequencies of genes for coat colour and horns in Nordic cattle breeds. Genetics Selection Evolution, 32, 561-576.
Kass, D. H. & Batzer, M. A. 2001. Genome Organization: Human. eLS. John Wiley & Sons, Ltd.
Kijas, J. W., Barendse, W., Barris, W., Harrison, B., McCulloch, R., McWilliam, S. & Whan, V. 2011. Analysis of copy number variants in the cattle genome. Gene, 482, 73-77.
Kirin, M., McQuillan, R., Franklin, C. S., Campbell, H., McKeigue, P. M. & Wilson, J. F. 2010. Genomic Runs of Homozygosity Record Population History and Consanguinity. Plos One, 5.
Lander, E. S., Linton, L. M., Birren, B., Nusbaum, C., Zody, M. C., Baldwin, J., Devon, K., Dewar, K., Doyle, M., Fitzhugh, W., Funke, R., Gage, D., Harris, K., Heaford, A., Howland, J., Kann, L., Lehoczky, J., Levine, R., McEwan, P., McKernan, K., Meldrim, J., Mesirov, J. P., Miranda, C., Morris, W., Naylor, J., Raymond, C., Rosetti, M., Santos, R., Sheridan, A., Sougnez, C., Stange-Thomann, N., Stojanovic, N., Subramanian, A., Wyman, D., Rogers, J., Sulston, J., Ainscough, R., Beck, S., Bentley, D., Burton, J., Clee, C., Carter, N., Coulson, A., Deadman, R., Deloukas, P., Dunham, A., Dunham, I., Durbin, R., French, L., Grafham, D., Gregory, S., Hubbard, T., Humphray, S., Hunt, A., Jones, M., Lloyd, C., McMurray, A., Matthews, L., Mercer, S., Milne, S., Mullikin, J. C., Mungall, A., Plumb, R., Ross, M., Shownkeen, R., Sims, S., Waterston, R. H., Wilson, R. K., Hillier, L. W., McPherson, J. D., Marra, M. A., Mardis, E. R., Fulton, L. A., Chinwalla, A. T., Pepin, K. H., Gish, W. R., Chissoe, S. L., Wendl, M. C., Delehaunty, K. D., Miner, T. L., Delehaunty, A., Kramer, J. B., Cook, L. L., Fulton, R. S., Johnson, D. L., Minx, P. J., Clifton, S. W., Hawkins, T., Branscomb, E., Predki, P., Richardson, P., Wenning, S., Slezak, T., Doggett, N., Cheng, J. F., Olsen, A., Lucas, S., Elkin, C., Uberbacher, E., Frazier, M., et al., 2001. Initial sequencing and analysis of the human genome. Nature, 409, 860-921.
Lencz, T., Lambert, C., DeRosse, P., Burdick, K. E., Morgan, T. V., Kane, J. M., Kucherlapati, R. & Malhotra, A. K. 2007. Runs of homozygosity reveal highly penetrant recessive loci in schizophrenia. Proceedings of the National Academy of Sciences of the United States of America, 104, 19942-19947.
Lewin, B. 2004. Il Gene VIII, Bologna.
MacHugh, D. E., Loftus, R. T., Cunningham, P. & Bradley, D. G. 1998. Genetic structure of seven European cattle breeds assessed using 20 microsatellite markers. Animal Genetics, 29, 333-340.
MacHugh, D. E., Shriver, M. D., Loftus, R. T., Cunningham, P. & Bradley, D. G. 1997. Microsatellite DNA variation and the evolution, domestication and phylogeography of taurine and Zebu cattle (Bos taurus and Bos indicus). Genetics, 146, 1071-1086.
Masina P., Rando A. & P., D. G. 1989. Polimorfismo e geni a effetto maggiore. In: Reda (ed.) Miglioramento genetico degli animali domestici. Roma.
Mazza, R., Strozzi, F., Caprera, A., Ajmone-Marsan, P. & Williams, J. L. 2009. The other side of comparative genomics: Genes with no orthologs between the cow and other mammalian species. Bmc Genomics, 10.
Moran, C. 1993. Microsatellite Repeats In Pig (Sus-Domestica) And Chicken
(Gallus-Domesticus) Genomes. Journal of Heredity, 84, 274-280.
Ng-Kway-Hang, K.F. 1997. A review of the relationship between milk protein polymorphism and milk composition/milk production. Proceedings of the IDF seminar on Milk Protein Polymorphism, Palmerston North, New Zealand: 22-37. Nielsen, R. 2005. Molecular signatures of natural selection. Annual Review of Genetics. Nielsen, R., Hellmann, I., Hubisz, M., Bustamante, C. & Clark, A. G. 2007. Recent and
ongoing selection in the human genome. Nature Reviews Genetics, 8, 857-868. Nielsen, R. & Signorovitch, J. 2003. Correcting for ascertainment biases when analyzing
SNP data: Applications to the estimation of linkage disequilibrium. Theoretical Population Biology, 63, 245-255.
Przeworski, M., Coop, G. & Wall, J. D. 2005. The signature of positive selection on standing genetic variation. Evolution, 59, 2312-2323.
Purfield, D. C., Berry, D. P., McParland, S. & Bradley, D. G. 2012. Runs of homozygosity and population history in cattle. Bmc Genetics, 13.
Qanbari, S., Gianola, D., Hayes, B., Schenkel, F., Miller, S., Moore, S., Thaller, G. & Simianer, H. 2011. Application of site and haplotype-frequency based approaches for detecting selection signatures in cattle. Bmc Genomics, 12.
Redon, R., Ishikawa, S., Fitch, K. R., Feuk, L., Perry, G. H., Andrews, T. D., Fiegler, H., Shapero, M. H., Carson, A. R., Chen, W., Cho, E. K., Dallaire, S., Freeman, J. L., Gonzalez, J. R., Gratacos, M., Huang, J., Kalaitzopoulos, D., Komura, D., MacDonald, J. R., Marshall, C. R., Mei, R., Montgomery, L., Nishimura, K., Okamura, K., Shen, F., Somerville, M. J., Tchinda, J., Valsesia, A., Woodwark, C., Yang, F., Zhang, J., Zerjal, T., Armengol, L., Conrad, D. F., Estivill, X., Tyler-Smith, C., Carter, N. P., Aburatani, H., Lee, C., Jones, K. W., Scherer, S. W. & Hurles, M. E. 2006. Global variation in copy number in the human genome. Nature, 444, 444-54.
Ross-Ibarra, J., Morrell, P. L. & Gaut, B. S. 2007. Plant domestication, a unique opportunity to identify the genetic basis of adaptation. Proceedings of the National Academy of Sciences of the United States of America, 104, 8641-8648.
Sachidanandam, R., Weissman, D., Schmidt, S. C., Kakol, J. M., Stein, L. D., Marth, G., Sherry, S., Mullikin, J. C., Mortimore, B. J., Willey, D. L., Hunt, S. E., Cole, C. G., Coggill, P. C., Rice, C. M., Ning, Z. M., Rogers, J., Bentley, D. R., Kwok, P. Y., Mardis, E. R., Yeh, R. T., Schultz, B., Cook, L., Davenport, R., Dante, M., Fulton, L., Hillier, L., Waterston, R. H., McPherson, J. D., Gilman, B., Schaffner, S., Van Etten, W. J., Reich, D., Higgins, J., Daly, M. J., Blumenstiel, B., Baldwin, J.,
Stange-Thomann, N. S., Zody, M. C., Linton, L., Lander, E. S., Altshuler, D. & Int, S. N. P. M. W. G. 2001. A map of human genome sequence variation containing 1.42 million single nucleotide polymorphisms. Nature, 409, 928-933.
SanCristobal, M., Chevalet, C., Haley, C. S., Joosten, R., Rattink, A. P., Harlizius, B., Groenen, M. A. M., Amigues, Y., Boscher, M. Y., Russell, G., Law, A., Davoli, R., Russo, V., Désautés, C., Alderson, L., Fimland, E., Bagga, M., Delgado, J. V., Vega-Pla, J. L., Martinez, A. M., Ramos, M., Glodek, P., Meyer, J. N., Gandini, G. C., Matassino, D., Plastow, G. S., Siggens, K. W., Laval, G., Archibald, A. L., Milan, D., Hammond, K. & Cardellino, R. 2006. Genetic diversity within and between European pig breeds using microsatellite markers. Animal Genetics, 37, 189-198.
Scheinfeldt, L. B. & Tishkoff, S. A. 2013. Recent human adaptation: Genomic approaches, interpretation and insights. Nature Reviews Genetics, 14, 692-702.
Scherer, S. W., Lee, C., Birney, E., Altshuler, D. M., Eichler, E. E., Carter, N. P., Hurles, M. E. & Feuk, L. 2007. Challenges and standards in integrating surveys of structural variation. Nature Genetics, 39, S7-S15.
Seichter, D. , Russ, I., Rothammer, S., Eder, J., Forster, M., and Medugorac, I. 2012. SNP-based association mapping of the polled gene in divergent cattle breeds. Animal Genetics, 43, 595–598
Smith, J. M. & Haigh, J. 1974. The hitch-hiking effect of a favourable gene. Genetical research, 23, 23-35.
Strachan, T. & Read, A. P. 2011. Organization of the Human Genome. Human Molecular Genetics 4. Garland Science/Taylor & Francis Group.
Stranger, B. E., Stahl, E. A. & Raj, T. 2011. Progress and Promise of Genome-Wide Association Studies for Human Complex Trait Genetics. Genetics, 187, 367-383. Toro M.A., Màki-Tanila, A. Genomics reveals domestication history and facilitates breed
development. In: Oldenbroek, K. (ed.) Utilisation and conservation of farm animal genetic resources. Wageningen: Wageningen Academic Publishers; 2007 p 75-102 VanLith, H. A. & VanZutphen, L. F. M. 1996. Characterization of rabbit DNA
microsatellites extracted from the EMBL nucleotide sequence database. Animal Genetics, 27, 387-395.
Vignal, A., Milan, D., SanCristobal, M. & Eggen, A. 2002. A review on SNP and other types of molecular markers and their use in animal genetics. Genetics Selection Evolution, 34, 275-305.
Waterston, R. H., Lindblad-Toh, K., Birney, E., Rogers, J., Abril, J. F., Agarwal, P., Agarwala, R., Ainscough, R., Alexandersson, M., An, P., Antonarakis, S. E., Attwood, J., Baertsch, R., Bailey, J., Barlow, K., Beck, S., Berry, E., Birren, B., Bloom, T., Bork, P., Botcherby, M., Bray, N., Brent, M. R., Brown, D. G., Brown, S. D., Bult, C., Burton, J., Butler, J., Campbell, R. D., Carninci, P., Cawley, S., Chiaromonte, F., Chinwalla, A. T., Church, D. M., Clamp, M., Clee, C., Collins, F. S., Cook, L. L., Copley, R. R., Coulson, A., Couronne, O., Cuff, J., Curwen, V., Cutts, T., Daly, M., David, R., Davies, J., Delehaunty, K. D., Deri, J., Dermitzakis,
E. T., Dewey, C., Dickens, N. J., Diekhans, M., Dodge, S., Dubchak, I., Dunn, D. M., Eddy, S. R., Elnitski, L., Emes, R. D., Eswara, P., Eyras, E., Felsenfeld, A., Fewell, G. A., Flicek, P., Foley, K., Frankel, W. N., Fulton, L. A., Fulton, R. S., Furey, T. S., Gage, D., Gibbs, R. A., Glusman, G., Gnerre, S., Goldman, N., Goodstadt, L., Grafham, D., Graves, T. A., Green, E. D., Gregory, S., Guigo, R., Guyer, M., Hardison, R. C., Haussler, D., Hayashizaki, Y., Hillier, L. W., Hinrichs, A., Hlavina, W., Holzer, T., Hsu, F., Hua, A., Hubbard, T., Hunt, A., Jackson, I., Jaffe, D. B., Johnson, L. S., Jones, M., Jones, T. A., Joy, A., Kamal, M., Karlsson, E. K., et al. 2002. Initial sequencing and comparative analysis of the mouse genome. Nature, 420, 520-62.
Weller, J. I., Kashi, Y. & Soller, M. 1990. Power Of Daughter And Granddaughter Designs For Determining Linkage Between Marker Loci And Quantitative Trait Loci In Dairy-Cattle. Journal of Dairy Science, 73, 2525-2537.
Wiener, P. & Wilkinson, S. 2011. Deciphering the genetic basis of animal domestication. Proceedings of the Royal Society B-Biological Sciences, 278, 3161-3170.
Windig, J. J. & Engelsma, K. A. 2010. Perspectives of genomics for genetic conservation of livestock. Conservation Genetics, 11, 635-641.
Woods, C. G., Cox, J., Springell, K., Hampshire, D. J., Mohamed, M. D., McKibbin, M., Stern, R., Raymond, F. L., Sandford, R., Sharif, S. M., Karbani, G., Ahmed, M., Bond, J., Clayton, D. & Inglehearn, C. F. 2006. Quantification of homozygosity in consanguineous individuals with autosomal recessive disease. American Journal of Human Genetics, 78, 889-896.
Woolliams J. and Toro M. (2007). What is genetic diversity. In: Utilisation and conservation of farm animal genetic resources, Oldenbroek, K. (Ed.), Wageningen Academic Publishers, The Netherlands, pp. 29-54.
CHAPTER 2
Use of Locally Weighted Scatterplot Smoothing (LOWESS) regression to
study selection signatures in Piedmontese and Italian Brown cattle breeds
Elia Pintus1, Silvia Sorbolini1, Andrea Albera2, Giustino Gaspa1, Corrado Dimauro1, Roberto Steri1, Gabriele Marras1, Nicolò Pietro Paolo Macciotta*1
Use of Locally Weighted Scatterplot Smoothing (LOWESS) regression to
study selection signatures in Piedmontese and Italian Brown cattle breeds
SUMMARY
Selection is the major force affecting local levels of genetic variation in species. The availability of dense marker maps offers new opportunities for a detailed understanding of genetic diversity distribution across the animal genome. Over the last fifty years, cattle breeds have been subjected to intense artificial selection. Consequently, regions controlling traits of economic importance are expected to exhibit selection signatures. The fixation index (Fst) is an estimate of population differentiation, based on genetic polymorphism data and it is calculated using the relationship between inbreeding and heterozygosity. In the present study, the locally weighted scatterplot smoothing regression (LOWESS) and a Control Chart approach were used to investigate selection signatures in two cattle breeds with different production aptitude (dairy and beef).
Fst was calculated for 42,514 SNPs marker loci distributed across the genome in 749 Italian Brown and 364 Piedmontese bulls respectively. The statistical significance of Fst values was assessed using a Control Chart. The LOWESS technique was efficient in removing noise from the raw data and was able to highlight selection signatures in chromosomes known to harbour genes affecting dairy and beef traits. Examples are, the peaks detected for BTA2 in the region where the myostatin gene is located and for BTA6 in the region harbouring the ABCG2 locus. Moreover, several loci not previously reported in cattle studies were detected.
INTRODUCTION
The study of the genetic basis of differences among animal populations is a hot topic of animal genetics. The quantification of allelic richness and the evaluation of their association with phenotypes represent tools for the safeguard and the management of local populations. Moreover, identification of genomic regions involved in phenotypic differences between individuals provide useful knowledge for gene assisted selection programmes.
Specialized breeds have been subjected to intense selection. A main consequence has been the progressive erosion of local levels of genetic variation that may have compromised the ability to challenge environmental factors (Mäki-Tanila et al., 2010). Thus a genetic comparison between selected and autochthonous populations may allow for the identification of genomic regions involved in the control of fitness traits. On the other hand, studies involving highly selected breeds with different production aptitudes, as the case of dairy and beef cattle, can provide an exciting opportunity for studying signatures of selective breeding (Hayes et al., 2008a; Qanbari et al., 2010). Actually, little is known about the effects of intensive, directional and prolonged selection on genome sub-structure of domestics species.
In population genetics, the identification of a locus target of selection is based on the existence of a reduction in nucleotidic diversity, or on an increase linkage disequilibrium (LD) and/or a changed allele frequency (Doebley et al., 2006). Currently, different statistical methods are used for the detection of selection signatures. Many of them are based on the comparison of allele frequencies or haplotype structure (for a review see Biswas and Akey 2006). The most commonly used metrics are the r2 for measuring LD and the fixation index Fst (Weir and Cockerham, 1984). A quite recent approach, extensively studied in human populations, is based on the detection of runs of homozygosity (ROH), defined as uninterrupted stretch of homozygous genotypes (Gibson et al., 2006). The extent and frequency of ROHs can be used as an indication of past or recent inbreeding (Khatkar et al., 2010; Purfield et al., 2012; Ferencakovic et al., 2012). However, for many of these methods it is difficult to develop a proper statistical test. This is particularly true when searching for selective signatures within a single population.
High throughput platforms able to simultaneously genotype for many thousands of SNP offer a powerful tool for the assessment of the genetic diversity across the genome (Andersson and Georges 2004). Genome Wide Analysis (GWA) have been performed to
clarify the role of selection and drift in the evolutionary processes (Biswas and Akey 2006). Several recent studies have proposed the hitch-hiking mapping approach for identification of target of positive selection. The basic assumption is that the substitution of favourable allele at one site results in a reduction of variability at closely linked sites and lead to the allele fixation in a population (Przeworski et al., 2005). Actually, the abundance of SNP throughout the genome makes them particularly suitable in the detection of such selective sweeps (Andersson and Georges 2004).
However, such a huge amount of information has become rather problematic to interpret. A major issue is represented by the great variability of the signal pattern (for example heterozygosity or other related statistics as Fst) along the chromosome. An usual empirical practice to smooth data is to work on average values of sliding windows of predetermined size (Weir et al., 2005; Barendse et al., 2009). A common problem is represented by the development of a suitable statistical test able to assess whether an index of the genetic difference between two populations can be considered significant. Different approaches have been proposed to assess Fst statistical significance, as the calculation of q-values for Kernel-smoothed q-values (Flori et al., 2009), permutation test based on binomial distribution of the SNP allelic frequencies (Stella et al., 2010) or the setting of a threshold of one standard deviation from the mean for smoothed Fst values (Kijas et al., 2012).
In the present work, an approach for studying selection signatures in two Italian cattle breeds with different production aptitude, Italian Brown and Piedmontese (dairy and beef, respectively), is proposed. In particular, a local regression is used to smooth raw Fst data and a Control Chart is applied to predicted data for identifying significant values. The method is challenged to identify genes that have been reported to be involved in the genetic determinism of dairy and beef traits in cattle.
MATERIALS AND METHODS
A sample of 749 Italian Brown and 364 Piedmontese bulls was considered in the study. Animals were genotyped with the Illumina Bovine bead-chip containing 54,001 SNP (http://www.illumina.com). Only SNP located on the 29 autosomes in the Btau4.0 build of the Bovine Genome assembly were considered. Quality control was performed on the genotypes. SNP were removed if: monomorphic in both breeds; had a percentage of missing data higher than 2.5% had a minor allele frequency lower than 1%. After data
editing, 42,514 markers were retained for the study. Missing data were replaced with the most frequent allele at that specific locus for each breed.
Allele frequencies, observed and expected heterozygosity were calculated for each breed. Total allelic frequencies for each locus, fp and fq, considering all animals as a single
population were calculated as:
fp = [fB (2·nB)+fP·(2·nP)]/(nB+nP);
Where fB and nB are frequencies of alleles and number of individuals in Brown, and fP and nP are frequencies of alleles and number of individuals in Piedmontese.
fq = 1-fp
Then, expected heterozygosity in populations (Hs) and overall (Ht) were calculated. Finally, Fst was calculated according to Weir and Cockerham (1984) as:
Fst =Ht-Hs/Ht
In order to smooth Fst pattern, data were fitted with a Locally Weighted Scatterplot Smoothing (LOWESS) regression using the PROC LOWESS of SAS/STAT software version 9.2 (SAS Institute, Inc; Cary NC) (Cleveland 1979). The LOWESS has been used in genetics for smoothing model R2 in the statistical analysis of molecular marker data (Questa-Marcos et al., 2010). In the LOWESS, the space of the independent variable is fragmented into different intervals for which separate regressions are fitted. The aim of the method is to remove noise from raw data and to clarify graphical presentations. A critical point in fitting LOWESS is the identification of a suitable dimension of the data interval to be included in the analysis. In other words, if x is the number of adjacent points to be used in the estimation procedure of a set of n data, each region contains a fraction of points given by x/n. This ratio is defined as the smoothing parameter S of the LOWESS regression. As S increases, the fitted line will be smoother until S = 1 that corresponds to a single line (i.e. the standard linear regression). Consequently, the goodness of fit depends strongly on the smoothing parameter used (Cohen 1999).
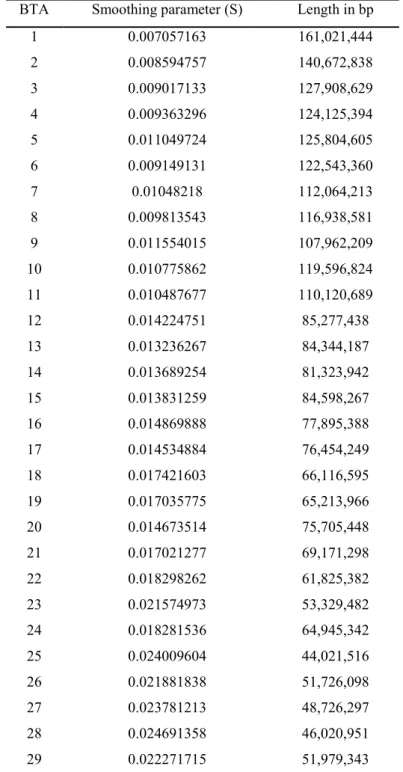
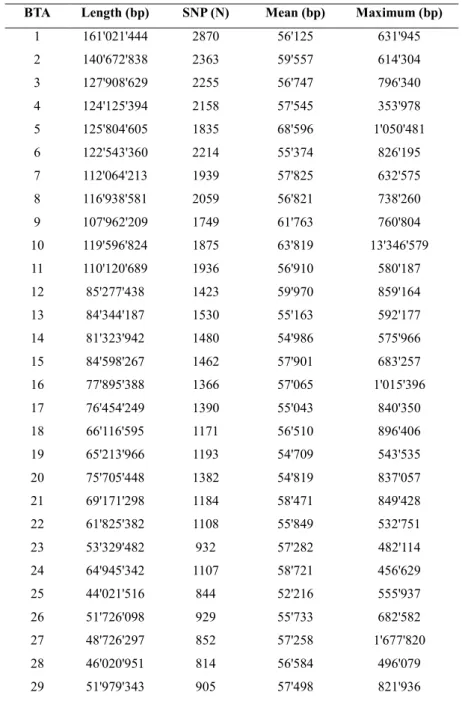
In general, the number of markers considered in the local regression was different across chromosomes, being directly related to their length. Therefore the use of the same S parameter in all chromosomes could not be feasible. In the present work, a smoothing parameter corresponding to an interval of 20 SNPs for each separated regression gave the best results. The different smoothing parameters used for each chromosome are reported in Table 1.
Table 1 LOWESS smoothing parameter (S) and interval length in base pair (bp) for each chromosome (BTA)
BTA Smoothing parameter (S) Length in bp
1 0.007057163 161,021,444 2 0.008594757 140,672,838 3 0.009017133 127,908,629 4 0.009363296 124,125,394 5 0.011049724 125,804,605 6 0.009149131 122,543,360 7 0.01048218 112,064,213 8 0.009813543 116,938,581 9 0.011554015 107,962,209 10 0.010775862 119,596,824 11 0.010487677 110,120,689 12 0.014224751 85,277,438 13 0.013236267 84,344,187 14 0.013689254 81,323,942 15 0.013831259 84,598,267 16 0.014869888 77,895,388 17 0.014534884 76,454,249 18 0.017421603 66,116,595 19 0.017035775 65,213,966 20 0.014673514 75,705,448 21 0.017021277 69,171,298 22 0.018298262 61,825,382 23 0.021574973 53,329,482 24 0.018281536 64,945,342 25 0.024009604 44,021,516 26 0.021881838 51,726,098 27 0.023781213 48,726,297 28 0.024691358 46,020,951 29 0.022271715 51,979,343
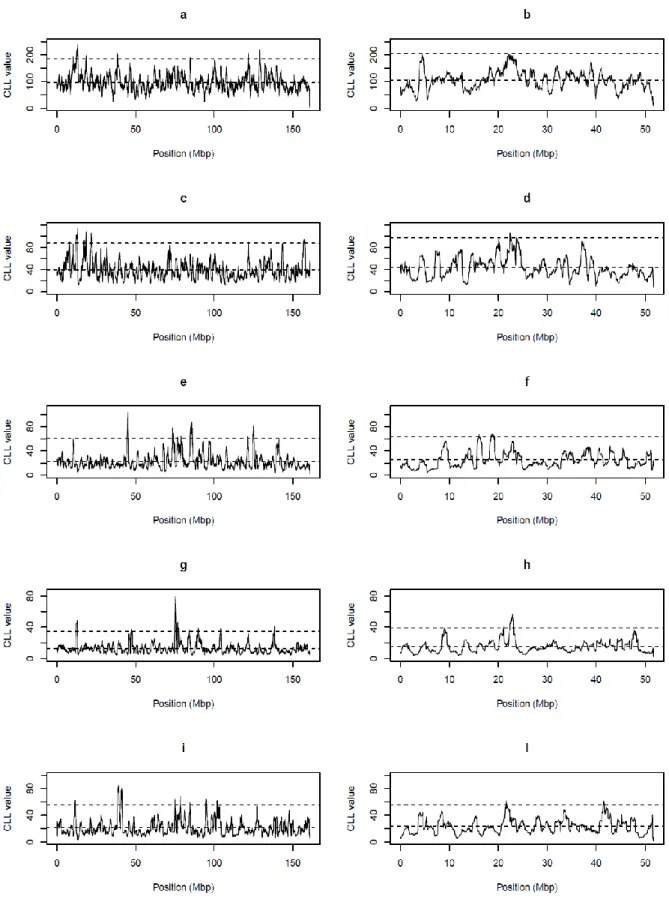
In order to identify Fst values different from the average pattern that could be evidence of selection signatures, LOWESS smoothed Fst were analysed with a Control Chart approach. This methodology aims at checking a process and its variability and it can be used to identify sources of variation. In the specific case of the present study, the goal
was to partition Fst variation into a component due to selection, that causes a drop of heterozygosity, and a remaining random variation along the chromosome. Control Charts are graphically displayed as stream of data falling within control limits. Data exceeding these limits are flagged as outlier signals. A similar approach has been used by Kijas et al., (2012) for identifying selection signatures in sheep breeds.
A Control Chart approach has been recently used to identify sites of preferential location of genetic variation in Mycobacterium tuberculosis (Das et al., 2012). In the present study, smoothed Fst values were plotted against their position along the chromosome. Limits of the Control Chart were set at 3 standard deviations from the mean.
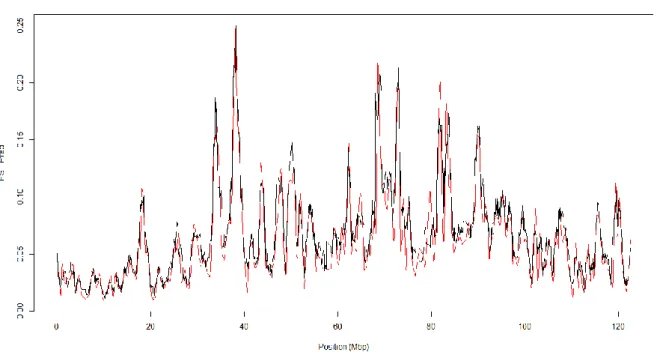
In order to compare the results with an assessed methodology for studying selection signatures, Fst values were also smoothed with a sliding windows approach. The genome was divided into windows and average Fst values for each interval were calculated. Sliding windows are a graphical method widely used for detect genomic regions under positive or balancing selection (Hayes et al., 2008a; Stella et al., 2010). In the present study, the size of the window was fixed at 20 SNP each (i.e. of the same size of those used in the LOWESS smoothing). The two methods were compared by examining patterns of smoothed Fst signals.
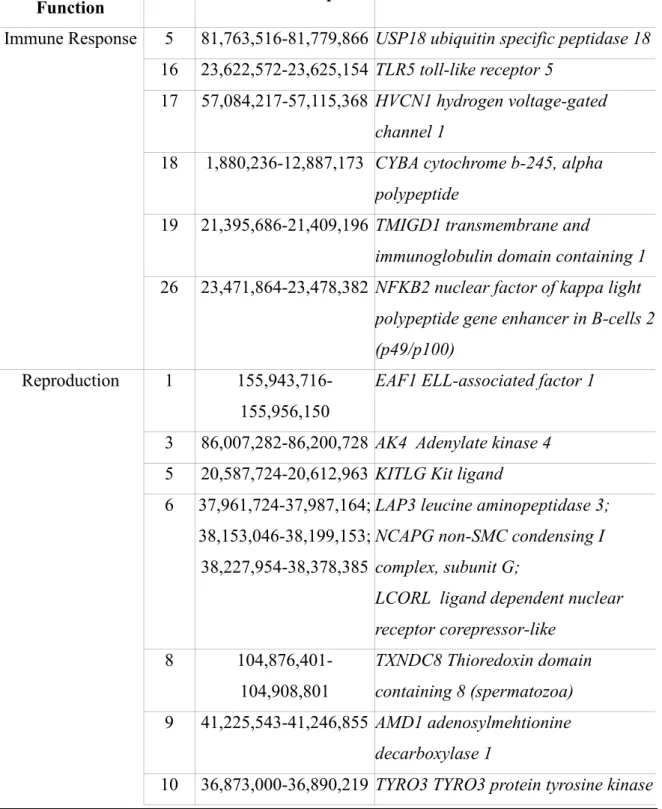
Annotated genes in genomic regions corresponding to peaks exceeding Control Chart limits were derived from the UCSC Genome Broswer Gateway (http://genome.ucsc.edu/). Intervals of 500Kbp (0,25 Mbp upstream and downstream the significant region) were considered.
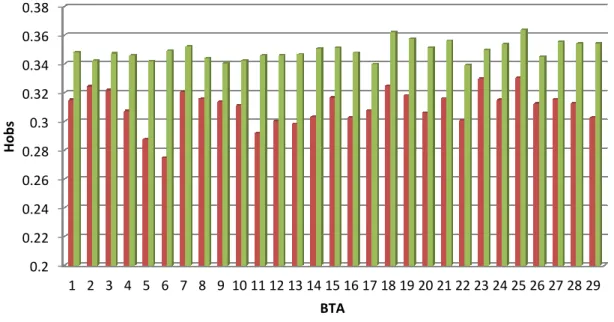
RESULTS AND DISCUSSION
The comparison of chromosome average heterozygosity (Hobs) between the two breeds highlights lower values for the Italian Brown (average difference of 0.04) (Figure 1). The largest difference was found for BTA6 (0.07) the smallest for BTA2 (0.02). Differences in heterozygosity between cattle breeds have been reported by other authors (Ciampolini et al., 1995; Cañón et al., 2001).