TeMA
Special
Issue
Covid -19 vs City -
20
scenarios, insights, reasoning and research
This Special Issue of TeMA - Journal of Land Use, Mobility and
Environment, collects twenty-seven contributes of international
researchers and technicians in form of scenarios, insights,
reasoning and research on the relations between the City and the
impacts of Covid-19 pandemic, questioning about the development
of a new vision and a general rethinking of the structure and urban
organization.
TeMA Journal offers papers with a unified approach to planning,
mobility and environmental sustainability. With ANVUR resolution
of April 2020, TeMA journal and the articles published from 2016 are
included in the A category of scientific journals. From 2015, the
arti-cles published on TeMA are included in the Core Collection of Web
of Science. It is included in Sparc Europe Seal of Open Access
Journals, and the Directory of Open Access Journals.
Journal of
Land Use, Mobility and Environmen
t
ISSN 1970-9889
University of Naples Federico II
Special Issue
COVID-19 vs CITY-20
SCENARIOS, INSIGHTS, REASONING AND RESEARCH
Published by
Laboratory of Land Use Mobility and Environment
DICEA - Department of Civil, Architectural and Environmental Engineering
University of Naples "Federico II"
TeMA is realized by CAB - Center for Libraries at “Federico II” University of Naples using Open Journal System
Editor-in-chief: Rocco Papa
print ISSN 1970-9889 | on line ISSN 1970-9870
Licence: Cancelleria del Tribunale di Napoli, n° 6 of 29/01/2008
Editorial correspondence
Laboratory of Land Use Mobility and Environment
DICEA - Department of Civil, Architectural and Environmental Engineering
University of Naples "Federico II"
Piazzale Tecchio, 80
80125 Naples
web: www.tema.unina.it
e-mail: [email protected]
Given the short time to produce the volume, the Editorial Board of TeMA Journal carried out the scientific quality audit of the contributions published in this Special Issue.
The cover image is a photo collage of some cities during the Covid-19 pandemic quarantine (March 2020)
TeMA
Journal of
Land Use, Mobility and Environment
TeMA Journal of Land Use Mobility and Environment. Special Issue | Covid-19 vs City-20
TeMA Journal of Land Use, Mobility and Environment offers researches, applications and contributions with a unified approach to planning and mobility and publishes original inter-disciplinary papers on the interaction of land use, mobility and environment. Domains include: engineering, planning, modeling, behavior, economics, geography, regional science, sociology, architecture and design, network science and complex systems.
With ANVUR resolution of April 2020, TeMA Journal and the articles published from 2016 are included in A category of scientific journals. From 2015, the articles published on TeMA are included in the Core Collection of Web of Science. TeMA Journal has also received the Sparc Europe
Seal for Open Access Journals released by Scholarly Publishing and Academic Resources Coalition (SPARC Europe) and the Directory of Open Access Journals (DOAJ). TeMA is published under a Creative Commons Attribution 3.0 License and is blind peer reviewed at least by two
referees selected among high-profile scientists. TeMA has been published since 2007 and is indexed in the main bibliographical databases and it is present in the catalogues of hundreds of academic and research libraries worldwide.
E
DITORIN-CHIEF
Rocco Papa, University of Naples Federico II, Italy
E
DITORIALA
DVISORYB
OARDMir Ali, University of Illinois, USA
Luca Bertolini, University of Amsterdam, Netherlands
Luuk Boelens, Ghent University, Belgium
Dino Borri, Polytechnic University of Bari, Italy
Enrique Calderon, Polytechnic University of Madrid, Spain
Roberto Camagni, Polytechnic University of Milan, Italy
Derrick De Kerckhove, University of Toronto, Canada
Mark Deakin, Edinburgh Napier University, Scotland
Aharon Kellerman, University of Haifa, Israel
Nicos Komninos, Aristotle University of Thessaloniki, Greece
David Matthew Levinson, University of Minnesota, USA
Paolo Malanima, Magna Græcia University of Catanzaro, Italy
Agostino Nuzzolo, Tor Vergata University of Rome, Italy
Rocco Papa, University of Naples Federico II, Italy
Serge Salat, Urban Morphology and Complex Systems Institute, France
Mattheos Santamouris, National Kapodistrian University of Athens, Greece
Ali Soltani, Shiraz University, Iran
A
SSOCIATEE
DITORSRosaria Battarra, National Research Council, Institute of Mediterranean studies, Italy
Gerardo Carpentieri, University of Naples Federico II, Italy
Pierluigi Coppola, Politecnico di Milano, Italy
Luigi dell'Olio, University of Cantabria, Spain
Isidoro Fasolino, University of Salerno,Italy
Romano Fistola, University of Sannio, Italy
Carmela Gargiulo, University of Naples Federico II, Italy
Thomas Hartmann, Utrecht University, Netherlands
Markus Hesse, University of Luxemburg, Luxemburg
Seda Kundak, Technical University of Istanbul, Turkey
Rosa Anna La Rocca, University of Naples Federico II, Italy
Houshmand Ebrahimpour Masoumi, Technical University of Berlin, Germany
Giuseppe Mazzeo, National Research Council, Institute of Mediterranean studies, Italy
Nicola Morelli, Aalborg University, Denmark
Enrica Papa, University of Westminster, United Kingdom
Dorina Pojani, University of Queensland, Australia
Floriana Zucaro, University of Naples Federico II, Italy
E
DITORIALS
TAFFGennaro Angiello, Ph.D. at University of Naples Federico II, Italy
Stefano Franco, Ph.D. student at Luiss University Rome, Italy
Federica Gaglione, Ph.D. student at University of Naples Federico II, Italy
Carmen Guida, Ph.D. student at University of Naples Federico II, Italy
Andrea Tulisi, Ph.D. at Second University of Naples, Italy
Special Issue
COVID-19 vs CITY-20
SCENARIOS, INSIGHTS, REASONING AND RESEARCH
Contenets
TeMA
Journal of
Land Use, Mobility and Environment
5
EDITORIAL PREFACE
Carmela Gargiulo
9
Covid-19 and simplification of urban planning tools. The residual plan
Pasqualino Boschetto
17
Covid-19. Some moments of the 21st century, with a look at Milan
Roberto Busi
31
Geographic Information and Covid-19 outbreak. Does the spatial dimension matter?
Michele Campagna
45
Health emergency and economic and territorial implications. First considerations
Salvatore Capasso, Giuseppe Mazzeo
59
About the effects of Covid-19 on solid waste management
Alessandra Cesaro, Francesco Pirozzi
67
The city and natural resources.
Pandemic disaster can be a driving force for new perspective
2 - TeMA Journal of Land Use Mobility and Environment. Special Issue | Covid-19 vs City-20
81
Evolution of mobility sector during and beyond Covid-19. Viewpoint of
industries, consultancies and public transport companies
Pierluigi Coppola, Francesco De Fabiis
91
Tourism on demand. A new form of urban and social demand of use after the
pandemic event
Fabio Corbisiero, Rosa Anna La Rocca
105
Questioning urbanisation models in the face of Covid-19.
The crisis as a window of opportunity for inner areas
Giancarlo Cotella, Elisabetta Vitale Brovarone
119
The Covid-19 pandemic effects in rural areas.
Turning challenges into opportunities for rural regeneration
Claudia De Luca, Simona Tondelli, Hanna Elisabeth Åberg
133
Shaping space for ever-changing mobility. Covid-19 lesson learned from Milan
and its region
Diego Deponte, Giovanna Fossa, Andrea Gorrini
151
From social distancing to virtual connections
How the surge of remote working could remold shared spaces
Luisa Errichiello, Daniele Demarco
165
The paradigms of urban planning to emergency-proof.
Rethinking the organisation of settlements at the time of a pandemic
Isidoro Fasolino, Michele Grimaldi, Francesca Coppola
179
Virucity. Rethinking the urban system
Romano Fistola, Dino Borri
189
The role of the urban settlement system in the spread of Covid-19 pandemic.
The Italian case
Carmela Gargiulo, Federica Gaglione, Carmen Guida, Rocco Papa, Floriana Zucaro, Gerardo
Carpentieri
213
“Passata è la tempesta …”. A land use planning vision for the Italian
Mezzogiorno in the post pandemic
231
Covid-19 and spatial planning
A few issues concerning public policy
Sabrina Lai, Federica Leone, Corrado Zoppi
247
Take advantage of the black swan to improve the urban environment
Antonio Leone, Pasquale Balena, Raffaele Pelorosso
261
Imagining living spaces in extreme conditions: suggestions from a case study
in Bari
Giulia Mastrodonato, Domenico Camarda
269
Risk, health system and urban project
Gerardo Matteraglia
283
Geographical analyses of Covid-19's spreading contagion in the challenge
of global health risks
The role of urban and regional planning for risk containment
Beniamino Murgante, Ginevra Balletto, Giuseppe Borruso, Giuseppe Las Casas, Paolo Castiglia
305
The resilient city and adapting to the health emergency.
Towards sustainable university mobility
Francesca Pirlone, Ilenia Spadaro
315
Physical spacing and spatial planning.
New territorial geographies and renewed urban regeneration policies
Piergiuseppe Pontrandolfi
327
Mega cities facing Covid-19 pandemic.
How to use urban spaces in Tehran after the new pandemic
Elmira Shirgir
333
Rethinking rules and social practices. The design of urban spaces
in the post-Covid-19 lockdown
Maria Rosaria Stufano Melone, Stefano Borgo
343
Data analysis and mapping for monitoring health risk. What has the spread of
the Covid-19 pandemic in northern Italy taught us?
Michela Tiboni, Michéle Pezzagno, David Vetturi, Craig Alexander, Francesco Botticini
363
About the Sustainability of Urban Settlements.
A first reflection on the correlation between the spread of Covid-19 and the regional
average population density in Italy
TeMA
A
Journal of
Land Use, Mobility and Environment
TeMA Special Issue | Covid-19 vs City-20, 343-360 print ISSN 1970-9889, e-ISSN 1970-9870 DOI: 10.6092/1970-9870/6899
Received 13rd May 2020, Available online 19th June 2020
Licensed under the Creative Commons Attribution – Non Commercial License 3.0 www.tema.unina.it
Data analysis and mapping for monitoring health risk
What has the spread of the Covid-19 pandemic in
northern Italy taught us?
M. Tiboni
a*, M. Pezzagno
b, D. Vetturi
c, C. Alexander, F. Botticini
daDICATAM
University of Brescia, Italy e-mail: [email protected]
ORCID: https://orcid.org/0000-0002-8040-1060 * Corresponding author
bDICATAM
University of Brescia, Italy e-mail: [email protected]
ORCID: https://orcid.org/ 0000-0003-0844-1890 cDIMI
University of Brescia, Italy e-mail: [email protected]
ORCID: https://orcid.org/0000-0002-1798-7935
dDICATAM
University of Brescia, Italy e-mail: [email protected]
Abstract
The construction of the knowledge framework is a fundamental phase in the territorial governance process and data analyses, together with their mapping using GIS software, provide a fundamental basis for the structuring of a system for making decisions. With reference to the issue of risk management, monitoring of spatial and temporal evolution of the phenomena is equally fundamental.
The aim of the paper is to address these issues in relation to health risk, starting from the pandemic situation that affected northern Italy in the early months of 2020.
The paper presents an ex-post statistical analysis of the ISTAT data on mortality in the Italian provinces, comparing the currently available 2020 data to previous years. A territorial analysis is then presented, using a GIS, regarding the spread of the Covid-19 infection in the 205 municipalities of the province of Brescia. The paper also proposes a comparison with analysis conducted for other territories outside Italy. Finally, a reflection is offered on what we have learned from this pandemic regarding the need to have a monitoring system for phenomena related to health risk, in order to reduce the vulnerability of the health system.
Keywords
Data mapping; Data analysis; Risk; Monitoring; Prevention.
How to cite item in APA format
Tiboni, M., Pezzagno, M., Vetturi D., Alexanderc C. & Botticini, F. (2020). Data analysis and mapping for monitoring health risk. What has the spread of the Covid-19 pandemic in northern Italy taught us?. Tema.
M.Tiboni, D.Vetturi, C.Alexander, F.Botticini - Data analysis and mapping for monitoring health risk.
1. Safety in the city
1.1 The importance of planning for reducing and monitoring risk
In the aim of planning and building a safer city, particular importance is given to the prevention and management of risk, both of natural and anthropogenic origin.
Researchers have long acknowledged the centrality of the theme in planning (see among the others Foster, 1980; Varnes,1984; Tira, 1997; Tiboni, 2007; Fistola, 2011; Zoppi & Lai, 2011; Tira & Zazzi, 2012; La Rosa, et al., 2013), and the specific Covid-19 pandemic situation that hit the whole world in the first months of 2020 requires us to extend our reflection to health risk or, more generally, to any type of risk, not only of natural origin, but also anthropic.
The risk is due to an event that sets off the disaster that occurs in a limited period and/or space, even if the effects may continue over time and spread to affect a larger area than that immediately involved.
The risk level perceived by a society is the discriminating factor for establishing how much that society is prepared to pay to eliminate the phenomenon that determines the risk. This decision is the result of the definition of a maximum risk level considered acceptable, a risk which the society decides not to eliminate because it considers the effects of the event as acceptable.
Risk specialists and experts tend to emphasize the numerical data regarding recurrence, intensity and destructiveness of disasters. This is a purely scientific approach that aims to set out the dynamics of the events and pinpoint possible solutions.
The sociological aspect of the risk, on the other hand, regards politicians and citizens who are unable to distinguish between objects/people and the values attributed to them. This aspect is linked to fear, uncertainty and problems understanding the event.
The concept of risk is often mistakenly confused with that of hazard. Indeed, the hazard is an integral part of the risk, but the two concepts are not synonymous.
The two terms have a precise philological definition:
−
Hazard is “a threatening situation which is the source of the risk”. For example, a natural phenomenon in general, such as a landslide, heavy rain, a hailstorm or an earthquake;−
Risk is “the product of the probability that the event occurs and the losses that this can generate”. The number of times a physical phenomenon recurs may be studied by analysing the historical data, enabling us to understand how likely a certain zone is subject to the specific event in question.This information is useful for a technical evaluation of the hazard, but does not indicate the number of people, assets and infrastructures exposed to the event.
For an effective analysis, we need to introduce the concepts of vulnerability and exposure in order to take differences in geography and population density into account.
The generic concept of loss, or better the damage rate, is therefore replaced by:
−
Vulnerability (V), understood as the propensity to suffer damage because of a certain event;−
Exposure (E), understood as the quantity and value of the assets (human beings and material assets) present in the area involved by the event.So, risk should be measured in terms of expected damage, obtained from the combination of the cause (hazard), the system vulnerability and exposure, relative to both the human and economic component:
Risk = f (hazard, exposure, vulnerability), R=f (H, E, V)
Hazard, vulnerability and exposure depend on the intensity (I) of the event and the type (T) of elements at risk:
M.Tiboni, D.Vetturi, C.Alexander, F.Botticini - Data analysis and mapping for monitoring health risk.
345 - TeMA Journal of Land Use Mobility and Environment. Special Issue | Covid-19 vs City-20 The risk function thus takes on its complete form:
R=f (I, H, V, T, E) Where:
R=risk
I=intensity of the event (the magnitude of an earthquake, the volume of a landslide);
H=hazard, the probability that a phenomenon of a given intensity (I) takes place within a certain time period and in a certain area;
V=vulnerability, or rather the propensity to suffer damage as a consequence of an event of a certain intensity (I) and on the basis of the type of elements (T) at risk;
T=type of elements potential subject to the effects of disasters (population, material assets, infrastructures); E=quantity and value of the type of elements (T) at risk.
1.2 Hazard, exposure and vulnerability: some definitions
Starting from literature in the field of urban planning, short reflections on the definitions of the three variables will be presented below, with the aim of extending the widely studied approach to natural risk to the case of health risk (Tira, 1997; Tiboni, 2007; Fistola et al., 2020; Giuliani et al., 2020).
Hazard
Hazard depends on specific parameters based on the characteristics of the phenomenon in question. In the field of regional planning, it always refers to three parameters: intensity, frequency, location.
Different parameters for measuring the intensity are in place for each type of event. It is important to know how often the phenomenon reaches an intensity held to be significant and when an event above the safety threshold may presumably occur.
Exposure
The exposure is a function of the number of people who could potentially be affected by the event and all the economic assets in the area at risk.
If no asset (either human or economic) is exposed to the hazard, there is no risk.
The urban environment is an exposed place, due to the intense presence of people, structures, infrastructures and strategic functions, but the conditions of the subjects at risk may vary greatly in time and space and therefore have a major effect on the system’s ability to respond. It is also possible to imagine different levels of exposure: for the single object at risk or for the regional system, where the exposure is also conditioned by spatial distribution and regional hierarchies of towns.
This leads us to deduce that, in risk analysis, exposure is a constantly changing factor, because cities change in form and, more rapidly, in use.
Exposure reflects the concept that the risk increases with the increase in quantity and value of the subjects affected. From this point of view, it is important to identify a method able to associate a value with each exposed element, to be able to establish a safeguarding order. Estimative methods (costs/benefits and risks/benefits analysis) can be applied to material assets, but it is completely unrealistic to quantify the value of human life. In the insurance field, there are some estimative methods based on the investments made by the society in the individual rather than on the presumed income, but none of these analyses can take into account the impact that the loss of a loved one has on his or her family members. Whilst this is emotionally true, effective planning must surely ascribe a value to life? Otherwise you end up with what in economics-speak is called a lexicographic preference ordering - possible outcomes will be ranked first solely on loss of life. Only if two outcomes have the same loss of life would a second factor such as financial loss be considered.
M.Tiboni, D.Vetturi, C.Alexander, F.Botticini - Data analysis and mapping for monitoring health risk.
Therefore, human life is the main asset and the most important thing that needs to be protected.
Vulnerability and exposure have various elements in common, which should be borne in mind in order to avoid considering the same variable twice in the risk assessment. The concentration of assets, services and people in a given area, in other words the exposure, is also an indicator of vulnerability, because there is an increased probability of subsystems or fragile elements and a greater number of interdependencies that increase the vulnerability of the system as a whole.
If our goal is to reduce the risk to which a community is exposed, we will have to work to reduce one of the 3 variables that make up the risk (hazard, vulnerability, exposure), or better yet act in parallel on each variable. It is obvious that if there are no hazards (i.e. H = 0), there is no risk, and high exposure and vulnerability can generate a high-risk level also with a low hazard level. Hazard is only a part of the risk. In order to know the risk level of a region, it is necessary to know vulnerability, exposure and hazard levels in each point of the region, so that combining the three variables a risk map algebra could be produced (Tiboni & Tira, 1997; Tira et al., 2006; Zoppi & Lai, 2014).
The more the area is unprepared, or the more inadequate the response, the greater the system's vulnerability. This brings us to the importance of a "Mitigation Plan", or rather all the operations devoted to mitigation: the emergency is the manifestation of the vulnerability found in a certain area.
Vulnerability
A structure is vulnerable if it is inclined to suffer damages from a specific event.
Vulnerability is a function of the specific characteristics of the stressed system, but it only enters in play when the cause surpasses a certain severity threshold.
It can be interpreted as that level of severity (understood as a combination of intensity, spatial expansion and frequency in time) beyond which the system is no longer able to withstand the stress without breaking up. If the level is high, the system is not very vulnerable and is even able to withstand very intense events, while if the level is low, the system is very vulnerable and reaches crisis point with even a small amount of stress. The vulnerability analysis therefore involves the evaluation of numerous system/hazard combinations to be subjected to events with different levels of intensity. Evaluating the response of different regional systems is indispensable for creating vulnerability evaluation models.
The concept of “socio-systemic” vulnerability also expresses the possible damage that could occur in a given social system in terms of human, economic and environmental resources, but also the propensity for damage that this system presents in terms of risk or poor response capacity. The vulnerability therefore expresses, in qualitative and quantitative terms, the possibility that the system is struck by any external event in a limited period of time.
It is easy to understand how the socio-economic-environmental system’s propensity to damage is substantially linked to two factors:
−
the type of “risk” that the system is subject to;−
the system’s response capacity (in terms of organization, for example).In fact, vulnerability is also a function of the community’s level of risk awareness, not just of the hazardous agent, but also of the spatial and social distribution of the vulnerability itself and of the material and human resources in place to combat it. Two communities subject to the same risk are not equally vulnerable, inasmuch as some societies have adopted regulations and implemented many projects targeted at risk reduction. Therefore, a society that has adopted a disaster prevention policy will be far less vulnerable than a community that has not put any provisions into place. Many forms of ground usage may increase the level of vulnerability, just like the increase in the complexity of the social system (Greco et al., 2019).
M.Tiboni, D.Vetturi, C.Alexander, F.Botticini - Data analysis and mapping for monitoring health risk.
347 - TeMA Journal of Land Use Mobility and Environment. Special Issue | Covid-19 vs City-20
The vulnerability of the physical, social and institutional structure of the area, that is to say how much the physical structures (such as houses built on the basis of anti-seismic criteria, in the event of an earthquake), and the social and institutional structures (for example if there is an organized response structure, and if emergency contingency plans are in place) are prepared to deal with a calamity, determines the risk level. The more the area is unprepared, or the more inadequate the regional response, the greater the system’s vulnerability.
2. Health risk: the case study of the Covid-19 pandemic in northern Italy
2.1 Introduction
The definition of risk proposed in the previous section finds plenty of applications in the urban planning field, namely for what concerns natural risk (seismic, hydrogeological, volcanic, …).
The use of GIS software (Geographic Information System) is consolidated for risk scenarios definitions, particularly for analysis and adaptation to phenomena linked to hydrogeological instability and seismic vulnerability of the land (Campagna & Craglia, 2012; Amato et al., 2015; Campagna, 2016; Martellozzo et al., 2018; Giuliani et al., 2020; Scorza et al., 2020). Furthermore, in recent years, the amount of research aiming to define possible scenarios for the development of urban settlements has increased. Those researches employ GIS capabilities in assessing land resources, namely the ones linked to natural assets and ecosystem services (Arcidiacono & Ronchi, 2019; Campagna, 2016; Manganelli et al., 2016; Martellozzo et al., 2018; Scorza et al., 2020).
The application of methodologies traditionally applied to the analysis of physical risk, to the study of health risk, does not constitute an element of novelty, on the contrary! Already in 1854, the English epidemiologist John Snow had used a tracing system, during a cholera epidemic in London, to trace the source of the infection. However, in recent years the use of GIS software for this type of applications has been limited as recent seismic and flood events, partly related to climate changes too, have imposed other research priorities and today, the use of GIS for urban management and adaptation to health risk is a field that is suitable for numerous experiments.
The aim of this article is therefore to propose a reflection on the importance of applying this same approach to health risk management, reflecting on what happened in the first months of 2020, with the Covid-19 pandemic, in order to draw lessons from it for the future (Murgante et al., 2020).
The ex post analysis can help us to understand what is important to monitor, such as fundamental data for the management of the phenomenon, with reference to the three variables (hazard, exposure and vulnerability) that contribute to the definition of the level of risk.
In thus work we propose an analysis of data on the spread of infection and mortality, with a focus on northern Italy, the area most affected by the disease.
To apply the definition of risk to a pandemic, the "exposure" variable will certainly be a function of the population living in the territory affected by the virus. Population will be investigated not only in absolute terms (the number of people residing or present in that territory), but also by studying specific features to which can be linked different characters of vulnerability.
The variable "hazard", essentially morbidity in the epidemiological sense, depends on factors such as the spread of the virus, its contagiousness and virulence. A topic that can be addressed both with epidemiological models specific to the medical sciences and by analysing the available health data. With reference to the case study, the number of infections detected in the area compared to the total population was considered an expression of the hazard.
M.Tiboni, D.Vetturi, C.Alexander, F.Botticini - Data analysis and mapping for monitoring health risk.
In relationship to the type of health risk to which people are exposed it is possible to have different individual vulnerability degrees. Those degrees are related to the so-called unchangeable risk factors such as age, gender, ethnicity or genetic aspects and changeable risk factors like nutrition, lifestyle and past illnesses. This is only one of the aspects that contribute to define vulnerability. Beyond individual vulnerability it is important to study systemic vulnerability too. This aspect depends on how the system (social system, health system, …) can react when a phenomenon occurs.
To understand the difference between the two components of this variable it is feasible to consider as an example the case of seismic risk: in this case vulnerability is given by both the capability of single structures or buildings to respond to seismic stresses that allows them to remain undamaged until the event reaches a certain threshold (assuming their construction according to anti-earthquake criteria) and how the anthropic system react to the event.
To better understand this second vulnerability aspect it is useful to think at the interruption of a road due to the collapse of a bridge: systemic vulnerability will be lower if the system is able to react identifying temporary solutions that will guarantee the accessibility to the isolated territory (with the creation of a new alternative path or a new temporary structure that can replace the fallen one) in the short and midterm or, in the long term, with more articulate and complex solutions. These solutions can lead to a rearrangement of the previous vulnerable system.
2.2 Data analysis and mapping
For the analysis of the spread of Covid-19 epidemic in Italy and in the northern regions we have considered data coming from different sources:
−
data about the daily number of affected people registered by Territorial Health Agencies (ATS) of Brescia province in the period from March 4th 2020 to April 11th 2020, subdivided by day and City of residence;−
data about resident people distribution in Italian Municipalities observed by ISTAT on January 1st 2019and subdivided into classes of gender and age. This is the last official available datum about resident population in Italy;
−
mortality archive registered between January 1st and April 15th related to the five-year period 2015-2019for all of Italian Municipalities and the update related to the same period for the year 2020 observed by ISTAT for those part of Municipalities who joined the early data collection. Data are available with information related to any cause of death in Italy, distributed by city of residence, ages and day of the year.
If the last two data have an irrefutable validity as they are based on the official information of municipal registries (residing in 2019 and dead until 15.04.2020) the spread of the infection has a very reduced reliability as it is now clear that in the critical period of the emergency, and namely in the Lombardy Region, this figure largely underestimates this phenomenon due to the limited monitoring activities implemented by the regional health authorities.
However, it is possible to consider that datum as a valid form of sampling for understanding the spatial and temporal distribution of the phenomenon. Absolute values don’t have the same value. Today there is no official and validate figure about the extension of the phenomenon and the spread of the disease.
Using a desktop GIS software, it was feasible to manage layers containing georeferenced data about the spread of the pandemic. This allows to obtain maps at municipal, provincial and regional scale and heat map that are referred to sequential time thresholds. They show the temporal evolution of the spatial distribution of the pandemic.
M.Tiboni, D.Vetturi, C.Alexander, F.Botticini - Data analysis and mapping for monitoring health risk.
349 - TeMA Journal of Land Use Mobility and Environment. Special Issue | Covid-19 vs City-20
Although it is now publicly ascertained that the number of official infections in Lombardy, the region most affected in Italy, as well as that of deaths officially associated with the virus, are only the tip of the iceberg, for the small number of diagnoses made, however, it is valid It is worth seeing how this tip of the iceberg has moved over the territory over time, as illustrated in Figures 1 and 2, relating to the province of Brescia.
(a) 04.03.2020 (b) 17.03.2020 (c) 20.03.2020 (d) 03.04.2020
Fig. 1 Brescia province, variation in time and space of the number of positive Covid-19 cases per 100 inhabitants
Why is a detailed mapping of contagions essential? Obviously to identify and isolate the outbreaks, to see how the phenomenon moves on the territory, but also to see what are the effects of the measures put in place. The work could be even more detailed, going down to the street and house number scale. If the infection was identified more precisely, this would allow activating a tracing process, isolating the cases found and their contacts. A model approach to the spread of this type of contagion is precisely that implemented for this same pandemic in other territories such as South Korea and Taiwan.
The analysis cannot be addressed only on a large area scale, with data aggregated by province, because the problem must be tackled locally.
Fig. 2 Possible identification of the routes for spreading the infection through the mapping of cases
On the contrary, the choice to operate by analysing the number of deaths and the comparison with the average of the previous five years, is irrefutable and, however extreme, a quantitative sign of the effects of the pandemic on the population.
M.Tiboni, D.Vetturi, C.Alexander, F.Botticini - Data analysis and mapping for monitoring health risk.
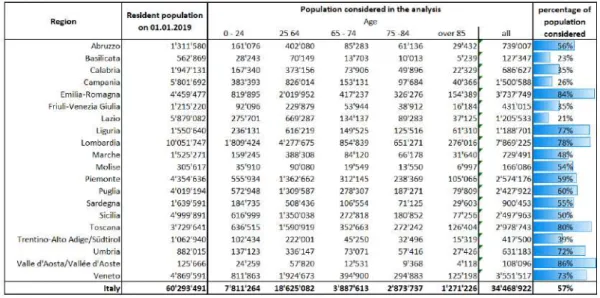
As shown in Tab. 1, mortality data for 4,252 Italian municipalities were considered (in red in the map of Figure 3), out of a total of 7,904 and represent 57% of the Italian population. The distribution of the municipalities that participated in the data collection promoted by ISTAT is mainly concentrated in the northern regions that are most affected by the pandemic. For that area the population considered in the mortality analysis represents 69% of the residents while in the centre 56% and in southern Italy 44%.
Tab.1 Distribution of the resident population in Italian Regions and in the municipality considered in the mortality analysis
Fig. 3 In red municipalities included in analysis of mortality with data collection promoted by ISTAT
The Tab. 1 also shows the breakdown of the resident population by age group considering five different classes: young people up to 24 years old, working age adult (25-64 years) and elderly population divided into three subclasses (65-74 years, 75- 84 years and over 84 years old).
As shown in Table 2, the number of deaths recorded in Italy in the year 2020 shows significant differences only for some regions and only for some age classes. The Covid-19 epidemic did not affect the different Italian regions in the same way, but it was concentrated in some regions of northern Italy. In this section we will not investigate the reasons for differences in mortality, just identity them.
The analysis was also conducted at the level of the 105 provinces in which the municipalities that participated in the transmission of mortality data to the National Statistics Institute fall, with results superimposable to the considerations that emerged on a regional basis.
M.Tiboni, D.Vetturi, C.Alexander, F.Botticini - Data analysis and mapping for monitoring health risk.
351 - TeMA Journal of Land Use Mobility and Environment. Special Issue | Covid-19 vs City-20
Tab. 2 Number of deaths in period 01.01 – 15.04 for pre Covid-19 period (average 2015-19) and in the year 2020, and difference
Fig. 4 Number of deaths in period 01.01 – 15.04 for age
It is also possible to give a territorial representation of the same information using thematical maps generated with a GIS software starting from data presented in summary form in Tab. 2 but also available at municipal level. The two Figures 6a and 6b present the distribution of mortality on the national territory in the five years preceding the Covid-19 epidemic (a) and subsequently. Data indicate the number of deaths recorded per 100,000 inhabitants in the period 01.01 - 15.04 of each year, for a total of 105 days observed.
Fig. 5 (a) Deaths per 100,000 inhabitants – Average of years 2015-2019 and (b) Deaths every 100.000 inhabitants – year 2020
M.Tiboni, D.Vetturi, C.Alexander, F.Botticini - Data analysis and mapping for monitoring health risk.
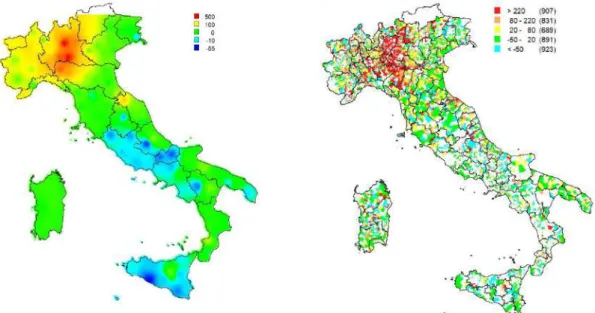
Fig. 6 (a) Variation of deaths per 100,000 inhabitants – year 2020 VS average 2015-2019and (b) Variation of deaths per 100,000 inhabitants – year 2020 VS average 2015-2019 subdivided for Municipalities
The two figures show the variation in mortality recorded in the same period in the form of a heat map (a) and on a municipal basis (b). The white areas indicate the territories of the municipalities that did not participate in the timely transmission of the mortality data.
Table 3 shows the distribution of mortality by age group and by region.
Tab. 3 Number of deaths in period 01.01 – 15.04 for preCovid period (average 2015-19) and in the year 2020, and difference in age group
A further analysis that has been developed is the one related to the variation of mortality on a municipal basis assuming time as a variable. Fig. 4 shows the overall trend of mortality in Italy and Lombardy and its distribution among the different age groups.
M.Tiboni, D.Vetturi, C.Alexander, F.Botticini - Data analysis and mapping for monitoring health risk.
353 - TeMA Journal of Land Use Mobility and Environment. Special Issue | Covid-19 vs City-20 Fig. 7 Time history of daily mortality in Italy (a) and in Lombardy (b) for different age groups
From the analysis of these graphs, some considerations emerge: the age group most affected by the epidemic is that of the oldest population, over 65 years of age and especially for those over 85.
The population groups composed of young (under 25 years old) and adult (25-64 years old) are affected marginally in terms of mortality.
The second consideration regards temporal and spatial aspects: from early March the number of Covid-19 cases in Lombardy was much more notable, implying that the virus had been circulating since at least late February.
The provincial analysis shown in Fig. 5 highlights that the infection started from the province of Lodi (yellow) to first involve Cremona (pink) and Bergamo (dark blue), finally followed by Piacenza (light blue) and Brescia (orange) The province of Milan (green) on the contrary was affected only marginally by the event. The national (red) and regional trends of Lombardy (blue) are reported too and are shown as dotted line.
Fig. 8 Time series of daily mortality in various northern Italian provinces
March 8th 2020 is highlighted because it is the day on which the national government announced the lockdown of all of Italy, while restrictive measures were adopted only for Lodi area in the previous days. From this graph it is possible to understand that these measures were adopted only after the disease was already widespread and many deaths had occurred.
Similar considerations can be made at the regional level as shown in Fig. 6. The change in anomalous mortality spread first in the Lombardy region and then continued in Emilia Romagna and Piedmont. The Veneto region did not have a significant variation in mortality, although the first cases of Covid-19 were recorded in that area in the same days in which the cases in the province of Lodi were found.
M.Tiboni, D.Vetturi, C.Alexander, F.Botticini - Data analysis and mapping for monitoring health risk.
It is significant to note that the regions of southern Italy, Campania was reported as an example, have had, in relation to the lockdown, a reduction in mortality compared to the ordinary situation.
Fig. 9 Time history of daily mortality in some regions of Italy
Finally, the same analyses were performed, based on the data of the individual municipalities, and it was possible to map them.
Fig. 10 Deaths variation map 2020 VS average 2015-2019 at municipal level
Jan 1st-Feb 25th Jan 1st-Mar 10th Jan 1st-Feb 25th Jan 1st-Apr 7th
Fig. 11 Deaths variation map 2020 VS average 2015-2019 at municipal level
The maps developed on a provincial scale for the entire national territory show that the area of Bergamo, Lodi, Brescia, Cremona and Piacenza is the one with the highest number of confirmed deaths and with the greatest variation in mortality compared to the previous five-year period.
M.Tiboni, D.Vetturi, C.Alexander, F.Botticini - Data analysis and mapping for monitoring health risk.
355 - TeMA Journal of Land Use Mobility and Environment. Special Issue | Covid-19 vs City-20
No further statistical analyzes are presented in this paper about the mortality data presented, however several considerations have been made using the ANOVA variance analysis.
Preliminarily, it was analyzed with a one-way ANOVA analysis if there were no significant variabilities in relation to the 2015-19 mortality data, and if for each province the average deaths in the observation period could be considered constant in the five years considered. This analysis gave a positive result with good significance (alpha<0.05 for all the provinces considered). The analysis was considered considering the 105-day period divided into 15 weeks. This result made it possible to consider the average mortality of the five-year period as a reference, for each individual province, for mortality variation analysis.
After, a two-way ANOVA variance analysis was conducted to verify whether the variation in mortality observed in 2020 relative to the Covid pandemic was statistically significant different from the variation in mortality for the provinces most affected by the phenomenon (first classification) and in the period following the beginning of the pandemic (second classification). This analysis also gave a positive result.
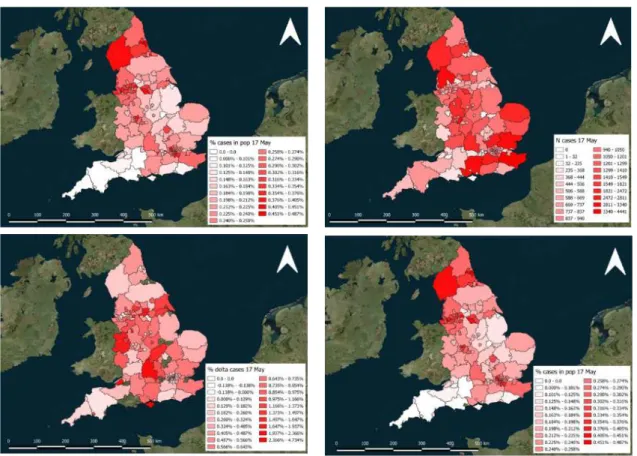
This kind of analysis was widely implemented to monitor data all over the world. Similar maps and data elaborations have been developed to monitor the level of the disease in England too (Fig. 12).
These maps show the evolution of the phenomena in relations to different parameters assessed with geodata analysis and georeferenced with a desktop GIS software which allows to understand which is the spatial development of the disease.
As it was done for the Italian case, similar analyses were developed for the British case too Fig.13) in which is explained the outbreak of the virus referred to different scales, such as national or regional (Upper Tier Local Authorities).
The British case study and the Italian ones are similar because they both consider the mortality rate related to the distribution of people because, as it was said by Frank Snowden: "Data for mortality were always more reliable than those for morbidity” (Snowden, 2019).
M.Tiboni, D.Vetturi, C.Alexander, F.Botticini - Data analysis and mapping for monitoring health risk.
Fig. 13 Example of maps at Upper Tier Local Authority level in England.
2.3 From desktop GIS to dashboards for sharing information and supporting
decision-making
The processing of the information layers described above allowed to move to the next step in which the processed data were uploaded on interactive online platforms, with a purpose that could be both communicative and operational (Environmental Systems Resource Institute, 2020a).
Risk communication should not be underestimated. Public administrations, at all levels, often have to manage complex situations linked to environmental health determinants, sometimes in a tense climate. There are many factors that contribute to a rapid aggravation of events. These may also include greater sensitivity to uncertain risks, an unequal distribution of risks and benefits and less trust in institutions and bodies responsible for public health decisions.
This is why it is important to manage information, evidence and communication of possible risks (Environmental Systems Resource Institute, 2020b, 2020c).
The online platforms offer different solutions such as webmaps and dashboards (Fig. 14), in which the georeferenced data are accompanied by a series of interactive and customizable graphs and indicators. Therefore, they are useful to communicate the developed analyses and processed data with possible users. Users that can be both technical analysts employed in the decisions field or common people.
Fig. 14 Example of dashboards with visualization of numerical elaborations and data mapping, in order to highlight the diffusion of the phenomenon at national, provincial, municipal level
This kind of dashboard is highly used worldwide. Thanks to the possibility to customise the interface and add graphs and data they found broad diffusion as a solution to highlight up-to-date data that would help local authorities and residents to make decisions to reduce the impacts of the disease (Geraghty & Lanclos, 2020)
M.Tiboni, D.Vetturi, C.Alexander, F.Botticini - Data analysis and mapping for monitoring health risk.
357 - TeMA Journal of Land Use Mobility and Environment. Special Issue | Covid-19 vs City-20
and are an example of how experts in geodata analysis can have an important role in assessing and reducing health risk (Fig. 15).
Fig. 15 Example of dashboards developed to monitor the evolution of the epidemic in Florida in which data about the illness have been linked to the ZIP code to obtain the spatial distribution of the virus.
Webmaps and dashboards have the advantage of being able to be interrogated and therefore each object is associated with popups that "explain" the information shown on the map. They also offer the possibility of comparing different cartographies, namely, with the creation of dashboards it is possible to highlight different themes in parallel, thus allowing to immediately observe the variation of the analysed phenomenon in relation to previously fixed parameters.
This type of tool has a double value: on one hand it can be used to provide citizen with information on the phenomenon and its evolution and, on the other side, it can be a grounding point to build a system for the monitoring phase that can provide data to engage the decision-making process at all levels.
For communication purposes, data are shown in aggregate form, without violating the privacy rules (Environmental Systems Resource Institute, 2020a). This, in fact, is a very sensitive issue in the world of online applications, as there is risk of disclosing personal information. However, by showing the overall value by territorial portions, the point references to individual cases are lost and only the general trend for the analysed area is shown.
Different is the case in which the applications are intended for decision makers for the emergency phase in which the aggregate data may not be enough.
3. A lesson for the future: knowing how to provide support for risk
management and decision making
What have we learned from this pandemic that has affected one of the most populous areas in Italy? The need to have a system for monitoring phenomena connected to health risk has certainly emerged, aimed at promptly intervening and implementing procedures to contain the spread of the phenomenon.
We have seen that GIS can be, for this purpose, an important support tool, both from an operational point of view and as a communication and information tool, thanks to the spatial-temporal mapping of data. What everyone sees, after an event has occurred, is nothing more than the consequence of previous actions (or failure to act). In other words, a highly vulnerable area will be struck heavily by a calamity, not because the event is exceptional, but because the area is not sufficiently protected against that eventuality.
We can now add that this implies the need to tackle latent emergencies, before they actually arise. The latent emergency concept is fundamental for understanding the “risk mitigation” concept.
If it is understood that an area has some imminent hazards, it is necessary to act in order to reduce the damage. Given that, for example, we cannot prevent earthquakes, all we can do is try to draw as near as possible to V = 0 so that we can face on the events without suffering damage.
The three systems to be worked on, with structural and non-structural operations, are:
M.Tiboni, D.Vetturi, C.Alexander, F.Botticini - Data analysis and mapping for monitoring health risk.
−
the social system, which expresses the social vulnerability; this includes all the measures of a collective nature that can be put in place, such as more careful regional planning;−
the political system, which expresses management (or organizational) vulnerability. In this case, “political” means the ability to equip ourselves, forward thinking in the organization of human resources, precise planning, but also creating public awareness and generating agreement on technical/organizational measures, necessary in order to prevent things from happening, and not after an event has occurred. If the politician/decision-maker ignores the seriousness of the latent phase, the vulnerability of the regional system increases exponentially.These first studies carried out on the pandemic from Covid-19, with an in-depth study of the Lombardy provinces, show how appropriate and indispensable it is to prepare surveillance, prevention and limitation plans for the disease, in order to modulate the health risk. Diagnostic ability is essential for disease control and surveillance (the topic is discussed in many papers, among others we mention Ascione et al., 2013; Torrisi et al., 2017; Gargiulo et al., 2018).
As with all dangerous situations, what must be assessed is the socially acceptable risk of a present danger. In the case of the Covid-19 pandemic, the Lombard system has proved in our view extremely vulnerable from a systemic point of view. The management of human health has not been able to contain the spread of the phenomenon, on the one hand by not promptly identifying the first cases of contagion, and then, with the large numbers, not having the adequate structures to deal with the health emergency.
A systemic vulnerability that has dragged individual vulnerability (it is sufficient to think about the age groups most affected), thus amplifying the overall risk. There is certainly also a need to reflect on the general rejection of what was happening. It is surprising that the finding of the virus in a young patient with incurable pneumonia was random and not the result of a monitoring plan that was to be expected.
Western countries are united in their failure to recognize the globalization of disease: if a person can travel from Beijing to Milan in 12 hours, so can a virus!
References
Amato, F., Pontrandolfi, P., & Murgante, B. (2015). Supporting planning activities with the assessment and the prediction of urban sprawl using spatio-temporal analysis, Ecological Informatics, 30, 365–378. https://doi.org/10.1016/j.ecoinf.2015.07.004
Arcidiacono, A., & Ronchi, S. (2019). Adopting an Ecosystem Services-Based Approach for Flood Resilient. The case of Rocinha Favela (Brazil), Sustainability, 11(1), 4.https://doi.org/10.3390/su11010004
Ascione, F., De Masi, R. F., de Rossi, F., Fistola, R., Sasso, M., & Vanoli, G. P. (2013). Analysis and diagnosis of the energy performance of buildings and districts: Methodology, validation and development of Urban Energy Maps, Cities, 35, 270– 283. https://doi.org/10.1016/j.cities.2013.04.012
Campagna, M. (2016). Metaplanning: About designing the Geodesign process. Landscape and Urban Planning, 156, 118– 128. https://doi.org/10.1016/j.landurbplan.2015.08.019
Campagna, M., & Craglia, M. (2012). The socioeconomic impact of the spatial data infrastructure of Lombardy. Environment and Planning B: Planning and Design, 39(6), 1069–1083. https://doi.org/10.1068/b38006
Environmental Systems Resource Institute. (2020a). Geographic Information Systems for Coronavirus Planning and Response [online]. Retrivied from https://www.esri.com/training/catalog/5e8d11541fe054449dca8132/geographic-information-systems-for-coronavirus-planning-and-response/
Environmental Systems Resource Institute. (2020b). Facility Mapping Solutions for COVID-19 Response cGIS Location Tracking Privacy Best Practices [online]. Retrivied from https://coronavirus-resources.esri.com/datasets/7ccaf0d0be7149629c305fbf9d369dad
Environmental Systems Resource Institute. (2020c). ArcGIS Location Tracking Privacy Best Practices [online]. Retrivied from
M.Tiboni, D.Vetturi, C.Alexander, F.Botticini - Data analysis and mapping for monitoring health risk.
359 - TeMA Journal of Land Use Mobility and Environment. Special Issue | Covid-19 vs City-20
Fistola, R. (2011). The unsustainable city. Urban entropy and social capital: The needing of a new urban planning. Procedia Engineering, 21, 976–984. https://doi.org/10.1016/j.proeng.2011.11.2102
Fistola, R., Gallo, M., Rocca, R. A. La, & Russo, F. (2020). The effectiveness of urban cycle lanes: From dyscrasias to potential solutions, Sustainability, 12(6), 1–22. https://doi.org/10.3390/su12062321
Foster, H. (1980). Disaster Planning: The Preservation of Life and Property. New York: Springer Verlag.
Gargiulo, C.; Sforza, A.; Sterle, C.; & Zucaro, F. (2018). An Optimization Model Fitting the Neighborhood Sustainability Assessment Tools, Sustainability,10, 3365. https://doi.org/10.3390/su10103365
Geraghty, E., & Lanclos, R. (2020). COVID-19: Dedicated Scientist in Florida Made Quick Moves to Map the Disease. Retrieved from https://www.esri.com/about/newsroom/blog/scientist-maps-florida-covid19-cases/
Giuliani, F., De Falco, A., & Cutini, V. (2020). The role of urban configuration during disasters. A scenario-based methodology for the post-earthquake emergency management of Italian historic centres, Safety Science, 127, 104700. https://doi.org/10.1016/j.ssci.2020.104700
Greco A, Pluchino A, Barbarossa L, Barreca G, Caliò I, Martinico F, Rapisarda A. (2019) A New Agent-Based Methodology for the Seismic Vulnerability Assessment of Urban Areas. ISPRS International Journal of Geo-Information, 8(6) 274. https://doi.org/10.3390/ijgi8060274
La Rosa, D., Privitera, R., Martinico, F., & La Greca, P. (2013). Measures of Safeguard and Rehabilitation for landscape protection planning: A qualitative approach based on diversity indicators, Journal of Environmental Management, 127, S73-S83. https://doi.org/10.1016/j.jenvman.2012.12.033
Manganelli, B., Di Palma, F., Amato, F., Nolè, G., & Murgante, B. (2016). The Effects of Socio-Economic Variables in Urban Growth Simulations, Procedia - Social and Behavioral Sciences, 223, 371–378. https://doi.org/10.1016/j.sbspro.2016.05.247 Martellozzo, F., Amato, F., Murgante, B., & Clarke, K. C. (2018). Modelling the impact of urban growth on agriculture and natural land in Italy to 2030, Applied Geography, 91, 156–167. https://doi.org/10.1016/j.apgeog.2017.12.004
Murgante, B., Borruso, G., Balletto, G., Castiglia, P., & Dettori, M. (2020). Why Italy First ? Health , Geographical and Planning aspects of the Covid-19 outbreak, Preprints, 2020050075. https://doi.org/10.20944/preprints202005.0075.v1 Scorza, F., Pilogallo, A., Saganeiti, L., Murgante, B., & Pontrandolfi, P. (2020). Comparing the territorial performances of renewable energy sources’ plants with an integrated ecosystem services loss assessment: A case study from the Basilicata region (Italy), Sustainable Cities and Society, 56, 102082. https://doi.org/10.1016/j.scs.2020.102082
Snowden, F. M. (2019). Epidemics and society: from the black death to the present. Yale University Press.
Tiboni, M. (2007). Natural Risk Assessment And Management. In N. Munier (editor), Handbook on Urban Sustainability, pp.567-605, Dordrecht: Springer. ISBN:978-1-4020-5350-4,
Tiboni, M., & Tira, M. (1997). Land-use dynamics and environmental hazards caused by ageing population in low density peripheral regions, Proceeding of the 37th Congress of European Regional Science Association, Roma
Tira, M., Tiboni, M., Badiani, B., Confortini, C. (2006). Urban infrastructures and physical hazards: a challenge for planning, In: V. Popov & C.A. Brebbia (Eds.). Risk Analysis. Simulation and hazard mitigation, pp. 153-161, Southampton:WIT Press. ISBN: 9781845641726
Tira, M. (1997). Pianificare la città sicura. Bari: Edizioni Librerie Dedalo.
Tira, M., & Zazzi, M. (2012). Pianificazione territoriale e difesa del suolo: quarant’anni dopo la relazione De Marchi . Atti del Convegno nazionale, Roma, 2-3 dicembre 2010. Gangemi.
Torrisi, V., Ignaccolo, M., & Inturri, G. (2017). Estimating travel time reliability in urban areas through a dynamic simulation model. Transportation Research Procedia, 27, 857-864.
Varnes, D.J. & IAEG Commission on Landslides (1984). Landslides Hazard Zonation – a review of principles and practice. Paris: UNESCO.
Zoppi, C., & Lai, S. (2011). Urban development and expenditure efficiency in the 2000-2006 regional operational program of Sardinia, Land Use Policy, 28(3), 472–485. https://doi.org/10.1016/j.landusepol.2010.10.001
Zoppi, C., & Lai, S. (2014). Land-taking processes: An interpretive study concerning an Italian region, Land Use Policy, 36, 369–380. https://doi.org/10.1016/j.landusepol.2013.09.011
M.Tiboni, D.Vetturi, C.Alexander, F.Botticini - Data analysis and mapping for monitoring health risk.
Image Sources
Fig.1: Processing of ATS Brescia and ATS Valle Camonica; Fig.2: Processing of ATS Brescia and ATS Valle Camonica;
Fig.3: Processing of ISTAT data (Deaths 2015-2020, observation period Jan 1st-Apr 15th); Fig.4: Processing of ISTAT data (Deaths 2015-2020, observation period Jan 1st-Apr 15th); Fig.5: Processing of ISTAT data (Deaths 2015-2020, observation period Jan 1st-Apr 15th); Fig.6: Processing of ISTAT data (Deaths 2015-2020, observation period Jan 1st-Apr 15th); Fig.7: Processing of ISTAT data (Deaths 2015-2020, observation period Jan 1st-Apr 15th); Fig.8: Processing of ISTAT data (Deaths 2015-2020, observation period Jan 1st-Apr 15th); Fig.9: Processing of ISTAT data (Deaths 2015-2020, observation period Jan 1st-Apr 15th); Fig.10: Processing of ISTAT data (Deaths 2015-2020, observation period Jan 1st-Apr 15th); Fig.11: Processing of ISTAT data (Deaths 2015-2020, observation period Jan 1st-Apr 15th); Fig.12: Processing of PHE - Public Health England data;
Fig.13: Processing of PHE - Public Health England data; Fig.14: Processing of ATS Brescia and ISTAT data; Fig.15: Geraghty & Lanclos, 2020;
Tab.1: Processing of ISTAT data (Deaths 2015-2020, observation period Jan 1st-Apr 15th); Tab.2: Processing of ISTAT data (Deaths 2015-2020, observation period Jan 1st-Apr 15th); Tab.3: Processing of ISTAT data (Deaths 2015-2020, observation period Jan 1st-Apr 15th).
Author’s profile
Michela Tiboni
Civil Engineer, Full Professor of Town and Regional Planning, Ph.D. in Town planning technique at the Polytechnic of Milan (2000), her main fields of research are Land-use dynamics and environmental hazards, Evaluation of plan previews for a safe and sustainable town, Urban policies and techniques towards a safer town. Since 2013 she is urban planning councilor of the City of Brescia.
Michèle Pezzagno
Architect, Associate Professor of Town and Regional Planning, Ph.D. in Town planning technique at the Polytechnic of Milan (2001), her main fields of research are land-use planning, urban renewal in relation to urban policies, applying planning techniques for a safer town
David Vetturi
Mechanical Engineer, Associate Professor of Mechanical and Thermal Measurements, Ph.D. in Applied Mechanics, the main areas of research are: the study of the dynamics of the vehicle and of the related measurement systems; the development of soft-computing algorithms for the analysis of mechanical systems (neural networks and genetic algorithms); experimental analysis of the dynamic behavior of materials; problems concerning vibration measurements.
Craig Alexander
Quantitative archaeologist and data analyst. PhD in GIS applied to Iron Age Valle Camonica, Master's thesis simulating the Neolithization of Italy, undergraduate education in mathematical economics - all at University of Cambridge. Research interests in quantitative spatial analysis
Francesco Botticini
Civil Engineer, Ph.D. students Civil and Environmental Engineering, International Cooperation and Mathematics with the Urban Planning and Transportation curriculum, his main research fields are the enhancement of architectural heritage urban regeneration processes, urban resilience and the implementation of GIS software to develop functional databases to support spatial planning decisions.