3
“
N
on est ad astra mollis
e terris via”
Lucius Annaeus Seneca5
INDEX
PREFACE 7 ABSTRACT 9 RIASSUNTO 13 PART I 17GLIOBLASTOMA WITH PRIMITIVE NEURONAL COMPONENT: IMMUNOPHENOTYPICAL AND MOLECULAR
CHARACTERIZATION 17
Glioblastoma 19
Subclassification of glioblastoma based on genetic alterations and gene expression profiles into subtypes
associated with distinct clinical features 20
Hypermutation in human cancer 26
Tumour heterogeneity reflects distinct genetic alterations and gene expression profiles within the same tumour
bulk 27
Glioblastoma with Primitive Neuronal Component 30
MATERIALS AND METHODS 33
Patient cohort 33
Immunostaining on paraffin-embedded sections 33
IDH Pyrosequencing assay 34
Evaluation of MGMT promoter methylation status 35
Fluorescence In Situ Hybridization (FISH) 35
DNA methylation-based CNS tumour classification using a comprehensive machine learning 35
Next Generation Sequencing 37
Statistical analysis 38
RESULTS 41
Patient cohort and clinical-pathological features 41
Immunohistochemical profile 43
Evaluation of molecular alterations of diagnostic value 45
Evaluation of biomarkers of diagnostic value 48
Expression of gene classifiers and attribution of transcriptional GBM subtypes 50 GBM-PNC classification based on genome-wide DNA methylation profiles 51
Genetic Analysis by Next Generation Sequencing 57
APPENDIX 65
PART II 71
CONTRIBUTION OF EBF3 TO THE NEURONAL CELL COMMITMENT 71
INTRODUCTION 73
Early-B cell Factors (EBFs) 74
Clustered Regularly Interspaced Short Palindromic Repeats (CRISPR)/Cas9 technology 77
MATERIALS AND METHODS 83
6
GSCs culture and viral transduction 87
Nucleic acid extraction 90
Reverse Transcription‑Quantitative Polymerase Chain Reaction (RT-qPCR) 90
Western blot 90
Short-Term Self-Renewal Assay (Clonogenic Assay) 91
Long-Term Self-Renewal Assay (Growth Curve/Population Assay) 91
Differentiation assay 91
Cell blocks preparation 91
Animal procedures 91
Statistical analysis 92
RESULTS 93
Generation and characterization of GSCs knockout and overexpressing EBF3 clones 93 Effect of EBF3 on cell proliferation and self-renewal ability 96
Effect of EBF3 on cell fate differentiation 97
In vivo transplantation of BT483 transduced clones 102
DISCUSSION 105
LIST OF ABBREVIATIONS 113
REFERENCES 117
7
PREFACE
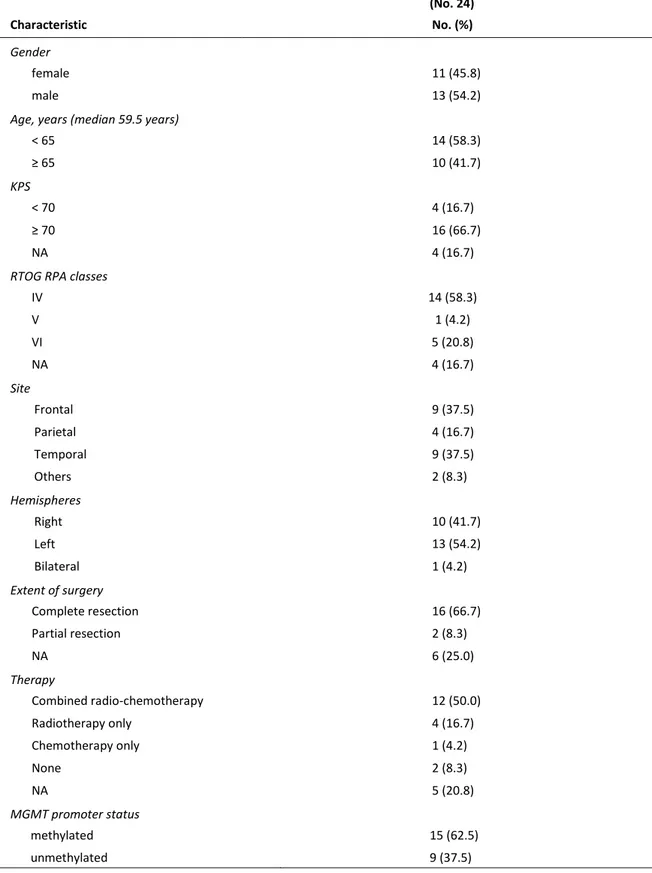
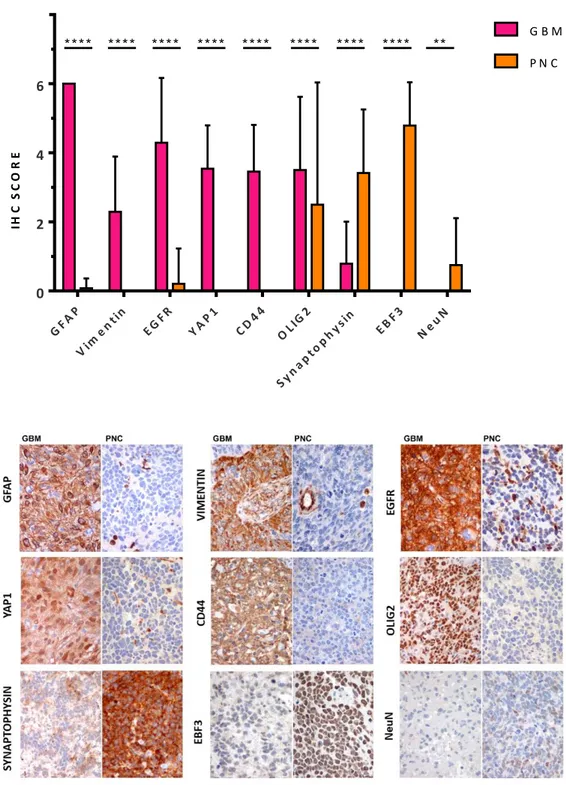
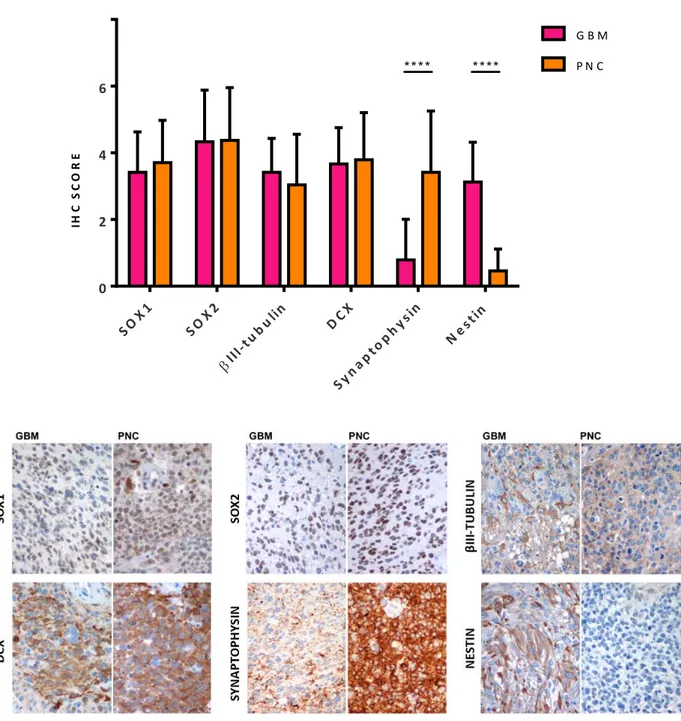
“Glioblastoma with Primitive Neuronal Component” (GBM-PNC) is a rare histological variant of Glioblastoma, consistent of a mixed glial component with nodules of immature cells that display an early neuronal differentiation. Since GBM-PNC is a rare tumour, only few data regarding their characterization and their molecular alterations are available. We proposed to collect a consistent number of samples, in order to extensively characterise this rare Glioblastoma variant from a phenotypical and molecular point of view. In detail, the main focus was to find common or distinctive features for each of the two components, in order to shed a light on the origin of these tumours and on the evolution of the two components, whether common or subsequent. Moreover, we searched for a putative molecular alteration that could predict the development of GBM-PNC and distinguish them from the other GBM subtypes.
We then collected a cohort of 24 patients and deeply analysed these tumours, as detailed in the Part I of the present thesis work.
EBF3 is a transcription factor that, in the Central Nervous System, plays a key role in the process of neurogenesis and neuronal migration and in the differentiation towards the neuronal cell fate. Moreover, EBF3 gene is frequently deleted or methylated in both primary and secondary glioblastomas, as well as in other tumour types, where epigenetic alterations are linked to tumour progression and metastatic ability, suggesting a potential role as tumour suppressor gene in the brain. In a previous paper, we demonstrated that in medulloblastoma, a malignant embryonal brain tumour, EBF3 is highly expressed and acts as a major master regulator of neuronal differentiation. However, its sustained expression correlates with an immature phenotype, confirmed by lack of expression of mature markers of neuronal differentiation, and contributes to promote neoplastic progression, acting, according to specific cell contest, as an oncogene. For these reasons, we investigated EBF3 expression in GBN-PNC and, notably, we found that EBF3 was selectively expressed in the PNC and constantly negative in the GBM component.
We hypothesized that EBF3 could have a major role in driving the divergent differentiation of the two components. In order to elucidate its function, we created a CRISPR/Cas9 EBF3 knockout model using a GBM stem cell line expressing EBF3. Concurrently we forced an EBF3 negative GBM stem cell line to overexpress EBF3 by lentiviral transduction. These data are reported in Part II of the present thesis work.
9
ABSTRACT
PART I GLIOBLASTOMA WITH PRIMITIVE NEURONAL COMPONENT:
IMMUNOPHENOTYPICAL AND MOLECULAR CHARACTERIZATION
“Glioblastoma with Primitive Neuronal Component” (GBM-PNC) is a rare histological variant of Glioblastoma, consistent of a mixed glial component with nodules of immature cells that display an early neuronal differentiation. We collected a cohort of samples (n=24) in order to deeply characterize these tumours. Patients with GBM-PNC have a lower median age at diagnosis (59.5 y/o) and a peculiar topographical distribution, with the temporal and frontal lobes being the most affected brain regions (75% of the cases). We performed immunohistochemical and molecular analysis, comprising Next Generation Sequencing with a GBM-customized panel and Genome Wide Methylation Analysis, on our sample cohort. Our findings confirm the dual phenotype of these tumours, since the GBM components show expression of glial-associated markers (GFAP, YAP1, CD44, Vimentin, EGFR) while the PNC components show immunoreactivity for neuronal/embryonal markers, such as Synaptophysin, NeuN. Noteworthy, c-Myc and n-Myc, a typical feature of the primary CNS-PNET, are basically expressed only in the PNC component. Both components show positivity for early stem cell markers, such as SOX1 and SOX2, and for markers linked to neurogenesis, such as DCX and βIIITubulin. Interestingly, we found a novel biomarker selectively expressed in the PNC and constantly negative in the GBM component: EBF3. EBF3 is a transcription factor usually deleted or methylated in both primary and secondary glioblastomas, but highly expressed in medulloblastoma, a malignant embryonal brain tumour, in which EBF3 acts as a major master regulator of neuronal differentiation. However, its sustained expression correlates with an immature phenotype. The functional role of this transcription factor will be investigated in Part II of the thesis.
Data show that our cohort is enriched in IDH1 mutant tumours (16.7%) and the most represented transcriptional subtypes are the Classical and the Proneural subtypes, globally reaching the 66.7%, for the GBM component. Of note, the majority of the PNC components could not be classified (66.7%), supporting the evidence that this component is mainly constituted by cells with an undifferentiated phenotype. Notably, the presence or absence of molecular alterations, such as IDH1-R123H mutation, loss of ATRX and overexpression of p53, are common features in both components. As a matter of fact, methylation-based classification classified the two components from the same tumour under the same group: one as IDH-mutant GBM, the others as RTK I/II GBMs, classes that correspond to the Classical and Proneural transcriptional subgroups. Copy Number
10
Variation analysis showed for the GBM component the typical GBM profile with gain on chromosome 7 and loss on chromosome 10. Interestingly, the PNC component shows a higher degree of loss and gain of genetic material. Data are in line with the observation that the PNC component does not activate TERT and/or ALT as telomere maintenance mechanism, a feature that may contribute to tumour instability. NGS analysis with a custom panel designed to explore 75 genes that are relevant in GBM and PNC tumours revealed that all the samples harbour high frequency mutations shared between the two components on frequently GBM altered genes, such as TP53, PTEN, IDH1, TERT, PDGFRA, MDM2/4. Interestingly, all samples harbour private molecular alterations specific for each component, suggesting that GBM-PNC tumours may arise from a common ancestor characterized by a set of mutations/amplifications, while other genomic lesions are acquired after the emergence of either GBM and PNC components.
Interestingly, two out of six tumours analyzed by NGS show a high number of subclonal mutations such that we can hypothesize a hypermutator phenotype; mutations are more abundant in the PNC component, in line with the previous observation that this component is genetically unstable. According to the evidence that the EBF3 gene is frequently deleted or methylated in glioblastoma, we found that in 5 samples out of 6 a copy of the EBF3 gene is lost; however, albeit with an allelic loss, EBF3 is expressed in the PNC component, suggesting a specific transcriptional mechanism enabling EBF3 sustained expression.
Altogether, data indicate that GBM-PNCs take their origin from common immature progenitor cells. These cells are endowed with an intrinsic differentiation ability, as happens for neuroectodermic (NEC) progenitors in normal brain development, and may undergo a subsequent differentiation by the accumulation of additional molecular alterations, giving rise to the two components.
A possible genetic hallmark of the GBM-PNC tumours may be represented by mutations in the RB1 gene. In fact, RB1 gene is mutated or deleted in 5 tumours out of the 6 analyzed tumours (83.3%), while the only RB1 wildtype tumour harbours a CDK4 gene amplification that, from a functional point of view, may mimic the RB1 loss. Mutations of RB1 gene are related with the development of CNS-PNETs in children; these tumours display similar features of the PNC component. It has to be clarified how RB1 mutation and regulation of EBF3 expression may interact with each other within the GBM-PNC context.
11
PART II CONTRIBUTION OF EBF3 TO THE NEURONAL CELL COMMITMENT
In the first part of this work, we characterized a cohort of Glioblastomas with Primitive Neuronal Component. Immunohistochemistry analysis showed a glial profile for the GBM component, as expected, while the PNC component, not surprisingly, was usually negative for GBM typical markers. Notably, we found a novel biomarker selectively expressed in the PNC and constantly negative in the GBM component: EBF3. EBF3 is a transcriptional factor belonging to a highly conserved four gene family, with an important role in neurogenesis and neuronal migration. EBF3 is frequently deleted or methylated in both primary and secondary glioblastomas, while in medulloblastoma it acts as a major master regulator of neuronal differentiation, even though its sustained expression correlates with an immature phenotype. Since EBF3 is highly expressed in the PNC component of the GBM-PNC, and is persistently negative in the GBM component, we hypothesized that EBF3 could have a major role in driving the divergent differentiation of the two components. In order to elucidate its function, we developed an in vitro model using different Glioblastoma Stem like Cells (GSC). At first, we created a lentiviral vector targeting EBF3 for CRISPR/Cas9 technology based genome editing. We thus selected a GSC line derived from a GBM-PNC (BT483) that constitutively expressed high levels of EBF3 and created 4 clonal EBF3 knockout GBM-PNC GSCs lines. EBF3 overexpressing cells were obtained by transducing EBF3-negative L0512 GSCs with a lentiviral vector coding for mouse ebf3 full-length cDNA.
EBF3-knockout clones showed a lower kinetic of expansion, as compared to the wildtype clones, while no differences were observed between mock and overexpressing clones. The same difference in self-renewal ability was observed when serial clonogenic assays were performed. We then investigated the expression of differentiation markers in transduced GSCs both under proliferative and differentiative conditions. Glial fibrillary acidic protein (GFAP), an astrocyte biomarker expressed by the glial component of GBM-PNC, appears to be expressed at higher levels in EBF3-knockout clones, at both protein and transcriptional level. Contrariwise, EBF3 overexpressing cells express a lower level of GFAP protein as compared to their mock control. Nestin is generally a recognized marker of undifferentiated CNS cells; it is more expressed in the GBM component of GBM-PNC, with a much lower expression in the PNC. In line with this observation, Nestin was expressed at higher level in EBF3-negative cell lines and at lower level in EBF3 expressing cell lines, as assessed by Western blot, RT-qPCR and IHC on cell blocks.
We then induced to terminally differentiate GSC cell lines through removal of mitogens and exposure to fetal bovine serum, in order to assess whether EBF3 could influence GSCs differentiation
12
ability. The differentiation process occurred efficiently, as demonstrated by the decrease of SOX2, a biomarker indicating an immature profile.
GFAP, reaches overall higher levels in all the clones, as compared to TUBB3, the gene coding for βIII-tubulin protein. Of note, EBF3 wildtype clones, constitutively expressing EBF3, and EBF3 overexpressing cells, whose expression is ectopically induced by viral transduction, showed lower fold increase of both GFAP and TUBB3, as compared to their matched GSC line. This observation suggests that EBF3 expression, both constitutive or induced, could lead to an impaired ability of differentiation.
Preliminary data from in vivo xenografts obtained with EBF3 expressing GBM-PNC derived GSCs show the growth of a biphasic tumour resembling the GBM-PNC, with neoplastic aggregates respectively positive or negative for GFAP and EBF3. Data suggest that GBM-PNC GSCs are endowed with the capacity to modulate EBF3 expression. On the contrary, xenografts from the corresponding EBF3-KO clones show an EBF3 negative tumour with a prominent glial aspect and a more widely distributed GFAP positivity.
13
RIASSUNTO
PARTE I GLIOBLASTOMA WITH PRIMITIVE NEURONAL COMPONENT:
IMMUNOPHENOTYPICAL AND MOLECULAR CHARACTERIZATION
Il “Glioblastoma con componente primitiva neuronale” (GBM-PNC) è una variante istologica rara di Glioblastoma, e si caratterizza per avere una componente di natura gliale ed una componente primitiva neuronale immatura. Abbiamo raccolto una coorte di 24 campioni allo scopo di studiare in modo approfondito questi tumori. I pazienti affetti da GBM-PNC hanno un’età alla diagnosi più bassa rispetto ai GBM convenzionali (59,5); il tumore mostra un sito preferenziale di insorgenza a livello dell’area temporo-frontale (75% dei casi). L’analisi immunoistochimica ha confermato il fenotipo divergente di questi tumori, con la componente GBM positiva per i marcatori associati alla glia (GFAP, YAP1, CD44, Vimentin, EGFR), e la componente PNC positiva per i marcatori neuronali/embrionali, quali Sinaptofisina e NeuN. Degno di nota il fatto che c-Myc e n-Myc, marcatori tipicamente espressi dai tumori primitivi neuronali del Sistema Nervoso Centrale, sono espressi solo nella componente PNC. Ambedue le componenti mostrano immunoreattività per marcatori staminali precoci, quali SOX1 e SOX2, e per marcatori associati alla neurogenesi, quali DCX e βIIITubulina. Notevole l’identificazione di un nuovo marcatore espresso selettivamente dalla componente PNC e costantemente negativo nella GBM: EBF3. EBF3 è un fattore di trascrizione solitamente deleto o metilato nei GBM sia primari che secondari, ma espresso ad alti livelli nel medulloblastoma, un tumore cerebrale embrionale maligno in cui EBF3 ha la funzione di guidare il differenziamento neuronale. Tuttavia, la sua prolungata espressione correla con un fenotipo immaturo. Il ruolo funzionale di questo fattore di trascrizione verrà indagato approfonditamente nella Parte II del presente lavoro di tesi.
I dati mostrano che la nostra coorte è arricchita per tumori mutati per il gene IDH1 (16.7%) ed i gruppi trascrizionali più rappresentati nella componente GBM sono il Classico ed il Proneurale, che raggiungono globalmente il 66.7%. Da notare che la maggior parte delle componenti PNC non vengono classificate in nessun gruppo trascrizionale, supportando l’evidenza che questa componente sia costituita da cellule prevalentemente indifferenziate. Interessante il fatto che la presenza di eventuali alterazioni molecolari, come la mutazione IDH1-R123H, la perdita di ATRX e l’overespressione di p53, è condivisa da entrambe le componenti. In linea con questa osservazione, la classificazione basata sul profilo globale di metilazione di quattro campioni della nostra coorte ha classificato le due componenti dello stesso tumore nella stessa classe: un campione nella categoria IDH-mutant GBM, gli altri nella categoria RTK I/II GBMs, classe che corrisponde ai gruppi
14
trascrizionali Classico e Proneurale. L’analisi di Copy Number Variation ha mostrato per la componente GBM il tipico profilo associato ai glioblastomi, con gain sul cromosoma 7 e loss sul cromosoma 10. Tuttavia, a parità di profilo, la componente PNC mostra un grado maggiore di gain/loss di materiale genetico, dato in linea con l’osservazione che questa componente non attiva né TERT, né ALT come meccanismo di mantenimento dei telomeri, a supporto della maggiore instabilità genetica del tumore. L’analisi in Next Generation Sequencing con un pannello custom comprendente 75 geni rilevanti in GBM e PNC ha rivelato che tutti i campioni portano mutazioni ad alta frequenza condivise dalle due componenti su geni frequentemente alterati nei GBM, quali TP53, PTEN, IDH1, TERT, PDGFRA, MDM2/4. In aggiunta, tutti i campioni portano alterazioni molecolari private in ciascuna componente, suggerendo che questi tumori derivino da un precursore comune caratterizzato da un set di amplificazioni/mutazioni, mentre altre alterazioni genetiche sarebbero acquisite a seguito dell’emergere dei due subcloni riferibili alla componente GBM ed alla PNC. Due dei sei campioni analizzati in NGS hanno rivelato un elevato numero di mutazioni subclonali, tanto da far ipotizzare uno stato di ipermutazione; le mutazioni sono più numerose nella componente PNC, in linea con quanto precedentemente osservato in merito alla maggior instabilità di questa componente. In accordo con quanto frequentemente avviene nei GBM, una copia del gene EBF3 è persa in 5 campioni su 6; ciononostante, EBF3 viene espresso dalla componente PNC, suggerendo un possibile meccanismo di regolazione trascrizionale.
Nel complesso, i dati sembrano indicare che i GBM-PNC derivino da un progenitore comune immaturo; queste cellule sono dotate di una capacità intrinseca di differenziamento, come accade per i progenitori neuroectodermici durante lo sviluppo fisiologico del cervello, e vadano poi incontro ad un successivo differenziamento divergente per accumulo di alterazioni molecolari aggiuntive, portando così allo sviluppo delle due componenti. Un possibile tratto peculiare di questi tumori potrebbe essere la presenza di mutazioni a carico del gene RB1. Infatti, questo gene è risultato essere mutato in 5 tumori sui 6 analizzati (83.3%), mentre il solo tumore wildtype porta un’amplificazione del gene CDK4, alterazione che, dal punto di vista funzionale, mima la perdita di RB1. Mutazioni del gene RB1 sono frequentemente associate allo sviluppo di CNS-PNET in età pediatrica; questi tumori mostrano caratteristiche simili alla componente PNC dei GBM-PNC. Resta da chiarire come mutazioni di RB1 e regolazione dell’espressione di EBF3 possano interagire all’interno del contesto tumorale dei GBM-PNC.
15
PART II CONTRIBUTION OF EBF3 TO THE NEURONAL CELL COMMITMENT
Nella prima parte del presente lavoro di tesi, abbiamo caratterizzato una coorte di Glioblastomi con Componente Primitiva Neuronale. L’analisi immunoistochimica ha rivelato un profilo gliale per la componente GBM, mentre la componente PNC, come atteso, è risultata tendenzialmente negativa per i marcatori gliali. Abbiamo però identificato un nuovo marcatore specifico per la componente PNC: EBF3. EBF3 è un fattore di trascrizione con un importante ruolo nel processo di neurogenesi e migrazione neuronale. EBF3 è frequentemente deleto o metilato nei glioblastomi sia primari che secondari, ma espresso ad alti livelli nel medulloblastoma, un tumore cerebrale embrionale maligno in cui EBF3 ha la funzione di guidare il differenziamento neuronale. Tuttavia, la sua prolungata espressione correla con un fenotipo immaturo. Dal momento che EBF3 è espresso ad alti livelli nella componente PNC dei GBM-PNC, mentre è costantemente negativo nel GBM, abbiamo ipotizzato che possa avere un ruolo fondamentale nel guidare il differenziamento divergente delle due componenti. Allo scopo di indagare la sua funzione, abbiamo creato un modello in vitro utilizzando diverse linee di Glioblastoma Stem like Cells (GSC). Innanzitutto, abbiamo creato un vettore lentivirale codificante per il genome editing di EBF3 basato sulla tecnologia CRISPR/Cas9. Abbiamo quindi selezionato una linea di GSC derivate da GBM-PNC esprimenti costitutivamente alti livelli di EBF3 e creato 4 cloni knockout. Una linea over-esprimente EBF3 è stata poi creata mediante trasduzione di una linea di GSC EBF3-negativa con un vettore lentivirale codificante per il cDNA di ebf3 murino.
I cloni knockout per EBF3 hanno mostrato una minore cinetica di espansione, paragonati ai cloni wildtype, mentre non ci sono differenze tra il clone over-esprimente ed il relativo controllo. La stessa differenza nella capacità di self-renewal è stata osservata nel saggio clonogenico. Abbiamo quindi indagato l’espressione di marcatori di differenziamento nelle GSC trasdotte sia in condizioni di coltura proliferative, che differenziative. La GFAP, un marcatore astrocitico espresso dalla componente gliale dei GBM-PNC, è risultato essere espresso ad alti livelli nei cloni knockout, sia a livello proteico che trascrizionale. Al contrario, le cellule over-esprimenti mostrano livelli più bassi di GFAP, se confrontate con il relativo controllo. La Nestina è un marker riconosciuto di cellule indifferenziate del Sistema Nervoso Centrale ed è più espresso nella componente GBM dei GBM-PNC. In linea con questa osservazione, la Nestina è risultata essere espressa a livelli più elevati nelle linee di GSCs negative per EBF3 ed a livelli più bassi nelle linee esprimenti EBF3 sia in Western blot, sia in RT-qPCR, sia in immunoistochimica su cell blocks.
16
Abbiamo quindi indotto le GSC a differenziare, rimuovendo i mitogeni ed aggiungendo siero fetale bovino al terreno di coltura, al fine di stabilire se EBF3 possa influenzare la capacità di differenziamento delle staminali.
GFAP, la cui espressione raggiunge livelli globalmente più elevati in tutte le linee, se paragonati a TUBB3 (βIII-tubulina). I cloni wildtype, esprimenti costitutivamente EBF3, e le GSC over-esprimenti EBF3 ectopicamente, nostrano un ridotto fold increase sia di GFAP che di TUBB3, in confronto ai relativi controlli. Questa osservazione suggerisce che l’espressione sostenuta di EBF3 possa portare ad un blocco della capacità di differenziamento cellulare.
I dati preliminari dagli xenografts ottenuti dalle GSC derivate da GBM-PNC ed esprimenti EBF3 mostrano un tumore bi-fasico simile morfologicamente ad un GBM-PNC, con aggregati neoplastici rispettivamente positivi o negativi per GFAP ed EBF3. I dati suggeriscono che le GSC da GBM-PNC possano essere dotate di una capacità intrinseca di modulare l’espressione di EBF3. Al contrario, gli xenografts ottenuti dalle rispettive linee knockout mostrano tumori negativi per EBF3, con un prominente aspetto gliale ed una positività per GFAP più diffusa.
17
PART I
GLIOBLASTOMA WITH PRIMITIVE NEURONAL
COMPONENT: IMMUNOPHENOTYPICAL AND
MOLECULAR CHARACTERIZATION
19
INTRODUCTION
Glioblastoma
Glioblastoma (GBM), the most aggressive and common type of brain tumour, is relatively rare, with an incidence of 7.2 adults per 100,000 every year. Prognosis is poor, with a median overall survival (OS) of only 12-15 months (Dolecek, Propp et al. 2012), despite the current combined chemo- and radiotherapy treatment. The GBM histopathological hallmarks are the extreme invasiveness, anaplasia, nuclear pleomorphism, high mitotic activity, florid neoangiogenesis and necrosis (Stiver, Tan et al. 2004). In the recent WHO classification (Louis, Perry et al. 2016) glioblastomas are classified into: (I) IDH-wildtype, usually de-novo tumours in patients over 55 years; (II) IDH-mutant, usually secondary glioblastomas preferentially occurring in younger patients; (III) glioblastoma NOS, when the evaluation of IDH status is not possible (Figure 1). Within the IDH-wildtype glioblastoma group, different histopathological variants have been identified, including the giant cell glioblastoma and gliosarcoma and the newly recognized histotype variant, the epithelioid glioblastoma. In addition to these officially recognized histopathological variants, different GBM patterns have been recognized, as small cell glioblastoma, granular cell glioblastoma and the glioblastoma with primitive neuronal component.
20
The standard therapeutic protocol for GBM is a multimodal approach that combines surgery, radiotherapy, and adjuvant chemotherapy with temozolomide (TMZ), a DNA alkylating agent (Stupp, Hegi et al. 2009). Even though it led to a significant survival improvement, it remains poorly effective. The locally infiltrative nature of the tumour often prevents complete surgical resection, radiations have devastating side-effects on the nervous system restrain, and the blood-brain barrier hampers the delivery of chemotherapeutics (Huse and E.C. 2010, Westphal and Lamszus 2011). Moreover, despite extensive efforts, this tumour is still devoid of targeted therapeutic options. Recent clinical trials with the anti-angiogenic agent bevacizumab (showing possible benefits in preliminary trials), or with inhibitors of tyrosine kinase receptors or signal transducers, failed to significantly prolong patients survival (Quant and Wen 2010, Tanaka, Louis et al. 2013, Thomas, Brennan et al. 2014). In order to develop more effective therapies, in the last decade, a broad investigation of genetic, molecular and cellular features of this tumour has been pursued.
Subclassification of glioblastoma based on genetic alterations and gene expression profiles into subtypes associated with distinct clinical features
As previously described, Glioblastoma comprises a large variety of morphological patterns and histological variants, some of which included in the most recent 2016 WHO classification of tumours of the central nervous system (Louis, Perry et al. 2016). The extensive intertumoural and intratumoural histological heterogeneity reflects an intrinsic genetic instability, to earn the attribute of “multiforme”. The advent of novel and powerful genomic technologies eventually provided the opportunity to recognize glioblastoma heterogeneity at the molecular level and identify subtypes associated with genetic features exploitable for a more accurate diagnosis and prognosis, and for the identification of prospective therapeutic targets (Huse, Phillips et al. 2011, Vitucci, Hayes et al. 2011).
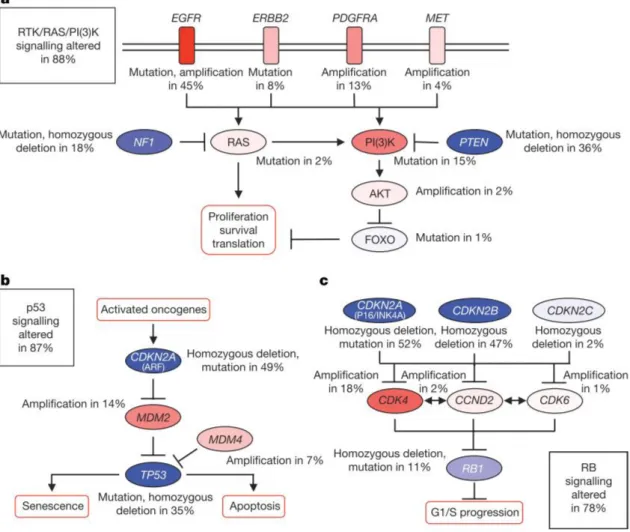
In 2008, the first publication for GBM by The Cancer Genome Atlas Research Network (TCGA) reported the results of genomic and transcriptomic analysis of 206 GBMs, which included mutation sequencing of 600 genes in 91 of the sample (Network 2008). The publication mainly focused on biologically relevant alterations in three core pathways (Figure 2):
I. The Receptor Tyrosine Kinase-Ras-MAP Kinase/AKT pathway, controlling proliferation and survival, including EGF Receptor (EGFR, focally amplified and/or mutated in 57% cases), the Phosphatidylinositol-3 kinase inhibitor PTEN (homozygously inactivated in 41% of cases), and the Ras inhibitor NF1 (homozygously inactivated in 10% of cases);
21
II. the p53 pathway, controlling apoptosis and senescence, with TP53 loss-of-function mutations observed in 28% of cases;
III. the RB pathway, controlling cell cycle progression, including the cell cycle inhibitors CDKN2A (p16/INK4A) and CDKN2B, which are alternatively homozygously deleted in about 60% of cases.
Figure 2 Frequent GBMs genetic alterations in three critical signalling pathways
Primary sequence alterations and significant copy number changes for components of the RTK/RAS/PI(3)K (a), p53 (b) and RB (c) signalling pathways. Red indicates activating genetic alterations, while blue indicates inactivating alterations (Adapted from The Cancer Genome Atlas Research Network 2008).
In 2013, the second publication for GBM by TCGA illustrated the landscape of somatic genomic alterations of more than 500 GBMs, especially emphasizing novel mutation and complex gene rearrangements in EGFR, PDGFRA and other signature receptors (Brennan, Verhaak et al. 2013). It was found that TERT promoter mutations correlated well with the increase of its mRNA expression in GBM. Overall, at least one gene alteration in each of the above three pathways is present in about 75% of patients (Huse and E.C. 2010).
22
It is currently accepted that GBMs can be classified according to their transcriptional profile in three major distinct molecular subgroups (Proneural, PN; Classical, CL; Mesenchymal, MES) associated with specific gene signatures and different prognostic and therapeutic implications (Phillips, Kharbanda et al. 2006, Verhaak, Hoadley et al. 2010, Wang, Hu et al. 2018). Expression of genes related to neural (e.g. ASCL1, OLIG2) and glioma-CpG island methylator phenotype (Noushmehr, Weisenberger et al. 2010) defines the PN subtype, frequently associated to TP53 mutation. Interestingly, PN subgroup comprises IDH1/2 mutated GBMs, associated with significantly better prognosis and younger age (Yan, Parsons et al. 2009). In contrast, CL and MES gene signatures are both associated with poor outcome and older age. CL subtype is characterized by high frequency of EGFR gene alterations (typically amplification and/or EGFRvIII mutation). EGFR amplification/overexpression is correlated with poor outcome (Verhaak, Hoadley et al. 2010) but this patients might strongly benefit from metronomic TMZ administration, with additional advantage if carrying PTEN loss (Cominelli, Grisanti et al. 2015). Homozygous deletion of 9p21.3 (CDKN2A locus), lack of TP53 mutations and RB pathways alteration are also frequent (Verhaak, Hoadley et al. 2010). MES subtype is characterized by high expression of YKL40, MET and CD44, frequent deletion at 17q11.2 (containing NF1 gene), chromosomal aberrations in CDK6, CDKN2A and RB1 and activation of the NF-kB pathway (Wang, Hu et al. 2018). Interestingly, recurrences are frequently associated with a phenotypic shift into MES subtype, suggesting that glioma progression may proceed from PN or CL into MES phenotype(Wood, Reis et al. 2016).
Recently, our group proposed an integrated molecular and immunohistochemical approach aimed at identifying GBM subtypes in routine paraffin-embedded material (Orzan, Pagani et al. 2020). The scoring system has been incorporated within the transcriptional status prediction algorithm (available at http://fisher.med.unibs.it:3838/GBMscore/) to make it easier to be applied in daily pathology practice (Figure 3). Nevertheless, the attempt to attribute a subgroup to every tumour highlighted the huge heterogeneous phenotype of some GBMs, particularly within the PN phenotype, that may not be assigned to a unique profile. This could be an impairment for an accurate diagnosis which is crucial for optimal management of patients. Researchers tried to overcome this limitation by using a different approach based on DNA methylation, whose profile has been shown to be highly robust and reproducible, even for poor quality samples (Hovestadt, Remke et al. 2013).
23
Figure 3. Transcriptional status prediction based on immunohistochemical profile
Dendrogram from cluster analysis based on combination of biomarkers expression shows distribution of GBMs in three major branches and their relative expression profiles within single group (plots). The lower string shows transcriptional subtypes assigned by the algorithm (available at http://fisher.med.unibs.it:3838/GBMscore/) based on combination of IHC and transcriptional data (Orzan, Pagani et al. 2020).
DNA methylation is one of the most studied epigenetic mechanisms (Kulis and Esteller 2010). It is a heritable, enzyme-induced modification to DNA structure without alteration of the specific sequence of the genome and, together with histone modifications, it can regulate the functioning of the genome by changing chromatin architecture. The molecular mechanism involves the covalent addition of a methyl group in cytosine within large clusters of CpG dinucleotides along the genome called CpG islands. Even though DNA methylation plays an essential role in normal biologic processes, aberrant patterns of methylation are observed in different types of tumours.
Methylation of the promoter regions of several genes, including tumour suppressor genes, results in their inactivation as well as hypomethylation can induce genomic instability and contribute to cell transformation. Hypermethylated promoters may serve as biomarkers and, since DNA methylation is reversible, it is extremely interesting for therapy approaches. As a matter of fact, in glioblastomas,
24
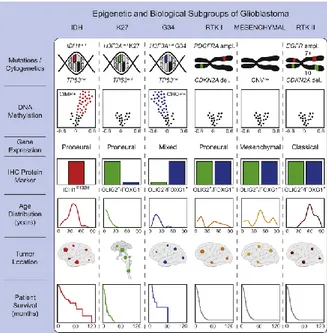
the epigenetic silencing of the MGMT (O6-methylguanine-DNA methyltransferase) DNA-repair gene by promoter methylation compromises DNA repair and has been associated with longer survival in patients with glioblastoma who receive the alkylating agent temozolomide (Hegi, Diserens et al. 2005). In 2012 Sturm and colleagues used an integrative analysis of the methylation profile and gene expression data and demonstrated that it was possible to subclassifiy GBMs into 6 groups, mostly indistinguishable by their histological appearance, but correlating with molecular-genetic alterations as well as key clinical variables such as patient age and tumour location (Sturm, Witt et al. 2012). As schematised in Figure 4, the methylation class "IDH glioma, subclass high grade astrocytoma" is mainly comprised of IDH mutant glioblastoma and anaplastic astrocytoma. This class universally harbours mutations of either IDH1 or IDH2 and the associated glioma CpG island methylator (CIMP) phenotype. The methylation class "glioblastoma, IDH wildtype, H3.3 K27 mutant" comprises IDH wildtype juvenile tumours that harbour mutations of codon 27 of the H3.3 gene (H3F3A). The methylation class "glioblastoma, IDH wildtype, H3.3 G34 mutant" comprises IDH wildtype juvenile tumours that harbour mutations of codon 34 of the H3.3 gene (H3F3A). The methylation class "glioblastoma, IDH wildtype, subclass RTK I" is composed of IDH wildtype GBMs whose expression profiles often resemble the TCGA Proneural subgroup. Recurrent chromosomal alterations are gain of chromosome 7 with or without EGFR amplification (>80%), loss of 9p21 (CDKN2A/B; >50%) and chromosome 10 loss (>70%). The methylation class "glioblastoma, IDH wildtype, subclass RTK II" comprised the IDH wildtype GBMs that correspond to the Classical subgroup.
Figure 4. Summary of key molecular features of GBM subgroups and biological correlations
Simplified schematic representation of key genetic and epigenetic findings in six GBM subgroups as identified by methylation profiling and correlations with clinical patient data (Sturm, Witt et al. 2012).
25
As for RTK I, recurrent chromosomal alterations are gain of chromosome 7 with or without EGFR amplification (>90%), loss of 9p21 (CDKN2A/B; >70%) and chromosome 10 loss (>90%). The methylation class "glioblastoma, IDH wildtype, subclass mesenchymal" is comprised of GBMs that resembles the Mesenchymal TCGA subtype. Recurrent chromosomal alterations are gain of chromosome 7 with or without EGFR amplification (>80%), loss of 9p21 (CDKN2A/B; >60%) and chromosome 10 loss (>90%), as well as alterations of NF1.Ceccarelli et al. made a deeper analysis and correlated DNA methylation clusters with telomere length and maintenance, as well as with other biomarkers and clinical features, in order to elucidate the mechanism of progression from low grade gliomas to glioblastoma (Ceccarelli, Barthel et al. 2016). Furthermore, this approach was applied to other malignant brain tumours, the primitive neuroectodermal tumours of the central nervous system (CNS-PNETs), that often show a difficult diagnosis, and allowed to classify most of them into well-defined CNS tumours entity (Sturm, Orr et al. 2016). Data collected from this extensive studies led to a comprehensive approach aimed to classify all CNS tumours on the basis of the DNA-methylation profile (Capper, Jones et al. 2018). A collaboration between Heidelberg University and Hospital, the German Cancer Research Center (DKFZ) consortium and the German Consortium for Translational Cancer Research allowed to develop a platform, available on line, where users can upload their data and obtain the classification of their samples (https://www.molecularneuropathology.org/mnp).
Figure 5. Identification of New CNS Tumour Entities across Histologies
DNA methylation patterns of CNS-PNET and CNS tumours of varying histology. Molecular subgroup assignment by DNA methylation (inner circle) or gene expression patterns (middle circle) correspond to subgroup labels. Original tumour histology (outer circle) is depicted for tumours from new molecular CNS tumour entities by colored bars as indicated (Sturm, Orr et al. 2016).
26
Hypermutation in human cancer
Mutations in cancer genes can be inherited, spontaneous, or be acquired over time during tumour evolution or by therapeutic effect, but the degree to which mutation rates influence cancer initiation and development and/or enable therapeutic resistance is still under debate. There are emerging evidence that, for many cancer types, outliers with a much higher mutation burden (hypermutation) do exist (Campbell, Light et al. 2017).
Systematic retrospective studies, such as those by The Cancer Genome Atlas (TCGA) and International Cancer Genome Consortium (ICGC), have revealed that mutation loads can differ by several orders of magnitude, with a wide variety of tumour types, such as melanoma, lung, stomach, colorectal, endometrial, and cervical cancers, displaying high mutation loads consistent with hypermutation, which may generate drivers of malignancy, even though it is not clear and most are typically classified as “variants of unknown significance”.
Statistical approaches for extracting information from cancer genomes mutation datasets have provided the ability to assess sources and consequences of mutations during cancer development by analysing mutational patterns. Apparent irregularities in the distribution of mutation types and position are compared to the null hypothesis of random mutation spectrum. These informations are matched against mechanistic knowledge about the chemistry of a mutagenic factor and genetic systems expected to repair the resulting DNA lesions, allowing statistical analysis of cancer mutation spectra (Roberts and Gordenin 2014).
Specific genomic features susceptible of a high rate of mutations have been identified, such as rearrangement breakpoints, replication timing, transcription levels, and chromatin organization, that can in some cases be grouped in mutation clusters.
Moreover, some specific mutation signature have been paired with their source, both extrinsic, as UV light (Pfeifer, You et al. 2005) or tobacco carcinogens (Pleasance, Stephens et al. 2010), and intrinsic, as the dysregulation of apolipoprotein B mRNA editing enzyme, catalytic polypeptide-like (APOBEC) family members (Roberts, Lawrence et al. 2013).
The integrity of the genome is guaranteed by the DNA damage repair machinery. Defects in these machinery by mutations that compromise proofreading, performed by the major replicative enzymes Polε and Polδ1, or DNA mismatch repair, are associated with hypermutation in colorectal, endometrial, and other cancers (Muzny and Network 2012, Network 2012, Kandoth, Schultz et al. 2013). DNA replication repair mutations are also found in cancer predisposition syndromes, such as Lynch syndrome. In particular, dysfunction of the DNA mismatch repair (MMR), the mechanisms
27
that corrects improper nucleotide pairings that arise from replication errors, is associated with a hypermutator phenotype and Microsatellite instability (MSI) (Baretti and Le 2018).
MLH1, MutS protein homologue 2 (MSH2), MutS homologue 6 (MSH6) and PMS1 homologue 2 (PMS2) are the main proteins involved in this MMR system, and they interact as heterodimers; the complexes are ultimately responsible for the recognition of mismatches and insertion–deletion loops (Genschel, Littman et al. , Genschel, Littman et al. 1998) and subsequent recruitment of the MLH1/PMS2 complex will degrade the mutated stretch and initiates resynthesis.
In glioblastomas, the use of temozolomide has been associated with improved overall survival of the patients, specifically those with transcriptional silencing of the MGMT gene. However, the are several studies showing that a fraction of TMZ-treated patients acquired a hypermutator phenotype (Johnson, Mazor et al. 2014, Wang, Cazzato et al. 2016) as direct result of TMZ-induced mutagenesis due to inactivation of the DNA mismatch repair pathway (MSH6, MSH2, MHS4, MSH5, PMS1, PMS2, MLH1, and MLH2). The vast majority of the new mutations were G:C>A:T transitions, the signature of TMZ-induced mutagenesis. This mechanism is important both in the evolution of the tumour and for the development of therapy-resistance in the recurrences. Interestingly, Sa and colleagues identified a rare subset of pre-treatment adult glioma patients with a de novo hypermutator phenotype. TMZ-naïve hypermutated tumours lacked somatic mutation of IDH1 and MGMT promoter methylation, and harboured both germline and somatic dysregulation of MMR encoding genes. Patients with TMZ-naïve hypermutagenesis demonstrated high incidence of cancer-development history in their immediate family memberssuggesting that germline dysfunction of the MMR pathway could potentially pose hereditary risk to genetic predisposition of carcinogenesis in gliomas (Sa, Choi et al. 2019).
Tumour heterogeneity reflects distinct genetic alterations and gene expression profiles within the same tumour bulk
Molecular and morphological classification suffers from the limitation caused by the attempt to categorize samples that are composed by different populations of cells with heterogeneous genetic lesions and different phenotypes. However, the extent of intra-tumour heterogeneity is still poorly understood.
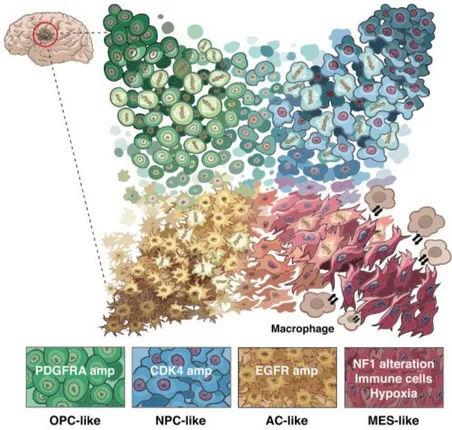
A recent paper from Neftel and colleagues demonstrates, using an integrative approach, that heterogeneity in GBM is driven by four cellular states present at the same moment in the tumour, influenced by both genetics and microenvironment factors. In vivo single-cell tracing supports plasticity between these four states and the relative frequency of each state varies between GBM
28
samples, influencing the global aspect of the bulk tumour profile and its categorization (Neftel, Laffy et al. 2019).
Figure 6. Model for the cellular states of glioblastoma and their genetic and micro-environmental determinants
Malignant cells in glioblastoma exist in four main cellular states that recapitulate distinct neural cell types; they are influenced by the tumour microenvironment, and exhibit plasticity. Each state is characterized by copy number amplifications of the CDK4, EGFR and PDGFRA loci and by mutations in the NF1 locus (Neftel, Laffy et al. 2019).
The root of glioblastoma heterogeneity lies in the fact that these tumours contain a subpopulation of hierarchical organized cancer cell population led by cancer stem-like cells.
Brain tissue was historically considered a quiescent tissue, which does not undergo cell turnover, implying the absence of stem cells. This concept was overwhelmed after the discovery that neurogenesis persists in the adult age in various organisms, including humans (Lie, Song et al. 2004). The main neurogenetic region in the adult mammalian brain was then identified in the subventricular zone (Doetsch, Caillé et al. 1999).Consequently, the concept of stem cells has been extended to brain tumours and the subventricular zone is likely the major source of glioma cells (Sanai, Alvarez-Buylla et al. 2005), along with other minor neurogenic regions within the brain. The first evidence of the existence of cells with stem-like properties in human brain tumours was reported in the paper of Ignatova and colleagues (Ignatova, Kukekov et al. 2002). By applying the same protocol used for neural stem cells, Galli and colleagues isolated clonogenic,
neurosphere-29
forming progenitors from adult human GBM. These cells were endowed with self-renewal ability and long-term propagation, are responsible for tumour-initiating activity and the generation of a heterogeneous cell population including non-stem cells that lack tumourigenic potential (Galli, Binda et al. 2004). These evidence support the fact that these cells likely represent brain tumour stem cells and are commonly, even though improperly, mentioned as Glioblastoma Stem Cells (GSCs). Since then, a bulk of paper was published, but the characterization of GSCs is still challenging and the identification of the brain tumours “cell of origin” remains controversial. Indeed, there is no surface marker that can unequivocally identify GSCs. Dirks and colleagues identified CD133+ cells as the tumour initiating subset in vivo and sorting for this antigen could enrich for neurosphere forming cells (Singh, Hawkins et al. 2004). Unfortunately this marker, as well as others (CD44, CD15), is not completely sensitive or specific for Glioblastoma stem cells (Beier, Hau et al. 2007, Gimple, Bhargava et al. 2019).
Despite their elusive nature, the in vitro model represented by neurospheres enriched of stem-like cells made possible the study of some features related to different GBM subtypes. For instance, tumour-initiating cells expressing EGFR, a marker associated with GBM Classical subtype that plays a fundamental role in gliomagenesis, displayed the most malignant functional and molecular phenotype among multiple GBM cell populations (Mazzoleni, Politi et al. 2010). In neurospheres, EGFR amplification and expression is mutually exclusive with the oncogene MET, a marker associated with mesenchymal and proneural subtype (De Bacco, Casanova et al. 2012). MET identifies a subpopulation of GSCs with high clonogenic potential and long-term self-renewal ability in vitro and enhanced growth kinetics in vivo, and promotes radioresistance (De Bacco, D'Ambrosio et al. 2016). ASCL1, a gene classifier for the proneural transcriptional subgroup, promotes the acquisition of a PN phenotype in GSCs by inducing a glial-to-neuronal switch and concomitantly represses mesenchymal features by directly downregulating the expression NDRG1 (Narayanan, Gagliardi et al. 2018).
After remarkable advances in the study of GSC, it is now accepted that GSC population also presents a notable heterogeneity, which is reflected in the GBM tissue heterogeneity (Piccirillo, Combi et al. 2009, Chen, Nishimura et al. 2010). Additional studies have demonstrated that distinct GSC clones, even from the same tumour, could display variability in gene expression profile and functional properties, which could underlie different therapeutic sensitivity (Stieber, Golebiewska et al. 2014). Conventional therapies for GBM can lead to eradication or reduction of the tumour bulk, but almost all GBMs recur, suggesting that a subset of cells, presumably attributable to the stem cell bulk, are
30
responsible for sustaining long-term tumour growth and recurrence (Chen, Li et al. 2012), possibly due to their chemoresistance ability (Liu, Yuan et al. 2006).
A recent paper of Orzan and colleagues on GSCs from primary GBMs and recurrences showed that the complex heterogeneity observed in whole-tissue GBMs are reflected at the stem cell level, since primary and recurrent GSCs likely derive from a putative common ancestor by divergent genetic evolution and are positively selected by chemoradiotherapy (Orzan, De Bacco et al. 2017).
Investigating the genetic features of the cancer stem cell population seems to be the most suitable approach to achieve a deeper understanding of the pathogenesis of this tumour, to explain treatment failure, and to set up new therapeutic strategies.
Glioblastoma with Primitive Neuronal Component
“Glioblastoma with Primitive Neuronal Component” (GBM-PNC) has been now officially recognized as a peculiar histological pattern in the 2016 WHO classification (Louis, Perry et al. 2016). Previously referred in the literature as “Glioblastoma with PNET-like component”, is a rare variant, representing approximately 0.5% of all GBMs. It is described as a tumour that “usually comprised of a diffuse astrocytoma of any grade (or oligodendroglioma in rare cases) that has well-demarcated nodules containing primitive cells that display neuronal differentiation […] and that sometimes has MYC or MYCN amplification” (Figure 7). The PNC component consists of hypercellular nodules of primitive appearing cells with high nuclear-to-cytoplasmic ratios, markedly hyperchromatic nuclei, and high mitotic rates, with evidence of neuronal differentiation, asgain of Synaptophysin positivity and loss of GFAP expression; they often display Homer Wright rosettes and anaplasia, as also seen in the large cell/anaplastic variant of medulloblastomas (Perry, Miller et al. 2009). In contrast, glioma-associated alterations involve both components, 10q loss (50%) being the most common.
Figure 7. Glioblastoma with Primitive Neuronal Component
On the left, H&E staining showing a sample of GBM-PNC combining an area of high grade GBM (upper left of the yellow line) with a hypercellular nodule with primitive neuronal aspect; central image shows positivity to GFAP IHC of the glial component, while right image shows negativity of the PNC component for GFAP (40X original magnification).
31
These tumours may display OLIG2 expression, a feature that contrasts with primary CNS-PNETs, the main differential diagnostic, and they show higher frequency of IDH1 mutation (Joseph, Phillips et al. 2013). The latter is consistent with the hypothesis of a secondary origin underlying high-grade glioma with secondary development of PNET-like foci and possible explanations are: (I) neuronal/neuroblastic metaplasia; and (II) nodular expansion of the cancer stem cell population (Perry, Miller et al. 2009).
When encountered, they pose a diagnostic challenge and are frequently classified as pure Glioblastomas, since the PNC component may be a minority of the tumour bulk, making it difficult to place them into a single diagnostic category.
Although large clinical studies are lacking, a variety of case reports have been reported (Wharton, Whittle et al. 2001, Ishizawa, Kan-nuki et al. 2002, Dulai, Bosanko et al. 2004, Kaplan and Perry 2007, Yao, Qi et al. 2015).
Recent studies (Perry, Miller et al. 2009, Song, Andrew Allen et al. 2011) revealed a significantly increased propensity for cerebrospinal fluid dissemination, as for CNS-PNETs, as compared to conventional GBMs and a possible benefit from the CNS-PNET platinum-based chemotherapy upfront or after standard failure of the conventional GBM therapy (irradiation and temozolomide). Song et al. evaluated 10 patients with GBM-PNC, with 3 patients who died having a median survival time of 17 months and 2 who were alive on follow-up at 15 and 31 months, suggesting a possible better prognosis compared to conventional GBMs. In a larger multi-institutional series of 53 cases, Perry et al. did not report any significant differences in survival for GBM-PNC compared with conventional GBM. No cases of solid organ metastasis have been reported, apart from one case of extracranial lung metastases (Tamai, Kinoshita et al. 2019). Given the differences in biology, clinical course, staging and potential implications for treatment, identification of PNET-like foci within GBM may be crucial. For this purpose, imaging could be of some help, since it was reported a substantially reduced apparent diffusion coefficient (ADC) values on Magnetic Resonance Imaging (MRI) (Ali, Joseph et al. 2014).
Since GBM-PNC is a rare tumour, only few data regarding their genetic alterations are available and
very few cases, if any, were included in the TCGA.
In 2018, Xu and Li investigated the difference of mRNA expression profiles between GBM-PNC and conventional GBM using Human Cancer Drug Targets PCR Arrays. The main finding was the high expression of CDK4 and EGFR in the primitive neuronal component and in the glial component of
32
GBM-PNC respectively, suggesting that the combination of CDK4/6 inhibitor and targeted therapy against EGFR might be potential effective therapeutic regimen for GBM-PNC (Xu and Li 2018). A more recent study of the same group reported whole exome sequencing for 11 GBM-PNC cases and analysed common mutations. Nine out of 11 had TP53 mutations, while eight out of 11 cases showed mutations in PTEN–PI3K pathway, with an incidence much higher if compared to TCGA data for GBM (Xu, Zheng et al. 2019).
An additional contribution to the understanding of GBM-PNC biology comes from a recent work of our group about the telomere maintenance mechanism (TMM) in juvenile and adult brain tumours (Idilli, Pagani et al. 2020). The up-regulation of TMM is a common feature of cancer cells and a hallmark of cancer. In adult GBMs mutations within the promoter region of the telomerase catalytic subunit, TERT, leading to its overexpression, occur in 55–83% of the patients (Mangerel, Price et al. 2014, Sturm, Bender et al. 2014). In contrast, the Alternative Telomeres Lengthening mechanism (ALT) is a non-canonical mechanism of telomere maintenance developed by cancer cells with no-functional telomerase based on homologous recombination. It is found mostly in tumours with a mesenchymal origin (sarcomas) and in a subset of malignant pediatric brain tumours (Heaphy, Subhawong et al. 2011), including High Grade Gliomas and Primitive Neuroectodermal Tumours (PNET). In adult brain tumours ALT develops in approximately 15% of cases, and is associated with IDH1 mutations and better prognosis (McDonald, McDonnell et al. 2010). Our group analysed the TMM in a cohort of tumours: as reported, ALT is preferentially activated by CNS-PNETs, while GBMs express high levels of TERT. Surprisingly, the GBM component of the analysed GBM-PNC samples showed activation of both mechanisms assessed by the presence of TERT expression, as well C-Circles and PML bodies as markers of ALT. These markers were mostly confined to the GBM component, whereas the PNC component showed absence of TERT expression and no signs of ALT activation (Idilli, Pagani et al. 2020).
33
MATERIALS AND METHODS
Patient cohort
This study was conducted in compliance with the Declaration of Helsinki and with policies approved by the Ethics Board of Spedali Civili di Brescia, University of Brescia for retrospective and exclusively observational study on archival material obtained for diagnostic purpose and patient consent was not needed (Delibera del Garante n. 52 del 24/7/2008 and DL 193/2003). Sixteen patients with newly diagnosed pathologically confirmed GBM with PNC component were retrieved from the Institutional database of the Department of Pathology (Spedali Civili of Brescia) from 2007 to 2019. The other eight cases were collected from other hospitals: Candiolo Institute, Cremona, Padova, Vicenza and Cosenza. Histological diagnosis was revised according to the recent World Health Organization criteria (Louis, Perry et al. 2016) and formalin-fixed paraffin-embedded representative sections for each lesion were selected based on adequate tissue preservation, as assayed by hematoxylin and eosin (H&E) staining. Information regarding clinical features, treatment and outcome were collected from the medical records.
Immunostaining on paraffin-embedded sections
Briefly, 2-μm-thick paraffin sections were obtained from Formalin-Fixed Paraffin-Embedded samples (FFPE). Sections were de-waxed, re-hydrated and endogenous peroxidase activity blocked with 0.3% H2O2 in methanol for 20 minutes. Antigen retrieval (when necessary) was performed using a microwave or a thermostatic bath in either 1.0 mM EDTA buffer (pH 8.0) or 1 mM Citrate buffer (pH 6.0). Sections were then washed in TBS (pH 7.4) and incubated for one hour or overnight in the specific primary antibody diluted in TBS 1% bovine serum albumin.
The following primary antibodies have been used: rabbit polyclonal anti-GFAP (1:1500, Dako), mouse monoclonal anti-Vimentin (1:100, Biocare Medical), mouse monoclonal anti-EGFR (clone E30, 1:20, Dako), mouse monoclonal anti-YAP1 (clone 63.7, 1:50, Santa Cruz Biotechnology), mouse monoclonal anti-CD44 (clone 156-3C11, 1:200, Thermo Scientific), rabbit polyclonal anti-Olig2 (1:600, Millipore), mouse monoclonal anti-Synaptophysin (clone DAKSYNAP, 1:50, Dako), mouse monoclonal anti-EBF3 (clone 8D6, 1:3000, Abnova), mouse monoclonal anti-NeuN (clone A60, 1:1500, Millipore), rabbit polyclonal anti-SOX1 (1:300, Acris Antibodies), mouse monoclonal SOX2 (clone 245610, 1:100, R&D Systems), rabbit polyclonal anti-βIII-tubulin (1:1000, Biolegend), goat polyclonal anti-DCX (1:200, Santa Cruz Biotechnology), mouse monoclonal anti-Nestin (clone 10C2, 1:2000, Millipore), mouse monoclonal anti-IDH1R132H (clone H09, 1:100, Dianova), rabbit polyclonal anti-ATRX (1:100, Sigma Aldrich), mouse monoclonal anti-P53 (clone DO-7, 1.100, Thermo Scientific), mouse monoclonal anti-TERT (clone 2C4, 1:100, NovusBiologicals), rabbit polyclonal anti-TRF2 (1:200, NovusBiologicals), mouse monoclonal anti-PML bodies (clone PG-M3, 1:100, Santa Cruz Biotechnology), rabbit monoclonal anti-c-Myc (clone Y69, 1:50, Abcam), rabbit polyclonal
anti-n-34
Myc (1:5000, Novus Biological), mouse monoclonal anti-MASH1/ASCL1 (clone 24B72D11.1, 1:50, BD Pharmingen), rabbit polyclonal anti-PDGFRα (1:50, Thermo Scientific), rabbit polyclonal anti-YKL40 (1:50, Quidel Corporation), rabbit polyclonal anti-MET(C12) (1:50, Santa Cruz Biotechnology), rabbit monoclonal anti-phosphoNDRG1 (clone D98G11, 1:100, Cell Signaling).
The reaction was revealed by using Novolink Polymer (Leica Microsystems) or Dako EnVision+Dual Link System Peroxidase (Dako Cytomation) followed by DAB and slides counterstained with Hematoxylin.
For double immunostainings, after completing the first immune reaction, second antibodies was applied; chromogen reaction was developed with Ferangi Blue Chromogen Kits (Biocare Medical) and nuclei were counterstained with Hematoxylin (Leica Microsystems).
Markers expression was semi-quantitatively scored on representative tumour regions based on both percentage [score ranges: 0 (0-5%), 1 (6-29%), 2 (30-69%), 3 (≥70%)] and intensity (score ranges: 0, no expression; 1, weak; 2, moderate; 3, high) of immunoreactive neoplastic cells with a combined cumulative score ranging from 0 to 6. Images were then acquired with Olympus DP70 camera mounted on Olympus Bx60 microscope using AnalySIS imaging software (Soft Imaging System GmbH).
For the classification of GBMs according to their transcriptional profile, the following panel of biomarkers was analysed: p53, EGFR, ASCL1, OLIG2, PDGFRα, pNDRG1, YKL40, MET. The panel was previously published (Orzan, Pagani et al. 2020) and gene classifiers were selected because for being mostly inversely correlated and differentially expressed between different GBMs, allowing for discrimination and clustering of the samples (Figure 8). IHC scores of the separate components were loaded on the algorithm available at
http://fisher.med.unibs.it:3838/GBMscore/ for the transcriptional status prediction.
Figure 8. Selection of biomarkers for transcriptional status prediction based on immunohistochemical profile
Correlation index between the expression gene classifiers. Selected biomarkers were found to be mostly inversely correlated and differentially expressed between different GBMs, allowing for discrimination and clustering.
IDH Pyrosequencing assay
Genomic DNA was isolated from five 5-μm-thick paraffin tissue sections. At least 1 slice was stained with Hematoxylin and Eosin to check for the percentage of tumour cells and adequacy of the sample. DNA extraction was performed by QIAamp DNA FFPE tissue (Qiagen) according to the manufacturer’s protocol. The “IDH1/2 status” kit (Diatech) was used to identify the main variants in codon 132 of IDH1 gene, exon 2
35
(R132H, R132L, R132C, R132G, R132S) and in codon 172 of IDH2 gene, exon 4 (R172K). Pyrosequencing was carried out on a PyroMark system (Qiagen-Diatech) according to the manufacturer’s protocol based on the “sequencing by synthesis” principle. Pyrograms outputs were analysed by the Pyromark Q24 software (Qiagen) using the Allele Quantification software to determine the percentage of mutant versus wildtype alleles according to percentage relative peak height.
Evaluation of MGMT promoter methylation status
Evaluation of O6-methylguanine DNA methyltransferase (MGMT) promoter methylation status was performed by using “MGMT plus” kit (Diatech). DNA was extracted with QIAamp DNA FFPE tissue (Qiagen) and subsequently subjected to polymerase chain reaction (PCR) amplification with a forward primer and a biotinylated reverse primer using the “MGMT PLUS” kit (Diatech Pharmacogenetics), according to manufacturer’s instructions. Pyrosequencing methylation assay was performed in order to evaluate 10 CpG sites in the following regions: chr 10: 131,265,507–131,265,556 using sequencing primer of MGMT Kit (Diatech Pharmacogenetics).
Fluorescence In Situ Hybridization (FISH)
EGFR FISH was performed with the Spectrum Orange locus-specific (excitation 547nm- emission 572nm)
identifier EGFR probe specific for the EGFR locus (7p12) DNA probe “Chromosome Enumeration probe” (CEP)7 specific for centromeric region of human chromosome 7 (7p11.1-q11.1, locusD7z1) labelled with fluorophore spectrum green (excitation 497nm, emission 524nm). For the FISH slides were waxed, de-hydrated in 100% ethanol and dried at 45°C. Sections were then pre-treated by immersion in HCl 0,2N for 20 minutes and incubated in sodium thiocyanate 1M at 80°C for 30 minutes. Slides were then placed in a 0,3% pepsin solution at 37°C for 40 minutes and air dried. Probe (LSI EGFR Spectrum Orange/CEP7 Spectrum Green, Abbott Molecular) was applied to the dried slides that were sealed under a coverslip with tuber cement before incubation at 73°C for 5 minutes to denature the DNA followed by hybridization in a humidified chamber at 37°C overnight. Sections were then incubated in post-hybridization solution (2x55c with 0,3% NP-40) at 72°C for 2 minutes, air dried and counterstained with DAPI/Antifade Solution. Evaluation and scoring were determined according to criteria as previously described (Cominelli, Grisanti et al. 2015). Images have been acquired by Nikon Eclipse 90i microscope using Genikon imaging software v 3.4.8.
DNA methylation-based CNS tumour classification using a comprehensive machine learning
We obtained DNA of the two separated components from 4 samples of our cohort. Using H&E-stained slides as a guide, the GBM or PNC cancer cell-enriched areas in unstained 20 μm tissue sections were scraped from the glass using the sharp edge of a sterilized razor. The tissue slices were collected into 1.5 ml and sent to Diagenode for DNA extraction and quality control. The Illumina Infinium MethylationEPIC array BeadChip (850K) was carried out by the Epigenomic Services from Diagenode (Cat nr. G02090000). Raw .idat files were
36
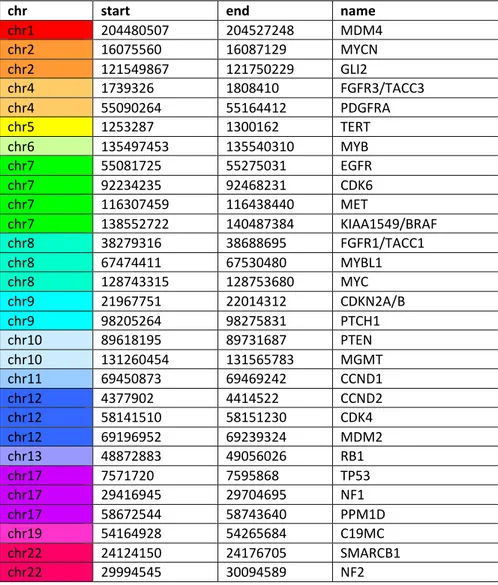
uploaded on the site https://www.molecularneuropathology.org/mnp , where the data were compared to methylation data of a reference cohort comprising over 2800 neuropathological tumours of almost all known entities (currently over 80 tumour classes or subclasses). After the upload, data are automatically normalized, and classified by Random Forest classification. The calibrated score accepted for the attribution of a methylation class is 0.84; however, for diagnostic samples with low cell content, calibrated scores between 0.5 and 0.8 would be accepted. Genome-wide DNA methylation array data can also be used to perform analysis of copy-number variations (CNV). Areas with high copy-number ratios correspond to areas with a gain of chromosomal material (trisomies, larger sub-chromosomal gains), while areas with low copy-number ratios represent lost DNA (deletion). The baseline (value: 0) is the line where the median absolute deviation to all data points is minimal. Thus, the baseline is close to the predominant copy-number state of a sample. Values that deflect from the baseline of a score higher than the log2 value of 0.4 are considered as gain or loss of genetic material. CNV analysis provides a good overview of gross structural alterations in the tumour genome. High-level amplifications (for example EGFR) and homozygous deletions are usually clear when present. In particular, the algorithm examines 29 genes, listed in Table 1, that are known to be altered in CNS tumours.
chr start end name
chr1 204480507 204527248 MDM4 chr2 16075560 16087129 MYCN chr2 121549867 121750229 GLI2 chr4 1739326 1808410 FGFR3/TACC3 chr4 55090264 55164412 PDGFRA chr5 1253287 1300162 TERT chr6 135497453 135540310 MYB chr7 55081725 55275031 EGFR chr7 92234235 92468231 CDK6 chr7 116307459 116438440 MET chr7 138552722 140487384 KIAA1549/BRAF chr8 38279316 38688695 FGFR1/TACC1 chr8 67474411 67530480 MYBL1 chr8 128743315 128753680 MYC chr9 21967751 22014312 CDKN2A/B chr9 98205264 98275831 PTCH1 chr10 89618195 89731687 PTEN chr10 131260454 131565783 MGMT chr11 69450873 69469242 CCND1 chr12 4377902 4414522 CCND2 chr12 58141510 58151230 CDK4 chr12 69196952 69239324 MDM2 chr13 48872883 49056026 RB1 chr17 7571720 7595868 TP53 chr17 29416945 29704695 NF1 chr17 58672544 58743640 PPM1D chr19 54164928 54265684 C19MC chr22 24124150 24176705 SMARCB1 chr22 29994545 30094589 NF2
37
A summary of the CNV plots with an overview of typical chromosomal aberrations found in the main GBMs DNA methylation classes identified by Sturm (Sturm, Witt et al. 2012) are shown in Figure 9 (Capper, Stichel et al. 2018). The DNA methylation-based CNS tumour classifier does not rely on the CNV pattern of a given tumour for classification. However, since losses or gains of chromosomal regions are of high diagnostic impact in some instances, it is highly recommendable an approach that contemplates an integrated diagnosis of morphological and molecular genetic findings. The results from the CNV analysis can be considered as independent from results of the methylation classifier, and both readouts can independently contribute to the final diagnostic interpretation.
Figure 9. Summary CNV plots of GBMs methylation classes
An overview of the typical chromosomal aberrations found in the main DNA methylation classes of GBMs and diffuse midline K27M glioma is shown (Capper, Stichel et al. 2018). The p-arm (left) and the q-arm (right) separated by a dotted line. Gains/amplifications represent positive, losses negative deviations from the baseline.
Next Generation Sequencing
We obtained DNA of the two separated components from 6 samples of our cohort. Using H&E-stained slides as a guide, the GBM or PNC cancer cell-enriched areas in unstained 20 μm tissue sections were scraped from the glass using the sharp edge of a sterilized razor. The tissue slices were collected into 1.5 ml and DNA was extracted using QIAamp DNA FFPE tissue (Qiagen) according to the manufacturer’s protocol. DNA isolated FFPE samples was fragmented using the M220 Focused-ultrasonicator (Covaris®). The preparation of the NGS libraries started with End-Repair and A-Tailing reactions, followed by adapter ligation (NXSEQ Ampfree Low DNA Library kit, Lucigen®; TruSeq™ DNA Single Indexes, Illumina). Then, the target of interest has been