1
CIRTEN
CONSORZIO INTERUNIVERSITARIO PER LA RICERCA TECNOLOGICA NUCLEARE
POLITECNICO’DITORINO
DIPARTIMENTO DI ENERGETICA
SPES-3 Facility Analysis, Reference data for postulated Accident Simulation,
Criteria for general and special instrumentation selection
Cristina Bertani, Mario De Salve, Mario Malandrone, Grazia Monni, Annamria
Mosetto, Bruno Panella
CIRTEN-POLITO RL 1256-2010
Torino, Luglio 2010
Lavoro svolto in esecuzione della linea progettuale LP2– punto C dell’AdP ENEA MSE del 21/06/07, Tema 5.2.5.8 – “Nuovo Nucleare da Fusione”
2
Summary
1. Introduction
2. The SPES-3 Components
3. Containment Piping of SPES-3 IRIS Facility
4. Components and Piping connections of SPES-3 IRIS Facility 5. Break lines of SPES-3 IRIS Facility
6. Instrumentation of the SPES 3 facility
7. Measuring range and criteria for special instruments selection 8. Conclusion
Appendix: DESCRIPTION OF THE THERMOHYDRAULICS OF SOME BASE CASES: UPSTREAM BREAK LINES
List of figures and tables
Fig. 1: IRIS Spherical Steel Containment and Major Components ... 24
Fig. 2: Engineering Safeguard System of IRIS ... 25
Fig. 3: SPES-3-IRIS component location ... 26
Fig. 4: IRIS GENERAL VIEW ... 27
Fig. 5: Top View of SPES-3 Iris Facility ... 27
Fig. 6: SPES3- ADS Trains to Quench tank ... 28
Fig. 7: Quench tank to dry-well connection ... 28
Fig. 8: Dry-Well (D-W)to Reactor Vessel Cavity (RVC) ... 29
Fig. 9: DVI lines ... 29
Fig. 10: EBT DVI upper connections ... 30
Fig. 11: EBTs bottom connection to DVI lines ... 31
Fig. 12: Dry well connection to pressure suppression system ... 32
Fig. 13: LGMS to DVI connections ... 33
Fig. 14: LGMS to PSS connections ... 34
Fig. 15: Connections between PSS and DVI lines ... 34
Fig. 16: Reactor vessel cavity RVC to DVI lines. ... 35
Fig. 17: Steam line connections ... 35
Fig. 18: RWST component (12 m3 volume, 9 m height) ... 36
Fig. 19: EHRS top connections ... 36
Fig. 20: EHRS bottom connections ... 37
Fig. 21: DVI break to reactor vessel cavity (RVC) ... 37
Fig. 22: ADS break lines ... 38
Fig. 23: EBT break to RPV ... 39
Fig. 24: Steam lines break to dry well ... 39
Fig. 25: Steam lines break to dry well (top view) ... 39
Fig. 26: Feed line break to reactor cavity ... 40
Fig. 27: Feed line break to reactor cavity (top view) ... 40
3
Fig. 29: Drywell to RC connections and instrumentation ... 42
Fig. 30: ADS connection to Drywell. ... 42
Tab. 1:. Reference base transient cases ... 6
Tab. 2: SPES 3 Test Matrix main Goals ... 10
Tab. 3: Orifice table ... 10
Tab. 4: Special instrumentations location ... 13
Tab. 5: DVI break line (SPLIT) characteristics ... 14
Tab. 6: DVI break line (DEG) characteristics ... 14
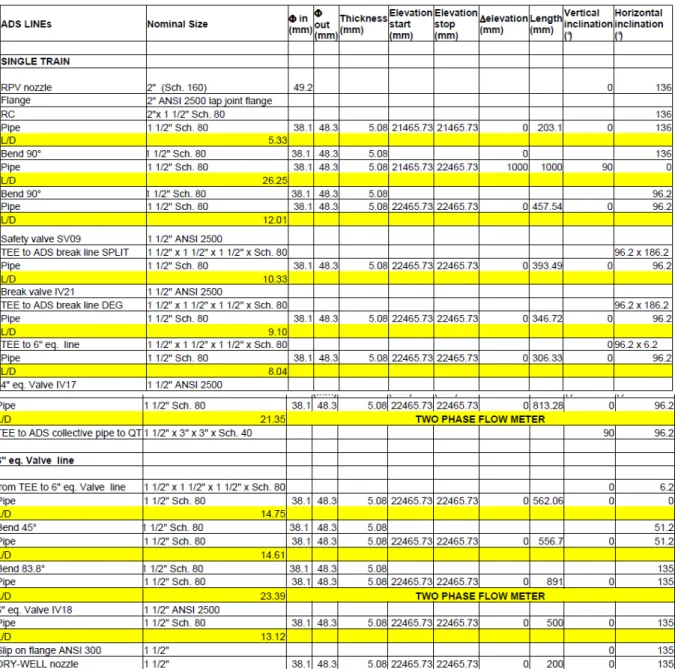
Tab. 7: ADS line single train connection- main characteristics ... 15
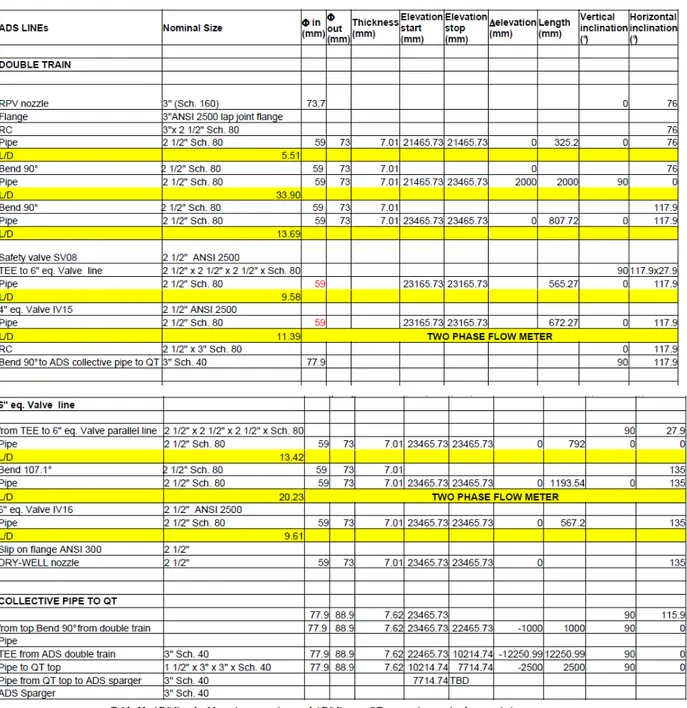
Tab. 8: ADS line double train connection and ADS lines to QT connections - main characteristics .... 16
4
1. Introduction
IRIS (International Reactor Innovative and Secure) reactor is an integral modular, medium size PWR, under development by an international consortium with about 20 partners led by
Westinghouse (1). The licensing process required by the U.S. Regulatory Commission (NRC) foresees an experimental campaign to verify the behaviour of the new plant and its safety system capabilities to cope with postulated accidents.
Fig. 1 shows a typical configuration of major component. The most innovative characteristic or IRIS is the elimination of some possible accidents, like the large LOCA (Loss of Coolant Accident). The integral structure of the reactor eliminates the main connection lines between the Vessel and the Steam Generators (as in the standard PWR design). The Reactor Vessel of IRIS includes the Core and 8 Steam Generators symmetrically arranged around it and directly connected to the outlet of the Core.
The IRIS containment is smaller with respect to the standard containment of a PWR and can effort a bigger internal pressure because of its spherical shape. It is strongly coupled to the Reactor Vessel. In case of a SBLOCA (Small Break LOCA), the pressure inside the containment rapidly rises up to the pressure in the Reactor Vessel and stop the water to flow out of the break. Then the long term cooling ensures a safe removal of the decay heat.
From the preliminary safety assessment (2), the need of the typical safety systems are evaluated and they are shown in Fig. 2.
An experimental facility called SPES3-IRIS ( Simulatore Per Esperienze di Sicurezza ) will built at SIET laboratories (Piacenza, ITALY) (3). It will be scaling 1:100 volume and 1:1 height scale the primary, secondary containment and the safety system of IRIS reactor.
The SPES3-IRIS is an integral test facility of the IRIS reactor with the general design criteria of reference.
5
2. The SPES-3 components
The design of SPES-3-IRIS facility includes the primary system with:
• Reactor Pressure Vessel (RPV) including power channel, circulation pump, pressurizer; • Emergency Boration Tank (EBT);
• Automatic Depressurization System (ADS);
the secondary systems with:
• Main Steam Line Isolation Valve (MSLIV), including three SGs simulating eight, with helical coils (loop A and B simulate two SGs each, loop C simulates four);
the containment system with: • dry well (DW), • quench tank (QT),
• reactor vessel cavity (RVC) , • Pressure Suppression System (PSS),
• Long term Gravity Make-up System (LGMS);
the safety system with:
• Emergency Heat Removal System (EHRS) ; • Refuelling Water Storage Tank ( RWST);
the non safety systems with:
• Start-up Feed Water (FW).
The main parameters preserved by scaling are the fluid thermodynamic conditions (temperature, pressure, enthalpy); vertical elevation; power to volume ratio (not preserved during the steady state and initial part of transients); power to flow ratio; transit time of fluid and the heat flux.
Additional scaling criteria are applied to design selected components in order to better reproduce specific phenomena occurring in the IRIS plant during an accident.
Typical data of components are geometrical information (volume, total height , volume, nozzle of pipe connection: diameter and elevation).
6
Fig. 3 shows the SPES-3 IRIS Facility components. The SPES-3 facility has to prove that the thermodynamical coupling between the Reactor Vessel and the Containment can effectively stop the leak and guarantee a safe course in case of accident.
From the main base transient case are given in reference (6) and are reported in Tab. 1.
transient case name
DVI-B-DEG at 10 MW SPES3-89
EBT-B-DEG at 10 MW SPES3-90
ADS-ST-DEG at 10 MW SPES3-91
FL-B- DEG break at 10 MW SPE3-93
SL-B-DEG break at 10 MW SPES3-92
Tab. 1:. Reference base transient cases
3. Containment Piping of SPES-3 IRIS Facility
The containment piping includes the pipe lines that connect:• the dry-well (DW) to the pressure suppression system PSS (PSS vent lines);
• the pressure suppression system PSS to the Long Term Gravity Make up System LGMS : (PSS-LGMS Pressure Balance Lines);
• the LGMS to Direct Vessel Injection (DVI) lines; • the Direct Vessel Injection DVI lines.
• the Automatic Depressurization System (ADS) lines (two depressurization trains).
Fig. 4 and Fig. 5 and show primary system and containment flow diagram. We can see the main volume components (RPV, DW, LGMS,RWST, QT etc.)
7
4. Components and Piping connections of SPES-3 IRIS Facility
The piping line (diameter, length, lay-out) that connect the SPES-3 components are very important for the theoretical and experimental study of flow rate between the components.
Fig. 6 shows the connection of the reactor pressure vessel RPV ( Pressurizer region of RPV) to the quench tank QT by the Automatic Depressurization System ADS. The 3 ADS trains of IRIS are simulated in SPES3 by 2 ADS trains. In SPES3 single train simulating one IRIS train with a nozzle Φ = 49.2 mm (2 inch); double train simulating two IRIS trains. The nozzle is Φ = 77.3 mm (3 inch). All trains discharge into the Quench Tank through a common vertical collector and a sparger.
Collector to QT is Φ = 3” sch. 80 .
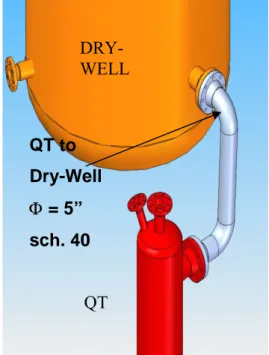
The quench tank QT is connected to the dry-well DW by vertical pipe of 5” sch. 40 diameter (Fig. 7).
Fig. 8shows the connection of Dry-Well to reactor vessel cavity RVC. There are two horizontal pipes: Φ = 2” sch. 40 gas return line and Φ = 4” sch. 40 liquid discharge line.
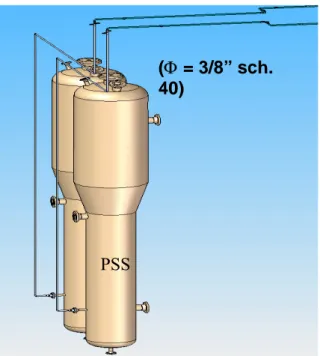
Direct vessel injection (DVI) from the emergency borate tank EBT to the reactor pressure vessel RPV it is possible via the DVI lines (Fig. 9). There are 2 upper connections: main delivery and siphon breaker; 1 lower connection for lower downcomer injection. Blind disks allow to set the required connection. The pipe are ½ “ sch. 80. The EBTs are 2 tanks of 0.178 m3 volume and 5.5 m height. The pipes that connect the EBT tanks to the DVI are 3/8 “ sch. 80. Fig. 10 shows the upper connection while Fig. 11shows the bottom EBT connection.
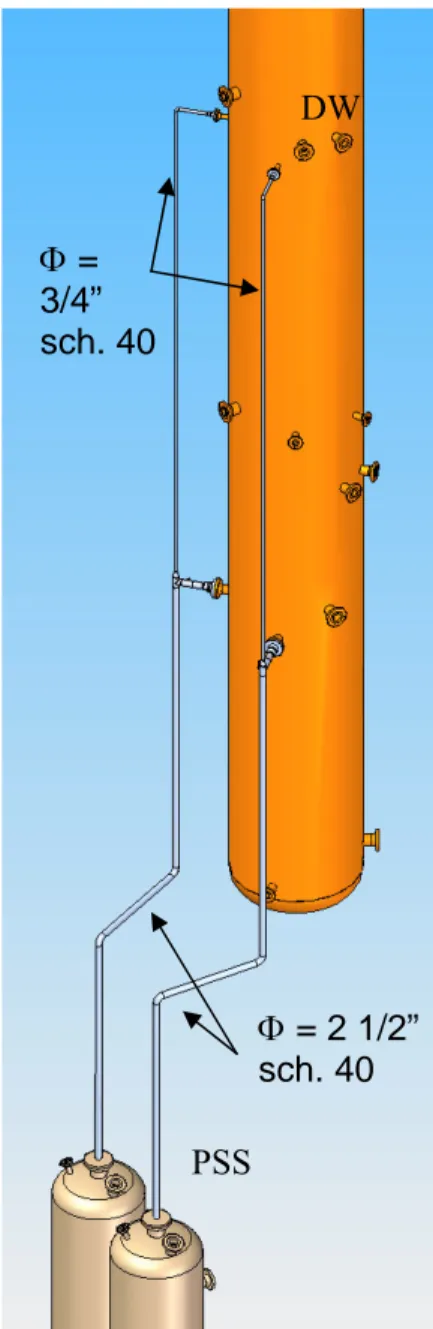
An important connection is the pipe that connect the Dry-Well (D-W) to the pressure suppression system (PSS) (Fig. 12). There are two connections: the upper connection free (Φ = 3/4” sch. 40), the bottom connection with a check valve (Φ = 2 1/2” sch. 40). The discharge into PSS is made through a sparger. The dry-well is a cylindrical tank with 35.36 m3 volume and 15.9 m height.
In the SPES-3 IRIS facility there are some connections between the bottom of the large gravity make-up system (LGMS) with the DVI lines (3/8 “ sch. 40) (fig. 12); there are two connection between the top of LGMS and PSS (fig. 13). Connection between PSS and DVI lines (Φ = 3/8” sch. 40) are shown in Fig. 15. Reactor vessel cavity is connect to the DVI line by pipe lines of Φ = 3/8” sch. 40 as shown in Fig. 16.
8
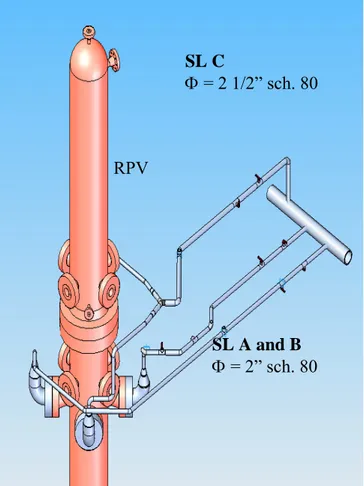
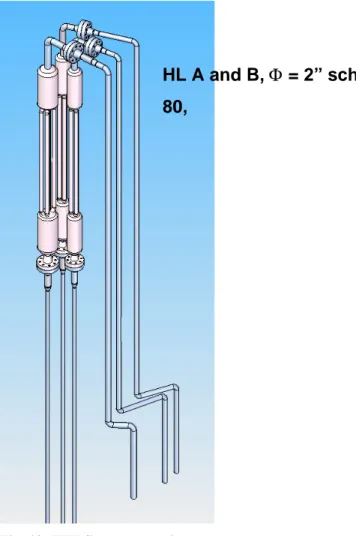
Fig. 17 shows the connection between the reactor pressure vessel to the steam collector by the steam lines . Steam lines A and B enter directly to the RPV (single loop), SL C divides in two branches before it enters to the RPV. The refuelling water storage tank (RWST) it is important as heat sink. Inside there is the Emergeny Heat Removal System (EHRS). Fig. 19 and Fig. 20 show the pipe connections at bottom and top of EHRS.
5. Break lines of SPES-3 IRIS Facility
SPES-3 IRIS include the break lines that are designed to simulated five base transient cases (4) .
According to IRIS Integral system test specification of Westinghouse, base transient case of primary reactor side are DVI break, EBT break, ADS break.
Feed line break (FL break) and Steam line break (SL break) are connected to the secondary side of plant and it are designed to study non LOCA event of IRIS Plant.
The SPES3 break lines do not exist in IRIS but they are needed in the facility to lead the break flow into the containment tanks.
All the break line systems are suitable to simulate both the split and double ended guillotine break.
Reference break types ( equivalent diameter double ended guillotine (DEG)) and line positions are defined in the reference test matrix. Fort each test all the times of events are defined with respect to the break time assumed at t=0 s.
During the run of proposed transient case the fluid flowing from the Reactor Vessel to the Containment and viceversa is mainly a two-phase mixture of steam and liquid. That is why the measurement of the two-phase flow rates in the SPES-3 pipe lines is crucial to assess the effective efficiency of the IRIS integral structure. Very important are the pipe lines that connect the
component of IRIS plant and the main event about the safety components.
To carry out the experimental test matrix are important the break lines. They are very important, from special instrumentation point of view, because flow rate in these lines is two-phase flow.
9
• Low elevation SBLOCA (small break LOCA): this accident is caused by the rupture of a DVI line. Both the double-ended guillotine and the split break tests will be simulated. The SPES3 DVI-B line is equipped with two break lines that separates from the horizontal portion of the DVI-B, and connect the DVI-B line to the Cavity. The demonstration of the efficiency of the long term recirculation is also foreseen as the long term extension of the previous events.
• High elevation SBLOCA (small break LOCA): the high elevation break is located on the EBT connection to the RV. One of the two EBT tank in SPES3 is equipped with two break lines (double-ended guillotine break line and split break line). The double-ended guillotine break will be simulated.
• ADS break: the ADS break is located on one of the two ADS lines in SPES3. This line is equipped with two break lines that connect the ADS to the Drywell. The double-ended guillotine break will be simulated.
• Feedwater line break: one of the three feed line in SPES3 is equipped with two break lines (double-ended guillotine line and split break line)that are connected to the Cavity. The double-ended guillotine break will be simulated.
• Steam line break: one of the three feed line in SPES3 is equipped with two break lines (double-ended guillotine line and split break line) that are connected to the Drywell. The double-ended guillotine break will be simulated.
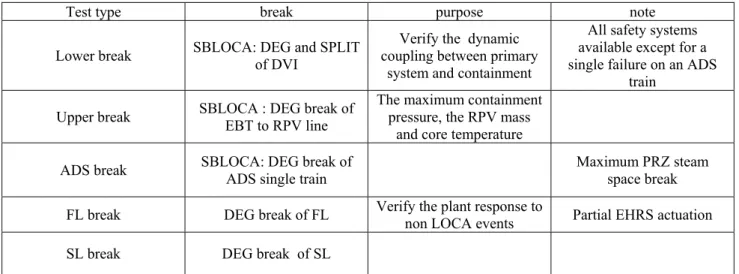
Tab. 2 reports the SPES3 test matrix main goals.
Test type break purpose note
Lower break SBLOCA: DEG and SPLIT of DVI coupling between primary Verify the dynamic system and containment
All safety systems available except for a single failure on an ADS
train Upper break SBLOCA : DEG break of EBT to RPV line The maximum containment pressure, the RPV mass
and core temperature
ADS break SBLOCA: DEG break of ADS single train Maximum PRZ steam space break
FL break DEG break of FL Verify the plant response to non LOCA events Partial EHRS actuation
10
Safe Shutdown Sequence Loss of all power Verify
Tab. 2: SPES 3 Test Matrix main Goals
The SPLIT break lines and the DEG break line are reported in Fig. 21 for the DVI line.
Fig. 23shows the SPLIT and the DEG break line that connect the EBT to the RPV. Fig. 22 shows the connection lines used to simulate the ADS break to dry-well.
Fig. 26and Fig. 27 show the feed line break to reactor vessel cavity RVC for a non LOCA transient. Fig. 24 and Fig. 25 show the steam lines break to dry well for the SPLIT case and for DEG case.
The SPES-3 facility has been designed to study fourteen geometrical configuration set-up by calibrated or break orifices. Tab. 3 gives the type of the transient and the size of orifice.
transient name Size mm SPES-3 Line number
ADS Double Train (4” equivalent line) ADS DT 12.34 GL 131 ADS Double Train (6” equivalent line) ADS DT 18.64 GL 132 ADS Single Train (4“ equivalent line) ADS ST 8.73 GL 134 ADS Single Train (6“ equivalent line) ADS ST 13.18 GL 135
ADS break line SPLIT ADS ST BL 13.18 GL 133
ADS break line DEG ADS ST BL 13.18 GL 133
DVIB break line SPLIT (2” / 1” equivalent break)
DVI—B BL 4.28/2.54 LL 620
DVIB break line DEG (2” equivalent break)
DVI—B BL 4.28 LL 620
EBT-B to RPV balance line break SPLIT (4” equivalent break)
EBT-B to RPV BL 8.73 LL 632
EBT-B to RPV balance line break SPLIT (4” equivalent break)
EBT-B to RPV BL 8.73 LL 632
FL-B BL SPLIT (12 “ equivalent break) FL-B BL 25.72 LL 314 FL-B BL DEG (12 “ equivalent break) FL-B BL 25.72 LL 314 SL-B break SPLIT (16 “ equivalent break) SL-B BL 32.54 GL 360 SL-B break DEG (16 “ equivalent break) SL-B BL 32.54 GL 360
11
6. Instrumentation of the SPES3 facility
A large set of instruments (about 600) must be installed on SPES3 to provide data both for the test run and analysis.
It consists of conventional instrumentation (relative and absolute pressure transmitters, temperature sensors) and special instrumentation for two-phase flow measurement.
The quantities directly measured by conventional instrumentation in the lines are: • fluid and wall temperatures
• absolute and differential pressures • velocity
• volumetric flow
While special instrumentation is used for void fraction and volumetric flow in break lines. Derived quantities are:
• level by differential pressure and density, • mass flow by differential pressure and density, • mass flow by volumetric flow and density, • mass flow by volumetric flow and void fraction, • mass by level and density,
• mass flow by heat transfer (heated thermocouples), • heat losses by wall thermocouples,
When SPES-3 work at normal steady state single phase flow must be measured (liquid lines (LL) , gas lines (LG)). Traditional instrumentations are fluid and wall temperature measurements, absolute pressure measurement in the volume component, differential pressure measurements for pressure drop, liquid level, or for single phase flow rate.
These measurements are very important for facility controls, flow regulations, safety, technical and scientific reasons.
12
During the transients of postulated accidents, two-phase flow is presents in all the break lines. Suitable instrumentations downstream and upstream of orifices, to estimate liquid and vapour flow rates, void fractions, pressures and temperatures are necessary.
The pipe lines that need to be monitoring from two phase flow point of view are all the DVI break lines, ADS break lines, EBT break line, FL break line and SL break line.
The locations where special instrumentation is needed are presented in Tab. 4.
SPES3-IRIS facility instrumentation
Location Instrument Plant M. U. Notes
type code
PRIMARY SIDE AND CONTAINMENT
ADS break line (DEG) flowrate Special I F133-004 Special instrument for Two-phase measure. TBD ADS break line (DEG) flowrate Special I F133-005 m3/s Special instrument for Two-phase measure. TBD
ADS break line (split) flowrate Special I F133-002 Special instrument for Two-phase measure. TBD ADS break line (split) flowrate Special I F133-006 m3/s Special instrument for Two-phase measure. TBD
ADS line DT (Stage-I) flowrate Special I F131-002 Special instrument for Two-phase measure. TBD ADS line DT (Stage-I) flowrate Special I F131-003 m3/s Special instrument for Two-phase measure. TBD
ADS line DT (Stage-II) flowrate Special I F132-002 Special instrument for Two-phase measure. TBD ADS line DT (Stage-II) flowrate Special I F132-003 m3/s Special instrument for Two-phase measure. TBD
ADS line ST (Stage-I) flowrate Special I F134-002 Special instrument for Two-phase measure. TBD ADS line ST (Stage-I) flowrate Special I F134-003 m3/s Special instrument for Two-phase measure. TBD
ADS line ST (Stage-II) flowrate Special I F135-002 Special instrument for Two-phase measure. TBD ADS line ST (Stage-II) flowrate Special I F135-003 m3/s Special instrument for Two-phase measure. TBD
DVI-B break line (DEG) flowrate Special I F620-005 Special instrument for two-phase measure. TBD DVI-B break line (DEG) flowrate Special I F620-006 m3/s Special instrument for two-phase measure. TBD
DVI-B break line (split) flowrate Special I F620-003 Special instrument for two-phase measure. TBD DVI-B break line (split) flowrate Special I F620-007 m3/s Special instrument for two-phase measure. TBD
EBT-B break line (DEG) flowrate Special I F632-004 Special instrument for two-phase measure. TBD EBT-B break line (DEG) flowrate Special I F632-005 m3/s Special instrument for two-phase measure. TBD
EBT-B break line (split) flowrate Special I F632-002 Special instrument for two-phase measure. TBD EBT-B break line (split) flowrate Special I F632-006 Special instrument for two-phase measure. TBD
13
SG-A inlet flowrate (pump delivery line) Special I F201-002 m3/s Turbine flowmeter has larger rangeability than
nozzles or diaphragm
SG-B inlet flowrate (pump delivery line) Special I F201-003 m3/s Turbine flowmeter has larger rangeability than
nozzles or diaphragm
SG-C inlet flowrate (pump delivery line) first inject. point Special I F201-004 m3/s Turbine flowmeter has larger rangeability than
nozzles or diaphragm
SG-C inlet flowrate (pump delivery line) second inject. point Special I F201-005 m3/s Turbine flowmeter has larger rangeability than
nozzles or diaphragm
SECONDARY LOOP A and RWST
SECONDARY LOOP B
FL-B break line (deg) flowrate Special I F317-002 Special instrument for Two-phase measure. TBD FL-B break line (deg) flowrate Special I F317-005 m3/s Special instrument for Two-phase measure. TBD
FL-B break line (split) flowrate Special I F317-004 Special instrument for Two-phase measure. TBD FL-B break line (split) flowrate Special I F317-006 m3/s Special instrument for Two-phase measure. TBD
SL-B break line (split) flowrate Special I F360-003 Special instrument for Two-phase measure. TBD SL-B break line (split) flowrate Special I F360-006 m3/s Special instrument for Two-phase measure. TBD
SL-B break line (DEG) flowrate Special I F360-004 Special instrument for Two-phase measure. TBD SL-B break line (DEG) flowrate Special I F360-007 m3/s Special instrument for Two-phase measure. TBD
SECONDARY LOOP C
Tab. 4: Special instrumentation location
The diameters, lengths and orientations of pipes are very important in the selection of
instrumentation. From Fig. 21 to Fig. 27 is show that the break lines proposed are all horizontal pipes. In Tab. 5, Tab. 6, Tab. 7 and Tab. 8 the most important geometrical characteristics for the DVI break lines and for ADS lines are resumed.
14
Tab. 5: DVI break line (SPLIT) characteristics
15
16
Tab. 8: ADS line double train connection and ADS lines to QT connections - main characteristics
Typical break line have a break orifice or a calibrated orifice that define the upstream and the downstream of discharge line. L/d ratio are chosen according to the measuring standard rules as EN ISO 5167-1-2-3-4 standard for orifice and nozzle (5) for the conventional single flow
instrumentation. Turbine meters , drag disk meters , vortex meters have to be installed according to single flow measuring rules of manufacturer.
17
Line
Number Name Orifice Type Size (mm)
Notes
GL 131 ADS DT ADS Double Train (4" eq. Line) CO 05 Calibrated orifice 9.927 4" eq. Double line GL 132 ADS DT ADS Double Train (6" eq. Line) CO 06 Calibrated orifice 18.64 6" eq. Double line GL 134 ADS ST ADS Single Train (4" eq. Line) CO 07 Calibrated orifice 7.019 4" eq. Line GL 135 ADS ST ADS Single Train (6" eq. Line) CO 08 Calibrated orifice 13.18 6" eq. Line GL 133 ADS ST BL ADS break line SPLIT CO 09 Break orifice 13.18 6" eq. Break GL 133 ADS ST BL ADS break line DEG CO 10 Break orifice 13.18 6" eq. Break LL 620 DVI-B BL DVIB Break line SPLIT CO 01 Break orifice 4.28 / 2.54 2" / 1" eq. Break LL 620 DVI-B BL DVIB Break line DEG CO 02 Break orifice 4.28 2" eq. Break LL 632 EBT-B to RPV BL EBT-B to RPV bal. Line Break SPLIT CO 03 Break orifice 8.73 4" eq. Break LL 632 EBT-B to RPV BL EBT-B to RPV bal. Line Break SPLIT CO 04 Break orifice 8.73 4" eq. Break LL 314 FL-B BL FL-B break SPLIT CO 11 Break orifice 25.72 12" eq. Break LL 314 FL-B BL FL-B break DEG CO 12 Break orifice 25.72 12" eq. Break GL 360 SL-B BL SL-B break SPLIT CO 13 Break orifice 32.54 16" eq. Break GL 360 SL-B BL SL-B break DEG CO 14 Break orifice 32.54 16" eq. Break
LL606 EBT-A to DVI-A EBT-A to DVI-A line CO 15 Calibrated orifice 3.4
orifice to match pressure drops LL636 EBT-B to DVI-B EBT-B to DVI-B line CO 16 Calibrated orifice 3.4
orifice to match pressure drops LL507 EHRS-A CL EHRS-A Cold Leg CO 17 Calibrated orifice 6
orifice to match pressure drops LL527 EHRS-B CL EHRS-B Cold Leg CO 18 Calibrated orifice 6
orifice to match pressure drops LL547 EHRS-C CL EHRS-C Cold Leg CO 19 Calibrated orifice 12 orifice to match pressure drops
LL430 LGMS-A to DVI-A LGMS-A to DVI-A line CO 20 Calibrated orifice 4
orifice to match pressure drops Measure 1/10 of tube
area for lack of IRIS data. LL432 LGMS-B to DVI-B LGMS-B to DVI-B line CO 21 Calibrated orifice 4
orifice to match pressure drops. Measure 1/10 of tube
area for lack of IRIS data. Tab. 9: Simulated break line ,according to SPES3-IRIS facility nodalization for RELAP5
18
7. Measuring Range and criteria for instruments selection
Starting from the analysis of the RELAP 5 simulation results, the variations of the most important two phase flow parameters has been estimates.
The measurement range is the fundamental point for select the possible instruments, because each type of meter is characterised by advantages and drawbacks that are less or more important in different flow conditions.
With the RELAP code is possibility to analyse the thermohydraulic downstream and upstream the break orifices. Because the different conditions in the different locations, the two options must be studied to select where the special instrumentations could “work” better and where it can be installed in order to minimise the flow perturbations.
Appendix gives the ranges in the upstream locations; while downstream analysis is reported in the report: “Investigation of the two-phase flow instrumentation necessary for the SPES3 facility”.
The results analysis concerned different points.
The first point concerns the analysis of the time intervals relatives at each simulations: During each time intervals the main important parameters to know are:
- mass flow rate of each phase - velocity of each phase - pressure
- temperature
- their time variation.
Because the large variations of the parameters during the transients the time intervals are very important, their knowledge permit to decide which type of instruments can measure at each instants and then how many instruments are needed for each line.
In any case the reference spool piece is the series “turbine meter”, “drag meter or venturi meter” and void fraction meter (impedance meter).
The second point is the analysis of the void fraction at each interval and the flow pattern, because the influence of the velocity profile and of the void fraction in the two phase flow response is very high.
19
The analysis showed that the most important characteristics for the two phase instrumentations are:
Two-Phase Flow Handling Capability and Easy Modeling: the instrument selected must work
well in two phase flow, then a number of studies for different instruments has been computed and a large amount of literature has been analysed, in order to select the instruments able to work in two phase flow but also able to measure at high pressures and high temperatures
Transient Operation Capability: since the break discharged flow is not steady state, a good
transient capability is a required prerequisite. The capability to follow fast transient is required, or at least the capability to mathematically model the dynamic response of the meter so as to correct the signal for dynamic effects.
Minimal Disturbance to the Flow: in order to avoid any significant alteration of the
thermal-hydraulic coupling between the Reactor Pressure Vessel and the Containment that could drive somewhat the testing and that the testing is intended to explore, the disturbance to the discharged flow caused by the meter should be as low as possible.
High Span: all the analysed breaks are characterised by a wide variations range for all the
parameters, so that the capability of the meter to cover a huge span is a good prerequisite.
Bi-directional Operation Capability: the graph of mass flow rate showed that in certain instants
reverse flow conditions are possible; then the selected instruments must be able to not failure in this context. Both Reactor Pressure Vessel discharge into the Containment and a possible reverse flow from the Containment into the Reactor Pressure Vessel have to be measured.
It’s important to highlight that because the important variations of all the parameters it is very difficult to find an instruments, or better a series of instruments (Spool Piece - SP) able to measure during all the time.
The main parameter that needs to be monitored during the simulation of the transient is the mass flow rate coming out of the Reactor Vessel into the containment. Since the density of each phase is not known, it is necessary to measure both the velocity of the two-phase flow (with a flow-meter) and the density of each phase (with a densitometer).
The SP have to couple two, or three instruments, able to measure in the same range and able to avoid failure ( instrument break) also if the conditions are out of the measurable range.
20
The choice of the instruments, has been based on the geometry of the lines and on the mass flow rates and void fractions expected in those lines, too.
Influence of the T junctions, the Y junctions and the elbows on the distribution of the flow inside the pipe is important because some instruments need a minimum value of L/D upstream and downstream of straight uninterrupted flow line, in order to measure properly. Then it must take in account that, if an instrument as turbine, venturi or drag disk will be selected the length of the line must be adapted.
Typical spans for commercial meters are not able to measure in all the range, so that an array of differential meters is required to fully cover SPES3 needs, driven by an active control system to place in line the proper meter during the test and valve off all the others.
As it can be deduced from the previous analysis (6), (7), (8) and Appendix, the meters that have an acceptable performance, are the Turbine flow-meter, Drag Disk, Venturi tube and Impedance Probes.
Also considering limits and drawback of these instruments, these are the only devices analysed that could operate in the whole range of void fractions (from 0 to 1), pressure, temperature (span: 200°C and in some lines 400°C) and velocity (gas velocity can reach 200 m/s) , expected in the break lines.
All the other flow meter are limited in their two-phase applications. Turbine:
• Span, is typically between 10:1 and 100:1.
• Operating temperature ranges span -270oC to 650oC, (-450oF to 1200oF). • Operating pressure ranges span coarse vacuum to 414 MPa, (60,000 psi).
• Pressure drop at the maximum rated flow rate ranges from around 0.3 kPa (0.05 psi) for gases to in the region of 70 kPa (10 psi) for liquids.
• Signal is influenced by the flow pattern. Drag:
• Accuracy is 0.5% of full scale, and 5.0% for probe type. • Repeatability is 0.15% of rate
• The turndown ratio is approximately 15:1 • Response time: from 0.002 to 0.1 sec
21
• Operating temperature ranges up to 649°C. • Operating pressure ranges up to 20.70 MPa. • Flow direction: Unidiretional/Bidiretional
The venturi meter can work at each operating conditions without failure, the most important drawbacks for this instruments is the limited span, usually 5:1. An array of instruments in then required to cover all the mass flow range if this instrument is selected. Concerning the dynamic response an appropriate set of transducers must be used, because the dynamic is different for each time interval of the break simulations.
Concerning the void fraction measurement device the impedance probes can be used for all the range, but particular care must be take in the selection of geometrical shape and material because this devices are strong influenced by flow pattern and temperature. The model to interpret the electric signal must be take in account the temperature effect and the phase distribution inside the pipe. Impedance probes do not influence the flow and, with a good interpretation model, the accuracy is fairly good.
For the void fraction measurements also Wire Mesh Sensor, EIT (Electrical Impedance Tomography) and Ultrasonic flow-meters ahs been analysed.
The ultrasonic meter is not been widely studied for their application in two-phase flow.
The EIT and the Wire mesh sensor can provide an insight of the void fraction distribution and of the flow pattern, instead.
The EIT can just detect bubbles that are travelling slower than the time necessary to complete the entire scan of all the sensors, but actually the dynamic permit to use this technology with velocity up to 20 m/s. The Wire mesh sensor is more invasive than the Tomography, but the pressure drop caused by the instrument is very little compared to the pressure inside break lines and it could be neglected. It can detect fast moving particles with a maximum frequency of 10 kHz (one scan every 0.01 ms).
The Wire mesh sensor is very promising, since it is possible to obtain the velocity of the gas phase and its profile inside the pipe.
But the drawbacks relate to this technology doesn’t allow the use in the SPES3 break lines. The upper limit for the pressure is 7 MPa.
The accuracy in void measurements depends on the mesh geometry, because the bubbles detectable by the sensor must have the same order dimension of the mesh cell. Then little quantity of liquid are
22
very difficult to detect, and a reduction in mesh dimension require a diameter of the wire so little that breaks due to the mass flow rates and flow velocities are expected.
8. Conclusions
Based on the instruments studies and on the measurement range parameter analysed, it possible to draw some conclusions:
- During transient simulation in the break lines, two phase flow occurs; to measure the thermohydraulic parameters a SP constituted by two, or three instruments must be installed in order to measure the velocity, the mass flow rate of each phase and the void fraction with an acceptable uncertain.
- The available commercial instruments able to be used in the SPES3 facility break lines are characterized by a limited span (but for turbine meters the span is 100:1), and then a certain number of instruments must be used in the same line to measure all the range of the parameters.
- The Spool Pieces selected to work in each range can be positioned in series or in parallel: in the first case all the instruments must be selected in order to avoid out-of-range failure. This configuration is unsuitable because each instrument requires a minimum value of L/D upstream and downstream of the straight uninterrupted flow line, and then high pipe lengths. In the second configuration (parallel SP) each Spool Piece line can be set to work in a certain range. An active control system must be used to place in line the most appropriate instrument during the test and exlude all the others. To verify how this configuration can modify the un-steady behaviour a RELAP code simulation could be useful.
- For the void fraction measurement, by using impedance probes, the most important issues are the temperature-dependent signal and the flow-pattern dependent signal; a very advanced model is required to obtain a good accuracy, but all the range can be measured without sensor failure and disturbance of the flow.
- The number of Spool Piece lines that have to be installed for each measurement point depends on:
Mass flow rate value released in each time interval, Mass flow rate variation during the time interval, Pressure e temperature variation,
23
- Concerning the choice to install the SP downstream or upstream of the break, pressure and velocity values as well as the geometry of the circuit must be considered.
24
25
26
27
Fig. 4: IRIS GENERAL VIEW
28
Fig. 6: SPES3- ADS Trains to Quench tank
Fig. 7: Quench tank to dry-well connection RPV QT ADS Train DRY-WELL QT QT to Dry-Well Φ = 5” sch. 40
29
Fig. 8: Dry-Well (D-W)to Reactor Vessel Cavity (RVC)
Fig. 9: DVI lines
Dry-Well to Cavity
Gas return line Φ = 2” sch. 40 Dry-Well to Cavity Liquid discharge line Φ = 4” sch. 40 D-W RV C DVI lines Φ = 1/2” sch. 80
30
Fig. 10: EBT DVI upper connections
EBT
RPV Φ=3/4” sch. 80
31
Fig. 11: EBTs bottom connection to DVI lines EBT
Φ = 3/8” sch. 80
32
Fig. 12: Dry well connection to pressure suppression system DW PSS Φ = 2 1/2” sch. 40 Φ = 3/4” sch. 40
33
Fig. 13: LGMS to DVI connections LGMS
Φ = 3/8”
34
Fig. 14: LGMS to PSS connections
Fig. 15: Connections between PSS and DVI lines PSS LGMS Φ = 1/2” sch 40 PSS (Φ = 3/8” sch. 40)
35
Fig. 16: Reactor vessel cavity RVC to DVI lines.
Fig. 17: Steam line connections RVC SL C Φ = 2 1/2” sch. 80 SL A and B Φ = 2” sch. 80 RPV
36
Fig. 18: RWST component (12 m3 volume, 9 m height)
Fig. 19: EHRS top connections
HL A and B, Φ = 2” sch.
37
Fig. 20: EHRS bottom connections
Fig. 21: DVI break to reactor vessel cavity (RVC)
CL A and B, Φ = 1 1/4” sch. 80 CL A and B, Φ = 1 1/4” SPLIT Φ = 2 1/2” sch. 40 RV C DEG Φ = 2 1/2” sch. 40
38
Fig. 22: ADS break lines
EBT RPV QT SPLIT Φ = 1 1/4” sch 40 DEG Φ = 1 1/4” sch. 40 RPV DW DEG Φ = 3” sch. 40 SPLIT Φ = 3” sch. 40
39
Fig. 23: EBT break to RPV
Fig. 24: Steam lines break to dry well
Fig. 25: Steam lines break to dry well (top view) RP V DW DW RPV DEG-Φ= 3” ½ sch. 40 SPLIT Φ= 3 ½ “ sch 40 Steam header SPLIT Φ=3½ “ sch 40 DEG-Φ=3”½ sch. 40
40
Fig. 26: Feed line break to reactor cavity
Fig. 27: Feed line break to reactor cavity (top view)
RV C
Steam header Connections to RPV
Steam line break DEG Φ = 3” sch. 40
Steam line break
SPLITΦ = 3” sch 40 RVC Steam line break SPLIT Φ = 3” sch. 40 Steam line break DEG Φ = 3”
41
42
Fig. 29: Drywell to RC connections and instrumentation
43
Bibliography
(1) WCAP-16082-NP, IRIS Preliminary Safety Assessment, -- Volume I -- July 15, 2003, Westinghouse Electric Company
(2) WCAP-16062-NP, IRIS Plant Description Document, March 21, 2003, Westinghouse Electric Company
(3) ENEA, Centro Ricerche Bologna, Status of SPES3-IRIS Facility design, FPN-P9LU-002;7/6/2007 Introduction
(4) R. Ferri, C. Congiu,SPES3-IRIS facility RELAP5 base Case transient analysis for design support, SIET 01 489 RT 09, Rev.
(5) Standard UNI EN ISO 5167-1,2,3,4: October 2004. Measurement of fluid flow by means of pressure differential devices inserted in circular cross-section conduits running full.
(6) Investigation of the two-phase flow instrumentation necessary for the SPES3 facility. Annamaria Mosetto. Politecnico di Torino. Dipartimento di Energetica. Relazione per CIRTEN Luglio 2010
(7) State of art and Selection of techniques in Multiphase Flow Measurement. Grazia Monni Politecnico di Torino. Dipartimento di Energetica. Luglio 2010
(8) Spool Piece per la misura della portata: messa a punto di una metodica di misura e risultati sperimentali ottenuti con miscele aria-acqua in deflussi anulari. Grazia Monni Politecnico di Torino. Dipartimento di Energetica. Maggio 2010
44
Appendix
DESCRIPTION OF THE THERMOHYDRAULICS OF SOME BASE CASES: UPSTREAM BREAK LINES
RELAP5/MOD3 is a "best estimate" system code suitable for the analysis of all transients and postulated accidents in Light Water Reactor (LWR) systems, including both large- and small-break loss-of-coolant accidents (LOCAs) as well as the full range of operational transients.
The RELAP code allows for the determination of the flow main characteristics in each volume that is included in the nodalisation.
For each location a monitoring volume has been defined for the extraction of the variables necessary to the setting of the instrumental range.
The monitoring volumes in the break lines are located UPSTREAM and DOWNSTREAM the orifice that simulates the break. Usually there is only one volume before the break, therefore there is no chance in defining the volume. With regard to the DOWNSTREAM situation, the monitoring volumes has been defined in order to minimize the possible pipe works influence on the flow profile.
The five base cases that will be analysed are summarized in Table 1.
For each case the upstream volume, the junction (motor valve), the downstream volume and the nozzle are indicated in a proper table. Here the volume with instrumentation is specified.
For each case just the DEG (Double Ended Guillotine) break is simulated. This event is the design-basis accident for conventional LWR plants, that is a circumferential break, representing a complete severance of the pipe.
In the SPES3 facility the break is reproduced involving two lines: the DEG break line and the SPLIT break line. The aim of the present work is to show the trend of different variables during the transients:
In order to provide the instrumentation, the main variables taken into consideration are: - The void fraction and the quality
- The mass flow
- The gas and liquid velocity - The pressure
- The gas and liquid temperature -
These variables are presented in 5 graphs for each break line and a table summarizes the maximum and minimum values.
It’s of paramount importance to evaluate the mass flow rate and the void fraction in the ADS ST and DT lines (stage I and II) upstream and downstream of the valve. Another table points out the minimum and maximum values for the previous four lines and a graph shows the void fraction only for the ADS ST line (stage I).
With regard to the ADS ST and DT lines usually there is only one volume downstream, therefore the variables are taken there, whereas upstream the monitoring volume has been defined in order to minimize the possible pipe works influence on the flow profile.
All the graphs inserted in this document have been presented with a logarithmic scale for the time axis.
45
Tabella 1: Base cases for the SPES3 break transients
RELAP base case number Case name Description
SPES 89 DVI break Double Ended Guillotine break of the Direct Vessel Injection Line B
SPES 90 EBT break Double Ended Guillotine break of the top connection between the Emergency Boration Tank and the
Reactor Vessel B
SPES 91 ADS break Double Ended Guillotine break of the Automatic Depressurization System B, on the Single Train Line SPES 92 SL break Double Ended Guillotine break of the Steam Line B SPES 93 FL break Double Ended Guillotine break of the Feed Line B
46
DVI BREAK LINE
SPES3 89, DVI DEG break
DVI DEG break line
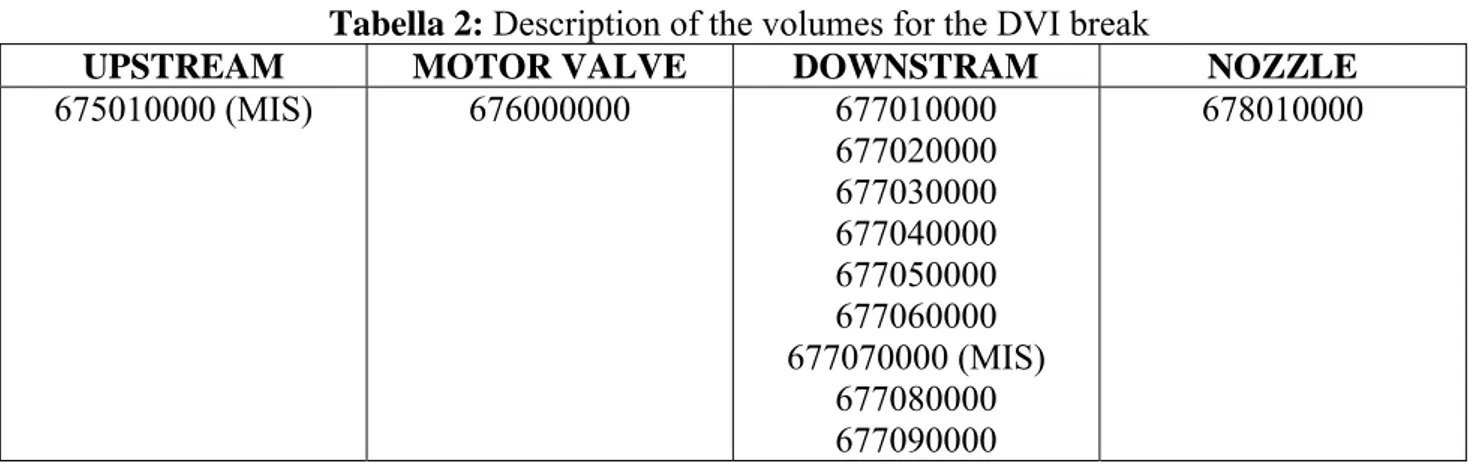
Tabella 2: Description of the volumes for the DVI break
UPSTREAM MOTOR VALVE DOWNSTRAM NOZZLE
675010000 (MIS) 676000000 677010000 677020000 677030000 677040000 677050000 677060000 677070000 (MIS) 677080000 677090000 678010000 UPSTREAM
DVI DEG break line
-0.5 -0.3 -0.1 0.1 0.3 0.5 0.7 0.9 1.1
1.E+00 1.E+01 1.E+02 1.E+03 1.E+04 1.E+05
time(s)
gas void fraction quality
Fig. A 1.1 DVI DEG BREAK LINE: void fraction and mass flow quality Gas void
fraction
47 -0.1 0 0.1 0.2 0.3 0.4 0.5 0.6 0.7 0.8
1.E+00 1.E+01 1.E+02 1.E+03 1.E+04 1.E+05
time (s)
kg
/s
mflowj 675010000 mass flow 676010000 mass flow DVI DEG
Fig. A 1.2 DVI DEG BREAK LINE: mass flow rate
DVI DEG break line
-10 0 10 20 30 40 50 60 70
1.00E+00 1.00E+01 1.00E+02 1.00E+03 1.00E+04 1.00E+05
time (s)
m/
s
liquid velocity gas velocity
Fig. A 1.3 DVI DEG BREAK LINE: phase velocities Flow rate
Vapour velocity
Liquid velocity
48
DVI DEG break line
0 2 4 6 8 10 12 14 16 18
1.E+00 1.E+01 1.E+02 1.E+03 1.E+04 1.E+05
time (s)
MP
a
pressure
Fig. A 1.4 DVI DEG BREAK LINE: Pressure history
DVI DEG break line
300 350 400 450 500 550 600 650
1.E+00 1.E+01 1.E+02 1.E+03 1.E+04 1.E+05
time (s)
K
liquid temperature gas temperature saturation temperature
49
DVI DEG break line MIN MAX
void fraction 0.0000 1.0000 volume equilibrium quality -0.9076 1.0429 mass flow rate kg/s -0.0005 0.7023 liquid velocity m/s -0.2459 27.7336
gas velocity m/s -1.3802 63.6599 liquid temperature K 308.4040 553.2080
gas temperature K 316.4240 618.6600 pressure MPa 0.1266 15.6391
50
2. DVI SPLIT break line
UPSTREAM MOTOR VALVE DOWNSTRAM NOZZLE
665010000 (MIS) 666000000 667010000 667020000 667030000 667040000 667050000 667060000 667070000 667080000 667090000 (MIS) 667100000 667110000 667120000 667130000 667140000 668010000 UPSTREAM
DVI SPLIT break line
-0.4 -0.2 0 0.2 0.4 0.6 0.8 1 1.2
1.00E+00 1.00E+01 1.00E+02 1.00E+03 1.00E+04 1.00E+05
time (s)
gas void fraction quality
51 -0.2 0 0.2 0.4 0.6 0.8 1 1.2 1.4
1.E+00 1.E+01 1.E+02 1.E+03 1.E+04 1.E+05
time (s)
kg
/s
mglowj 666000000 mass flow DVI SPLIT
Fig. A2.2 Mass flow transient (DVI SPLIT break line)
DVI SPLIT break line
-20 0 20 40 60 80 100 120 140 160
1.E+00 1.E+01 1.E+02 1.E+03 1.E+04 1.E+05
time (s)
m/s
liquid velocity gas velocity
52
DVI SPLIT break line
0 2 4 6 8 10 12 14 16 18
1.E+00 1.E+01 1.E+02 1.E+03 1.E+04 1.E+05
time (s)
MP
a
pressure
Fig. A2.4 Pressure transient (DVI SPLIT break line)
DVI SPLIT break line
300 350 400 450 500 550 600 650
1.E+00 1.E+01 1.E+02 1.E+03 1.E+04 1.E+05
time (s)
K
liquid temperature gas temperature saturation temperature
53
DVI SPLIT break line MIN MAX void fraction 0.0000 0.9994 volume equilibrium quality -0.9012 0.9975 mass flow rate kg/s -0.1308 1.3328 liquid velocity m/s -4.0312 12.0997
gas velocity m/s -13.5510 154.1660 liquid temperature K 375.5650 593.3750 gas temperature K 375.5650 618.6600
pressure Mpa 0.2102 15.6391
3. ADS lines (DVI SPLIT Break line) -0.1 0 0.1 0.2 0.3 0.4 0.5 0.6 0.7 0.8 0.9 1 1.1
1.E+00 1.E+01 1.E+02 1.E+03 1.E+04 1.E+05
time (s) vo id f rac ti o n
voidg 152030000 ADS ST stage I
Fig. A3.1 Void fraction
DVI DEG break Volume MIN MAX
ADS DT stage I Void Fraction 142080000 0.8111 1.0000 ADS ST stage I Plot
ADS DT stage II Void Fraction 132020000 0.0986 1.0000 ADS ST stage II Void Fraction 135020000 0.0000 1.0000 ADS DT stage I Mass Flow (kg/s) 143000000 -0.0160 1.8389 ADS DT stage II Mass Flow (kg/s) 144000000 -0.0097 0.0153 ADS ST stage I Mass Flow (kg/s) 153000000 -0.1311 0.9082 ADS ST stage II Mass Flow (kg/s) 154000000 -0.0021 0.0079
ii
FLOW REGIMES: DVI DEG line– Upstream – Downstream
Time 675010 677010 677030 677050 677070 677090 678010 0 BBY CHF MPR CHF MPR CHF MPR CHF MPR CHF MPR CHF MPR 1 BBY ANM ANM ANM ANM ANM ANM 2 HST ANM ANM ANM ANM ANM HST 7 HST ANM HST HST HST HST HST 54 HST HST HST HST HST HST HST 56 HST HST HST HST HST HST CHF MPR 184 HST HST HST HST HST HST HST 185 BBY HST HST HST HST HST HST 437 BBY BBY HST HST HST HST HST 454 BBY SLG HST HST HST HST HST 487 BBY ANM HST HST HST HST HST 488 HST ANM HST HST HST HST HST 490 SLG ANM HST HST HST HST HST 810 SLG ANM HST HST HST HST HST 1020 CHF MPR ANM HST HST HST HST HST 1390 HST ANM HST HST HST HST HST 1850 HST HST HST HST HST HST HST 1860 HST CHF MPR CHF MPR CHF MPR HST HST HST 1910 HST CHF MPR CHF MPR CHF MPR CHF MPR HST HST 1920 HST CHF MPR CHF MPR CHF MPR CHF MPR CHF MPR HST 1940 HST CHF MPR CHF MPR CHF MPR CHF MPR CHF MPR CHF MPR 2090 HST CHF MPR CHF MPR CHF MPR CHF MPR HST HST 2180 HST HST HST HST HST HST HST 2190 BBY HST HST HST HST HST HST 2200 BBY BBY HST HST HST HST HST 2210 BBY HST HST HST HST HST HST 2220 BBY BBY HST HST HST HST HST 2230 BBY HST HST HST HST HST HST 6690 BBY BBY HST HST HST HST HST 25790 BBY HST HST HST HST HST HST 99990 HST HST HST HST HST HST HST
iii
DVI SPLIT line – Usptream - Downstream
Time 665010 667010 667050 667090 667140 668010
0 BBY HST HST HST HST HST
192 BBY ANM ANM ANM ANM ANM
334 BBY ANM ANM ANM ANM HST
337 BBY ANM HST HST ANM HST
432 BBY ANM HST HST HST HST 452 HST/BBY ANM HST HST HST HST 1740 HST ANM HST HST HST HST 1750 HST HST HST HST HST HST 1760 HST ANM HST HST HST HST 2460 HST HST HST HST HST HST 2750 HST HST HST HST HST CHF MPR 2810 HST HST HST HST HST HST 2990 HST HST HST HST CHF MPR 3070 HST HST HST HST CHF MPR/HST HST 4600 HST HST HST HST HST HST 4780 HST HST HST HST HST CHF MPR/HST 5410 HST HST HST HST CHF MPR/HST CHF MPR/HST 5450 HST HST HST HST HST HST 5480 BBY HST HST HST HST HST 6200 BBY BBY HST HST HST HST 6440 BBY HST/BBY HST HST HST HST
6550 BBY HST/BBY HST HST BBY HST
6580 BBY HST/BBY HST HST HST HST 6910 HST HST/BBY HST HST HST HST 6920 BBY HST/BBY HST HST HST HST 7020 HST HST/BBY HST HST HST HST 8890 BBY BBY HST HST HST HST 9810 HST HST HST HST HST HST 9820 HST HST HST HST BBY HST 9850 HST BBY HST HST BBY HST 9880 HST BBY HST HST HST/BBY HST 10700 HST BBY HST HST BBY HST
10710 HST BBY HST BBY BBY HST
10740 HST BBY HST HST BBY HST
10900 HST BBY HST BBY BBY HST
10940 HST BBY BBY/HST BBY BBY HST
10980 HST BBY BBY/HST BBY HST HST
11010 HST BBY BBY/HST HST HST HST
11160 HST BBY HST HST HST HST
11300 HST HST HST HST HST HST
26890 BBY BBY HST HST HST HST
iv
4 SPES3, 90, EBT break EBT DEG break line
UPSTREAM MOTOR VALVE DOWNSTRAM NOZZLE
652010000 (MIS) 653000000 654010000 654020000 654030000 (MIS) 654040000 654050000 654060000 654070000 655010000 UPSTREAM
EBT DEG break line
-0.8 -0.6 -0.4 -0.2 0 0.2 0.4 0.6 0.8 1 1.2
1.00E+00 1.00E+01 1.00E+02 1.00E+03 1.00E+04 1.00E+05
time (s)
gas void fraction quality
v -0.2 0 0.2 0.4 0.6 0.8 1 1.2 1.4 1.6 1.8 2
1.00E+00 1.00E+01 1.00E+02 1.00E+03 1.00E+04 1.00E+05
time (s)
kg/
s
mflowj 65201000 mass flow EBT DEG
Fig. A4. 2 Mass flow Transient (EBT DEG break Line)
EBT DEG break line
-20 -10 0 10 20 30 40 50 60 70
1.00E+00 1.00E+01 1.00E+02 1.00E+03 1.00E+04 1.00E+05
time (s)
m/s
liquid velocity gas velocity
vi
EBT DEG break line
0.00E+00 2.00E+00 4.00E+00 6.00E+00 8.00E+00 1.00E+01 1.20E+01 1.40E+01 1.60E+01 1.80E+01
1.00E+00 1.00E+01 1.00E+02 1.00E+03 1.00E+04 1.00E+05
time (s)
MP
a
pressure
Fig. A4. 4 Pressure transien (EBT DEG break Line)
EBT DEG break line
0 100 200 300 400 500 600 700
1.00E+00 1.00E+01 1.00E+02 1.00E+03 1.00E+04 1.00E+05
time (s)
K
liquid temperature gas temperature saturation temperature
vii
DVI DEG break line MIN MAX
void fraction 0.0000 0.9997 volume equilibrium quality -1.4991 0.9964 Mass flow rate kg/s -0.0122 1.7372 Liquid velocity m/s -2.2831 6.5990 gas velocity m/s -10.4934 61.2530 Liquid temperature K 314.0290 493.8590 gas temperature K 324.3550 618.0670 pressure Mpa 0.1257 15.5245
viii
5. EBT SPLIT break line
UPSTREAM MOTOR VALVE DOWNSTRAM NOZZLE
622010000 (MIS) 643000000 644010000 644020000 644030000 (MIS) 644040000 644050000 644060000 644070000 645010000 UPSTREAM
EBT SPLIT break line
-0.3 -0.1 0.1 0.3 0.5 0.7 0.9 1.1
1.00E+00 1.00E+01 1.00E+02 1.00E+03 1.00E+04 1.00E+05
time (s)
gas void fraction quality
ix
mflowj 643000000 mass flow EBT SPLIT
-0.5 0 0.5 1 1.5 2 2.5 3 3.5 4 4.5 5
1.00E+00 1.00E+01 1.00E+02 1.00E+03 1.00E+04 1.00E+05
time (s)
kg
/s
Fig. A5.2 Mass flow history (EBT SPLIT brak line)
EBT SPLIT break line
-40 -20 0 20 40 60 80 100 120
1.00E+00 1.00E+01 1.00E+02 1.00E+03 1.00E+04 1.00E+05
time (s)
m/s
liquid velocity gas velocity
x
EBT SPLIT break line
0 2 4 6 8 10 12 14 16 18
1.00E+00 1.00E+01 1.00E+02 1.00E+03 1.00E+04 1.00E+05
time (s)
MPa
pressure
Fig. A5.4 Pressure history (EBT SPLIT break line)
EBT SPLIT break line
300 350 400 450 500 550 600 650 1 10 100 time (s) 1000 10000 100000 K liquid temperature gas temperature saturation temperature
xi
EBT SPLIT break line MIN MAX
void fraction 0.0000 1.0000 volume equilibrium quality -1.4991 1.0651 mass flow rate kg/s -0.0202 4.6686 liquid velocity m/s -17.2207 66.6764
gas velocity m/s -20.8762 106.1670 liquid temperature K 314.0370 600.3600 gas temperature K 406.3700 618.0670
Pressure Mpa 0.3417 15.5245
Table A5: Main Tho phase flow variables
ADS lines flow during the EBT SPLIT break line
-0.1 0 0.1 0.2 0.3 0.4 0.5 0.6 0.7 0.8 0.9 1 1.1
1.00E+00 1.00E+01 1.00E+02 1.00E+03 1.00E+04 1.00E+05
time (s) v o id fr a c ti o n
voidg 152030000 ADS ST stage I
xii
EBT DEG break Volume MIN MAX
ADS DT stage I Void Fraction 1.42E+08 0.7260 1.0000 ADS DT stage II Void Fraction 1.32E+08 0.1098 1.0000
ADS ST stage I Plot
ADS ST stage II Void Fraction 1.35E+08 0.0000 1.0000 ADS DT stage I Mass Flow 1.43E+08 -0.0036 1.9801 ADS DT stage II Mass Flow 1.44E+08 -0.0209 0.0145 ADS ST stage I Mass Flow 1.53E+08 -0.0024 0.9577 ADS ST stage II Mass Flow 1.54E+08 -0.0067 0.0109
xiii
FLOW REGIMES (ADS line): EBT DEG line – Usptream - Downstream
Time 652010000 654010000 654030000 654070000 655010000
0 BBY CHF MPR CHF MPR CHF MPR CHF MPR
2 BBY ANM ANM ANM ANM
1700 HST HST HST HST ANM 1720 HST SLG HST HST ANM 2040 HST HST HST HST HST 2310 HST HST HST HST CHF MPR 2370 HST HST HST HST HST 3240 HST HST HST HST CHF MPR 3620 HST HST HST HST HST 3640 HST HST HST HST CHF MPR 99990 HST HST HST HST HST
EBT SPLIT line – Usptream - Downstream
Time 622010000 644010000 644030000 644070000 645010000
0 BBY CHF MPR CHF MPR CHF MPR CHF MPR
78 BBY ANM ANM ANM ANM
79 SLG ANM ANM ANM ANM
125 ANM ANM ANM ANM ANM
130 SLG ANM ANM ANM ANM
137 BBY ANM ANM ANM ANM
139 SLG ANM ANM ANM ANM
159 ANM ANM ANM ANM ANM
550 CHF MPR ANM ANM ANM ANM
850 CHF MPR ANM ANM ANM HST
910 CHF MPR CHF MPR ANM ANM HST 1150 CHF MPR CHF MPR CHF MPR CHF MPR HST 1620 CHF MPR CHF MPR HST HST HST 1790 CHF MPR HST HST HST HST 1820 CHF MPR CHF MPR CHF MPR CHF MPR CHF MPR 1830 HST HST CHF MPR CHF MPR CHF MPR 2470 HST HST HST HST HST 3870 HST HST HST HST CHF MPR 6190 HST HST HST HST HST 6200 HST HST HST HST CHF MPR 7500 HST HST HST HST HST 8050 HST HST/ CHF MPR HST HST HST 8070 CHF MPR HST/ CHF MPR HST HST HST 10830 HST HST HST HST HST 10840 HST HST HST HST CHF MPR 99990 HST HST HST HST HST
xiv
6. SPES91, ADS DEG break line ADS DEG break line
UPSTREAM MOTOR VALVE DOWNSTRAM NOZZLE
126010000 (MIS) 127000000 128010000 128020000 128030000 128040000 (MIS) 128050000 129010000 UPSTREAM
ADS DEG break line
-0.2 0 0.2 0.4 0.6 0.8 1 1.2
1.00E+00 1.00E+01 1.00E+02 1.00E+03 1.00E+04 1.00E+05
time (s)
gas void fraction quale
xv -0.5 0 0.5 1 1.5 2 2.5 3 3.5 4
1.00E+00 1.00E+01 1.00E+02 1.00E+03 1.00E+04 1.00E+05
time (s)
kg
/s
mflowj 127000000 mass flow ADS DEG
Fig. A6.2 mass flow history (ADS break line)
ADS DEG break line
-5 0 5 10 15 20 25 30
1.00E+00 1.00E+01 1.00E+02 1.00E+03 1.00E+04 1.00E+05
liquid velocity gas velocity
xvi
ADS DEG break line
0 2 4 6 8 10 12 14 16 18
1.00E+00 1.00E+01 1.00E+02 time (s) 1.00E+03 1.00E+04 1.00E+05
MPa
pressure
Fig. A6.4 Pressure history (ADS break line)
ADS DEG break line
300 350 400 450 500 550 600 650
1.00E+00 1.00E+01 1.00E+02 time (s) 1.00E+03 1.00E+04 1.00E+05
K
liquid temperature gas temperature saturation temperature
Fig. A6.5 Temperature history (ADS break line)
xvii
void fraction 0.0008 1.0000 volume equilibrium quality 0.0000 0.0000 mass flow rate kg/s -0.0102 3.6046 liquid velocity m/s -2.8502 14.3460
gas velocity m/s -2.8502 25.1588 liquid temperature K 347.6950 615.9080
gas temperature K 350.4220 617.9740 Pressure Mpa 0.1563 15.5067
xviii
7. ADS SPLIT break line
UPSTREAM MOTOR VALVE DOWNSTRAM NOZZLE
157010000 (MIS) 158000000 133010000 133020000 133030000 133040000 (MIS) 133050000 133060000 133070000 159010000 UPSTREAM
ADS SPLIT break line
0 0.2 0.4 0.6 0.8 1 1.2
1.00E+00 1.00E+01 1.00E+02 1.00E+03 1.00E+04 1.00E+05
time (s)
gas void fraction quality
xix -1 0 1 2 3 4 5
1.00E+00 1.00E+01 1.00E+02 1.00E+03 1.00E+04 1.00E+05
time (s)
kg
/s
mflowj 1570100000 mass flow ADS SPLIT
Fig. A7.2 mass flow history (ADS SPLIT break line)
ADS SPLIT break line
-20 -10 0 10 20 30 40
1.00E+00 1.00E+01 1.00E+02 1.00E+03 1.00E+04 1.00E+05
time (s)
m/s
fluid velocity gas velocity
xx
ADS SPLIT break line
0 2 4 6 8 10 12 14 16 18
1.00E+00 1.00E+01 1.00E+02 1.00E+03 1.00E+04 1.00E+05
time (s)
MP
a
pressure
Fig. A7.4 Pressure history (ADS SPLIT break line)
ADS SPLIT break line
300 350 400 450 500 550 600 650
1.00E+00 1.00E+01 1.00E+02 1.00E+03 1.00E+04 1.00E+05
time (s)
K
liquid temperature gas temperature saturation temperature
xxi
DVI SPLIT break line MIN MAX void fraction 0.0424 1.0000 volume equilibrium quality -0.0560 1.0905 mass flow rate kg/s -0.0442 4.5107 liquid velocity m/s -11.6084 35.8412
gas velocity m/s -12.5918 35.8412 liquid temperature K 349.4430 615.6810
gas temperature K 349.5890 617.9750 pressure Mpa 0.2640 15.5067
Table A.7: Main two phase flow range variables ADS lines 0 0.2 0.4 0.6 0.8 1 1.2
1.00E+00 1.00E+01 1.00E+02 1.00E+03 1.00E+04 1.00E+05
time (s) void fr ac ti o n
voidg 152030000 ADS ST stage I
Fig. A7.6 Void Fraction into ADS line during ADS DEG line break
ADS DEG break Volume MIN MAX
ADS DT stage I Void Fraction 142080000 0.3793 1.0000 ADS DT stage II Void Fraction 132020000 0.0845 1.0000
ADS ST stage I Plot
ADS ST stage II Void Fraction 135020000 0.0000 1.0000 ADS DT stage I Mass Flow 143000000 -0.0111 3.1324 ADS DT stage II Mass Flow 144000000 0.0000 0.0000 ADS ST stage I Mass Flow 153000000 -0.2696 0.0102 ADS ST stage II Mass Flow 154000000 0.0000 0.0000
xxii
FLOW REGIMES : ADS DEG Line – Upstream – Downtream
Time 126010000 128010000 128040000 128050000 129010000
0 BBY CHF MPR CHF MPR CHF MPR CHF MPR
1 ANM ANM ANM ANM ANM
2 SLG ANM ANM ANM ANM
2120 HST HST HST HST HST 2130 CHF MPR CHF MPR HST HST HST 2220 CHF MPR CHF MPR CHF MPR CHF MPR CHF MPR 2250 CHF MPR CHF MPR HST HST HST 2260 CHF MPR CHF MPR CHF MPR HST HST 2880 CHF MPR CHF MPR CHF MPR CHF MPR CHF MPR 2890 HST CHF MPR CHF MPR CHF MPR CHF MPR 2900 HST HST CHF MPR CHF MPR CHF MPR 2910 HST HST CHF MPR CHF MPR CHF MPR 2920 HST HST HST HST/ CHF MPR CHF MPR 2930 HST HST HST HST/ CHF MPR HST 2950 HST HST HST HST/ CHF MPR CHF MPR 3040 HST HST CHF MPR HST/ CHF MPR CHF MPR 3770 CHF MPR CHF MPR CHF MPR HST/ CHF MPR CHF MPR 3910 CHF MPR CHF MPR CHF MPR HST/ CHF MPR HST/ CHF MPR 8810 CHF MPR CHF MPR CHF MPR CHF MPR HST/ CHF MPR 8820 CHF MPR HST CHF MPR CHF MPR HST/ CHF MPR 8830 HST HST CHF MPR CHF MPR HST/ CHF MPR 8840 CHF MPR HST CHF MPR CHF MPR HST/ CHF MPR 9860 HST HST CHF MPR CHF MPR HST/ CHF MPR 10490 HST HST CHF MPR CHF MPR HST/ CHF MPR 10500 HST HST HST CHF MPR HST/ CHF MPR 10510 HST HST CHF MPR CHF MPR HST/ CHF MPR 10750 HST HST HST CHF MPR HST/ CHF MPR 10890 HST HST HST HST/ CHF MPR HST/ CHF MPR 11250 HST HST HST HST HST/ CHF MPR 99990 HST HST HST HST HST
xxiv
ADS SPLIT Line – Upstream – Downtream
Time 157010000 133010000 133040000 133070000 159010000
0 HST CHF MPR CHF MPR CHF MPR CHF MPR
1 HST ANM ANM ANM ANM
ANM ANM ANM ANM ANM
22 ANM ANM ANM ANM ANM
23 CHF MPR ANM ANM ANM ANM
27 ANM ANM ANM ANM ANM
57 SLG ANM ANM ANM ANM
207 ANM ANM ANM ANM ANM
333 CHF MPR ANM ANM ANM ANM
550 CHF MPR ANM ANM ANM HST
1140 CHF MPR ANM HST HST HST 1520 CHF MPR HST HST HST HST 1550 CHF MPR HST HST HST CHF MPR 1560 HST HST HST HST CHF MPR 1570 CHF MPR HST HST CHF MPR CHF MPR 1580 HST HST CHF MPR CHF MPR CHF MPR 1590 HST HST CHF MPR HST HST 2130 HST HST HST HST HST 2140 HST CHF MPR HST HST HST 2740 HST CHF MPR CHF MPR CHF MPR CHF MPR 3890 CHF MPR CHF MPR CHF MPR CHF MPR CHF MPR 3960 CHF MPR CHF MPR CHF MPR HST HST 13290 CHF MPR CHF MPR CHF MPR CHF MPR CHF MPR 15420 HST HST CHF MPR CHF MPR CHF MPR 15430 HST HST HST CHF MPR CHF MPR 15660 HST HST CHF MPR CHF MPR CHF MPR 15840 HST HST HST CHF MPR CHF MPR 16270 HST HST HST HST CHF MPR 16710 HST HST HST HST HST/ CHF MPR 99990 HST HST HST HST HST
xxv
8. SPES3 91, SL DEG break SL DEG break line
UPSTREAM MOTOR VALVE DOWNSTRAM NOZZLE
570010000 (MIS) 571000000 572010000 572020000 572030000 (MIS) 572040000 572050000 573010000 UPSTREAM
SL DEG break line
0.5 0.6 0.7 0.8 0.9 1 1.1 1.2
1.00E+00 1.00E+01 1.00E+02 1.00E+03 1.00E+04 1.00E+05
time (s)
gas void fraction quality
xxvi -1 0 1 2 3 4 5 6
1.00E+00 1.00E+01 1.00E+02 1.00E+03 1.00E+04 1.00E+05
time (s)
kg
/s
mflowj 571000000 mass flow SL DEG
Fig. A8.2 Mass flow history (SL DEG Break line)
SL DEG break line
-20 0 20 40 60 80 100 120 140 160
1.00E+00 1.00E+01 1.00E+02 1.00E+03 1.00E+04 1.00E+05
time (s)
m/s
liquid velocity gas velocity
xxvii
SL DEG break line
0 1 2 3 4 5 6 7
1.00E+00 1.00E+01 1.00E+02 1.00E+03 1.00E+04 1.00E+05
time (s)
MPa
pressure
Fig. A8.4 Pressure history (SL DEG Break line)
SL DEG break line
0 100 200 300 400 500 600 700
1.00E+00 1.00E+01 1.00E+02 1.00E+03 1.00E+04 1.00E+05
time (s)
K
liquid temperature gas temperature saturation temperature
Fig. A8.5 Temperature history (SL DEG Break line)
xxviii
void fraction 0.9990 1.0000 volume equilibrium quality 0.6767 1.1471 mass flow rate kg/s -0.0212 5.5071 liquid velocity m/s -0.4145 131.6760
gas velocity m/s -7.3419 135.8310 liquid temperature K 363.3310 546.7500 gas temperature K 387.1220 582.7480
pressure MPa 0.1224 5.8197
xxix
9. SL SPLIT break line
UPSTREAM MOTOR VALVE DOWNSTRAM NOZZLE
575010000 576000000 577010000 577020000 577030000 577040000 (MIS) 577050000 577060000 578010000 UPSTREAM
SL SPLIT break line
0.7 0.8 0.9 1 1.1 1.2 1.3
1.00E+00 1.00E+01 1.00E+02 1.00E+03 1.00E+04 1.00E+05
time (s)
gas void fraction quality