Procedia - Social and Behavioral Sciences 113 ( 2014 ) 91 – 110
1877-0428 © 2013 The Authors. Published by Elsevier Ltd.
Selection and peer-review under responsibility of Cognitive-counselling, research and conference services (c-crcs). doi: 10.1016/j.sbspro.2014.01.015
ScienceDirect
2013 International Congress on Clinical and Counselling Psychology (CPSYC)
Conjoint Family Drawing:
a technique for family clinical assessment
Marialuisa Gennari
a, Giancarlo Tamanza
bc aResearcher in Clinical Psychology, Catholic University, Brescia , 25100, Italyb
Clinical Associate Professor, Catholic University, Brescia 25100, Italy Abstract
Born in 1970 by Bing, Conjoint Family Drawing is very useful in research as well as in clinical settings because it allows to assess the family as a whole. Unfortunately, a lack of studies and researches identifying a clear grid or unambiguous criteri a for its interpretation is to be acknowledged. Ho w can data from the Conjoint Family Drawing be used in a standardized and structured fashion? Which of the elements and aspects in the drawings need to be considered to assess families? T his paper aims to identify a group of categorical variables that will serve for an objective interpretation of drawings as well as to verify the instrument’s discriminant capacity. In particular, the criteria and variables found in literature on the use of drawings and other family assessment instruments were explored and their suitability for the explanation of Conjoint Family Drawings (CFD) was tested out. A coding grid of 18 categorical variables (10 concern various elements in the drawin g and the remaining 8 concern the drawing making process) was developed and applied on a sample of 117 CFDs from clinical and non-clinical families. T he variables consider emotional, interactive and relational aspects. A two –step cluster analysis was carried out to define discriminant variables and 6 different family typologies were identified.
© 2013 T he Authors. Published by Elsevier Ltd.
Selection and peer-review under responsibility of Dr. Zafer Bekirogullari.
Keywords: Conjoint Family Drawing; clinical techniques; family assessment;
c Corresponding author. E-mail address: marialuisa.gennari@unicatt.it; giancarlo.tamanza@unicatt.it. © 2013 The Authors. Published by Elsevier Ltd.
1. Introduction
Family therapy practitioners share the belief that any source of difficulty or suffering is primarily interactional in nature. The goal of family therapy is therefore that of evaluating the family as a unity, that is, as a group of individuals relating to and deeply influencing each other. In order to reach this goal, a set of assessment techniques focused on family interactions rather than on personality traits or individual functioning are needed.
Among the various assessment techniques (either interactive, observational, or projective), family drawings assume a great relevance. Drawings might be a particularly suitable instrument when working with families for several reasons: first of all they can be easily adopted with young children; children in fact learn to express themselves throughout drawings very early on in their lives. Thanks to drawings, 4-5 year old children are allowed the expression of their symbolic activity that can otherwise be accessed throughout more structured and intentional communication tools only at a later stage in their development (Yamagata, 2007).
Moreover, drawing is easier and more spontaneous if compared to self report instruments or psychological interviews. For such reasons it elicits the motivation, commitment and compliance of subjects also if they have limited skills due to emotional, psychopathological problems or cognitive impairments (Oster & Crone, 2004; Artut, 2006). Finally, drawings facilitate the expression of thoughts and feelings that are hardly conveyed in the subject's intentional discourses (Merrell, 2008; Einarsdottir, Dockett & Perry, 2009; Freilich & Schechtman, 2010) therefore enabling a holistic and deeper understanding, necessary for the clinical work.
Even if the matter is still rather controversial, drawings seem to be more reliable if compared to verbal communication when working with foreigners. Short term immigrant families are often characterized by limited or superficial discourse productions due to a scarce proficiency in the language of the hosting country. Verbal techniques and self report instruments might also be biased as the desire to please or be accepted by the interviewer can significantly affect the answers reliability.
All the above mentioned aspects contribute to make drawings particularly suitable and useful for the assessment of families, especially given the characteristics of contemporary society where families are heterogeneous and present high levels of complexity.
2. Problem Statement
Starting from the '70s, the clinical use of drawings is widely spread in the western context. However, problems in term of reliability and validity have been underlined in several studies. For such reason the use of drawings is not recommended for child custody evaluation procedures in the United States (EricKson, Lilienfeld & Vitacco, 2007; Archer, Buffington-Vollum, Vauter Stredny & Handel, 2006).
Over time several coding grids have been developed in order to make drawings objective and reliable tools for data collection. (Naglieri, 1988; Gantt & Tabone, 1998). However, the studies conducted on the use of such grids showed the presence of several faults that are briefly discussed below. A first problematic area concerns the inter-rater agreement whose values are often below the acceptability threshold and vary significantly according to the judges (Palmer et al. 2000; Eitel, Szkura, Pokorny & Von Wietersheim, 2008). In this respect much literature underlines the need for an accurate and structured training for the coders in order to contain and limit the problem.
As far as content validity is concerned, literature shows a great influence of the context and the specific situation in which the drawing is administered. In this respect, several authors underline the importance of considering the drawing looking for state characteristics - contingent and temporary and totally dependent on the situation - as well as for traits - stale and structural features of the person making the drawing (Lilienfeld, Wood & Garb, 2000). Another problem, that is often reported in the literature on the topic, concerns the correspondence between the graphic elements and the psychological traits of the person who made the drawing. In this respect, global score systems consider multiple graphic elements as indicators of single psychological traits (Matto,
Naglieri, & Clausen, 2005) and allow the investigation of more complex emotional aspects, such as the emotional characteristics (Garb, Lilienfeld & Wood, 2004).
Several studies also underline the importance of separating the artistic quality of the graphic production from its coding (Lilienfeld, Wood & Garb, 2000).
One last problematic area concerns the variability and the small size of the samples on which the reliability tests have been conducted: different sampling techniques and discrepancies in the samples may make it difficult to replicate the studies and therefore to extend the results to other contexts (Hagood, 2002; Betts, 2006).
In general, it can be stated that the incongruence in the research outcomes brought to a progressive delegitimization of drawings as potential assessment techniques and relegated their use to clinical practice or school contexts only (Hojonoski, Morrison, Brown & Matthews, 2006; LaRoque & Obrutz, 2006). However, the usefulness and importance of drawings in both the clinical practice and educational and school contexts seem to justify the need for a research focused on the identification of reliable variables for the coding of drawings.
Lastly, a paucity or researches investigating the Conjoint Family Drawing (CFD) has to be acknowledged, especially given the rich scientific production centering individual drawings. The Conjoint Drawing is one of the most innovative technique in the use of drawings and it represents an extremely interesting study and research object given the need for family assessment in the clinical and social field.
The administration of the CFD requires the simultaneous presence of all family members. The materials needed include: different colors markers and a 70X90cm white sheet. Each family member is asked to choose a marker that he/she will be using throughout the whole session. A table or a flat surface around which people can freely move is highly recommended; in case small children are involved the use of a carpet to lay the sheet on should be considered. The use of chairs or stools limit people's movements and prevent family members from approaching or distancing from each other and should therefore be avoided.
At the beginning of the administration, the researcher/clinician provide the following instructions: "I would like you all to use this sheet to draw a picture of your family doing something. You can now take some time to decide together what to draw".
Instructions are purposely generic and ambiguous and invite family members to take a shared decision on the picture to be drawn. The family is left a great freedom to decide and express themselves, the only condition being for each member to use the same marker throughout the drawing.
3. Research Question
The Conjoint Family Drawing (CFD) draws on Art Therapy (Kwiatkowska, 1967), the collaborative techniques used in family therapy (Smith, 1985) and, more specifically, on the work of Elizabeth Bing (1970). Up to today, the studies on the topic only tried to develop indicators allowing a clinical interpretation of the drawing and to underline the effectiveness of such technique in a clinical setting. For example, while working at the National Institute of Mental Health, the art therapist Kwiatkowska (cit. 1967) carried out an extremely interesting research aiming to analyze the artistic production of 47 families with children suffering from psychosis. In her article she states that the use of graphic instruments -both individual and conjoint- facilitates the communication if compared to the sole dialogue among family members. The author carried out a clinical analysis of the drawings, looking for possible connections between a member's psychopathology and family interaction models. A comparison between the various drawings showed that thinking patterns and interaction modalities are common to all family members and that the emotional climate within the family affects the graphic production of each member. In her paper the author describes the use and function of several graphic forms, such as scribbles, portraits, drawing of thoughts, etc...
On his side, Smith (1985) presented the collaborative drawing technique where family members take consecutive turns in drawing on the same sheet. The time given to each member to compete his/her drawing is given by the therapist and progressively reduced. Starting from an analysis of the drawings, the author identifies
the variables that might be useful to gain an understanding of family interactions: these are divided into indicators that concern the process and others that concern the final outcome. With regards to the process of making the drawing, the author finds it important to notice which members are able to follow the instructions and which, instead, are dismissing them, how the drawing unfolds (who, in the family, decides over the turns to be taken, who is preceding and following) and, lastly, how family members interact with their own drawing (completion, embellishment, disruption, help, etc...). In terms of the final outcome, importance is given to the use of space (the amount of space taken, the area of the sheet where each member places his/her drawing, the occupation of the center), the overall emotional impression instilled by the drawing (optimistic, conflictual, pessimistic ...) and the content (is there one single topic or multiple topics are present at the same time? Who decided the topic to be represented? Which informations from the contents represented? Etc..). Throughout the presentation of clinical vignettes, the author shows how each of the information given by the drawing might be relevant for the clinical work with the family as they allow to posit some hypotheses to be verified during the therapeutic process or with the use of other assessment instruments. Smith in fact underlines that the use of non verbal techniques allows to overcome problems or resistances connected to verbal communication while providing a unique access to profound dimensions, otherwise incommunicable through words.
In her article, Bing (1970) illustrated the Conjoint Family Drawing technique which she applied to 14 families that were assessed with this, as well as with other, methods. In her paper, the process and outcome variables allowing an understanding and evaluation of the drawing are presented. Among the process variables, the role played by each family member in the drawing organization as well as the order followed in taking turns assume particular relevance. When outcome variables are concerned, the author gives particular importance to the size of the characters, the choice of the family member(s) represented by each of the individuals involved, the isolation of one -or more- family members as well as the presence of unusual graphic contents. When each variable is presented, an explanation of the underlying psychological trait is also offered, together with the clinical information that can be gained through its analysis. In this paper, the author is making use of clinical vignettes to highlight the usefulness of the instrument in terms of diagnosis, therapy and research implications.
Starting from the observational and ethnographic theories, Brassac and Mietkiewicz (2010) conducted a recent study on the conjoint drawing making process. In this case particular relevance was given to communication (linguistic analysis of verbal exchanges) as well as to the analysis of intimations (both gestural and artifactual). The authors state that the graphic production expresses the subjective understanding and stances of the family being represented and that the interactive process between two members significantly affects the overall drawing.
The development of a set of variables that might be used in the interpretation of the CFD is also based on the influential work carried out by a group of clinicians and researchers working at the Athenaeum Center for Family Studies and Research at the Catholic University in Milan. These academics started employing the CFD for the study and therapy of families undergoing a divorce, the instrument was later applied also to other family typologies.
The scarce literature on conjoint drawings that was reported above, allows us to notice that its origin and use in clinical settings have deeply influenced the nature and type of variables developed for its understanding: these variables, in fact, draw substantially on the main theories of family therapy. However, no empirical evidence was ever provided on the actual congruence and suitability of such variables to the instrument being used. Mo reover, the various studies often make use of different variables and therefore the psychological constructs investigated vary according to the study. In this respect, a thoughtful analysis of the literature on family theories is key in order to develop a complete list of variables contemplating all the aspects observed during the conjoint drawing administration. The identification and systematization of objective and structured coding procedures are also much needed: a predefined trig would in fact allow both clinicians and researchers to use the CFD according to shared and agreed upon standards and procedures. This would also enable a comparison between the various studies using the conjoint drawing as well as guarantee the replicability of each study.
Lastly, the empirical identification of a set of variables allowing the researchers to differentiate and compare the drawings as well as to identify family typologies on the basis of their graphic productions is also extremely important. These progresses would not only facilitate the clinical assessment process, but would also make it possible to use large and heterogeneous samples in research studies.
4. Purpose of the Study
The aims of the present study are based on the few empirical researches on the Conjoint Family Drawing. In particular, the problems and the lack of empirical data on the use of drawings led to the definition of the following aims:
The definition of the set of variables to analyze the Conjoint Family Drawing. These variables emerge from an in-depth review of the literature on the topic. To this end, both the main theories on the study of families in clinical settings as well as the researches carried out in the last 80 years concerning the drawing of human figures and of the family have been considered.
The development of a coding grid, that while operationalizing the variables identified in the literature, allows a systematic, complete, objective and controlled analysis of the information emerging during the making of the drawing. This will allow a careful and complete analysis of all the elements contained in the drawing and will prevent this initial coding phase from being subject to the perceptive and cognitive biases that often characterize any destructured information collection process. This aim is extremely important as it will allow the replicability and comparability of any following study on the Family Conjoint Drawing.
The analysis of the variables discriminant capacity is key in order to understand the relevance and efficacy of each variables in the coding
’
grid.The last aim is connected to the possibility of obtaining a general evaluation of the CFD, that is to synthesize the main information contained in the drawing while appraising its overall quality. The individuation of family drawings that are maximally homogeneous within each one and maximally heterogeneous between them is an index of the instruments' capability of differentiating among families. The identification of a synthetic index for the evaluation of the CFD will allow a comparison between families experiencing different situations and, in case of single studies, it facilitates the integration with other assessment instruments in order to obtain a multidimensional and multi-method evaluation of family relations.
A thoughtful analysis of the literature on the topic led to the definition of a set of variables for the interpretation of the Conjoint Family Drawing. These variables keep into account both the theories on families and family relations as well as the available knowledge on drawings.
According to the principal theories and paradigms, families can be investigated on the basis of three different levels: individual, dyadic-relational and global -the whole family system-. These levels are interrelated to one another and, if considered together, allow a holistic understanding of all the aspects influencing the family. Starting from this perspective, the individual variables are based on psychodynamic interpretations of drawings as well as on some studies conducted on pictures tests, in particular those used for the assessment of personality traits. The variables that, instead, pertain to family dyads were developed on the basis of relational theoretical and clinical perspective on families. Among these latter, the relational-symbolic paradigm (Cigoli & Scabini, 2006), some assumptions of strategic and structural therapy (Minuchin, 1974) as well as the contextual (Boszormenyi-Nagy & Spark, 1988) and Boweninan (Bowen, 1978) therapy are worth a mention. Lastly, the global variables are based on Olson's circumflex model (1979), Gestalt theories (Spagnuolo Lobb, 2001), some instruments for the assessment of family relations like the Family Life Space-FLS (Gozzoli & Tamanza, 1998) as well as on Family Drawings (Fury, 1997; Burns e Kauffman, 1970; Bing, 1970).
As evidenced in the studies of Bing (1970); Smith (1985); Cigoli, Galimberti, Mombelli (1988); Brassac, Mietkiewicz, (2010), the empirical research on drawings shows that it allows to access to two information levels. The first level collects information on the graphic product created by family members on the basis of outcome variables. The information coded might pertain the single individual, a dyad or the whole family system.
The second level of information concerns the interactions between family members during the making of the drawing and it is assessed on the basis of process variables. The type and nature of such variable imply the presence of a silent observer or a fixed camera to record the behaviors of family members while performing the drawing. Like outcome variables, process variables collect information of single members, dyadic patterns or the overall family functioning.
Each variable identified according to different theoretical perspective has been operationalized in categories. The final coding grid (made of 10 outcome variables and 8 process variables) was then applied to an extensive sample of 117 Conjoint Family Drawings in order to check its usefulness and test its efficacy. In this respect the following analysis were performed:
The frequency distribution of each variable in order to assess non-application rates and the distribution of categories. This is the first criterion to assess variables’ validity: if a variable shows high non -application rates or an excessive saturation of one single category then it would be scarcely reliable and offer very little information;
A two-step cluster analysis, that allowed the identification of homogeneous groups of CFD and the subsequent recognition, within each group as well as between the various groups, of the categories that mostly affected the data aggregation;
The development of a synthetic measurement system of Conjoint Family Drawings. Such system was created by choosing and logically combing the most clinically significant and highly discriminant variables in the cluster analysis.
A non-probability, convenience approach was chosen for the selection of the 117 CFD composing the sample. The use of a non-probability sampling technique, however, does not constitute a serious limitation as the purposes of the study concern the preliminary evaluation of the usefulness and discriminant capacity of the coding grid developed to interpret family drawings.
The extension and structural heterogeneity of the sample prove to be sufficient in guaranteeing the reliability of the analyses. Almost half of the cases analyzed, in fact, were recruited in research contexts and therefore involve non-problematic families: within this non-clinical group, 27.4% of the families were Italian and 13.6% immigrants that have been living in Italy for at least two years. The remaining 59% of the families were recruited in clinical settings: either child custody evaluation (34.2% of the cases) or therapeutic treatments (24.8% of the cases).
Three people families, that is, families that have only one child, constitute the 43.6% of the sample, those having two children are the 47.9% of the sample, whereas 7.7% and 0.9% of the families have three and four children respectively. Fathers are between 26 and 60 years old ( M= 41 Ds=5,5) while mothers are between from 24 and 52 (M=38, Ds=5,1); children's age ranged from 4 to 22 (M=38, Ds=5,1). As far as gender distribution is concerned, the first child is a male in 50.9% of the cases and a female in the remaining 49.1% of the cases. Second children in our sample had a 55.7% chance of being males and a 44.3% of being females, third children were males in 37.5% of the cases and females in the remaining 62.5%.
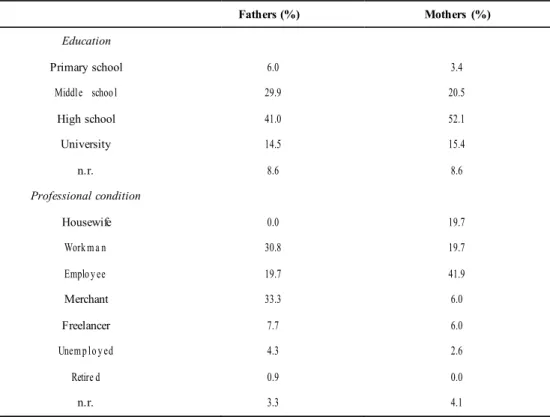
The parents' reported level of education and occupational condition (see Tab. 1) indicate a medium-high socio-cultural level, especially in terms of the mothers' education and socio-socio-cultural position.
Tab. 1 – Parents' socio-cultural characteristics
Fathers (%) Mothers (%) Education Primary school 6.0 3.4 Middle schoo l 29.9 20.5 High school 41.0 52.1 University 14.5 15.4 n.r. 8.6 8.6 Professional condition Housewife 0.0 19.7 Work m a n 30.8 19.7 Emplo y ee 19.7 41.9 Merchant 33.3 6.0 Freelancer 7.7 6.0 Unem p lo y ed 4.3 2.6 Retire d 0.9 0.0 n.r. 3.3 4.1 6. Findings
The Conjoint Family Drawing coding grid was applied to all the 117 drawings by two independent judges that were trained to the purpose. The judges, two clinical psychologists external to the research group, had different theoretical approaches (psychodynamic and cognitive). Interrater agreement was measured for all the variables using Cohen's K coefficient, a K value of .998 was obtained.
Such an outcome is extremely important in terms of the evaluation of the coding grid as it proves the clarity and non ambiguity of the meaning given to variables and coding categories. In conclusion, such a strong concordance between judges is a clear indication of the handiness and simplicity of the instrument.
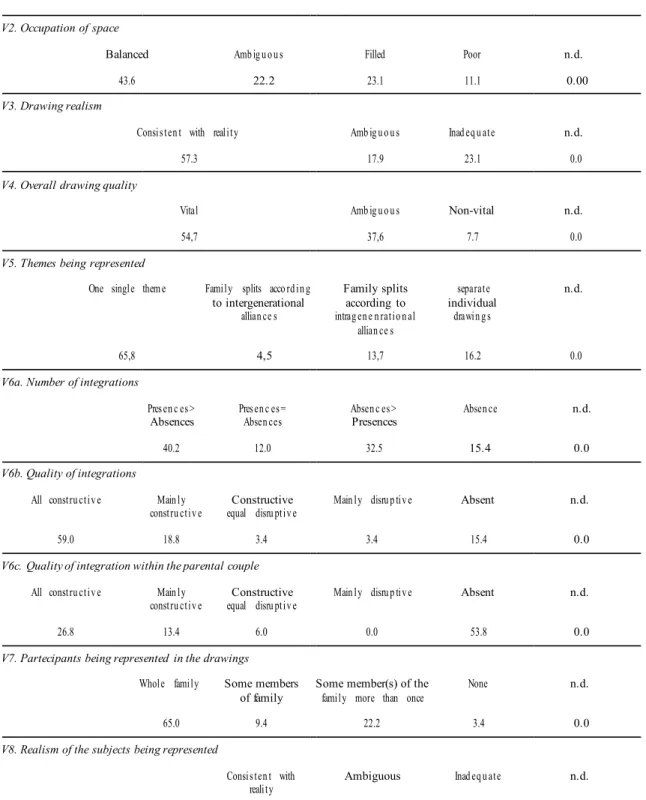
Another sign of the coding system adequacy was that the 117 CFDs were coded in all their parts and without any difficulty. As shown in the table below, in fact, none of the variables show absent or non-determinable values.
Almost all of the variables are equally distributed across the various categories while no polarization or relevant problems are observed: only two variables show a polarization higher than 70% and three variables have a frequency value that ranges from 60% to 70%. In this respect, it seems important to acknowledge that all the variables showing frequencies higher than 60% either measure constructs whose absence or problematic nature indicates a severe maladjustment in the family or in one of its members or are registered when the family does not comply with the instructions given by the researcher (see tab.2).
Tab. 2 – The variable for the analysis of the CFD and the categorical distribution of the answers
V2. Occupation of space
Balanced Amb ig u o u s Filled Poor n.d.
43.6
22.2 23.1 11.1 0.00
V3. Drawing realism
Consisten t with reality Amb ig u o u s Inad eq u ate n.d.
57.3
17.9 23.1 0.0
V4. Overall drawing quality
Vital
Amb ig u o u s Non-vital n.d.
54,7
37,6 7.7 0.0
V5. Themes being represented
One single them e Family splits acco rd in g Family splits separate n.d.
to intergenerational according to individual
allian ce s intrag en e n ratio n al drawin g s
allian ce s
65,8
4,5 13,7 16.2 0.0
V6a. Number of integrations
Presen c es>
Presen c es=
Absen c es> Absen ce n.d.
Absences Absen ces Presences
40.2
12.0 32.5 15.4 0.0
V6b. Quality of integrations
All constru ctiv e Main ly
Constructive
Main ly disru p tiv e Absent n.d.
constru ctiv e equal disru ptiv e
59.0 18.8
3.4 3.4 15.4 0.0
V6c. Quality of integration within the parental couple
All constru ctiv e Main ly
Constructive
Main ly disru p tiv e Absent n.d.
constru ctiv e equal disru ptiv e
26.8 13.4
6.0 0.0 53.8 0.0
V7. Partecipants being represented in the drawings
Whole family Some members Some member(s) of the None n.d.
of family family more than once
65.0
9.4 22.2 3.4 0.0
V8. Realism of the subjects being represented
Consisten t with
Ambiguous Inad eq u ate n.d.
72.6 19,7 4,3 0.0 V9. Characterization of the subjects being represented
Rich Adequate Amb iv a n t Poor n.d.
9.7 58.4 11,5 20.4 0.0
V10/V11. Symbols and deletions
Presen ce Absen ce n.d.
43.6 56.4 0.0
V12. Involvement
Whole family is Vertical alliances Horizo n tal allian ces Individuals are n.d.
involv e d between betwee n family mem b ers involv e d
memb e rs independently
from each other
31.6 17.9 6.8 43.6 0.0
V13. Decision time
Congruent Incon g ru e nt n.d.
58.1 41.9 0.0
V14. Decision making modality
Shared solutio n Negotiation of Passiv e accepta n ce Non-negotiated n.d.
conflict conflict
41.0 4.3 35.9 18.8 0.0
V15.Emotional climate
Acceptable levels Banalation, control, Anguish, numbness, n.d.
of anxiety - calm formalism lack of affectiveness
59.0 25.6 15.4 0.0
V16. Family movements
Dynam ic, Dishomogeneous, Hyperkinetic Static n.d.
participated chaotic
41.0 19.7 5.1 34.2 0.0
V. 17 Parental functions
Present Uncertain Absent Excessiv e n.d.
V17a. Father contains children 35.9 31 25.6 6.8 0.0
V17b. Father support children 49.6 34.2 14.5 1.7 0.0
V17a+b. Father’s function 41.9 33.3 17.9 6.8 0.0
V17c. Acknowledgment of fathers 65.8 29.1 5.1 0.0 0.0
V17e.Mother supports children 59.0 30.8 10.3 0.0 0.0
V17d+e. Mother’s function 53.0 29.9 17.1 0.0 0.0
V17f. Acknowledgment of mothers 73.5 24.8 1.7 0.0 0.0
V18.Intragenerational distinction 1: siblings
Diffe ren tiatio n Oscillation Indifferentiation Forced differentiation n.d.
58.8 33.8 5.9 1.5 0.0
V19.Intragenerational distinction 2: couple
Valorization Ambivalence Dep rec atio n n.d.
33.3 41.0 25.6 0.0
We can therefore state that the operationalization of the coding grid s variables allows a clear recognition of different fam ily drawings.
’
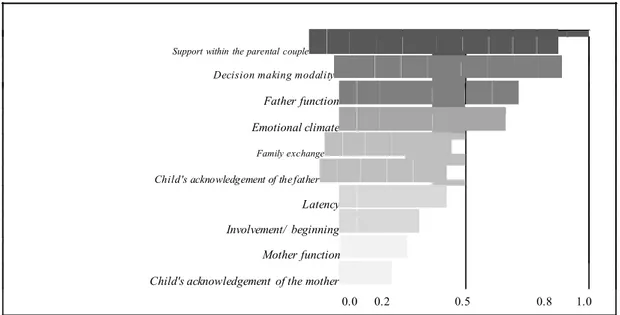
A cluster analysis was performed considering process and outcome variables separately as they produce complementary but rather different information. The analysis conducted on the 10 outcome variables of the coding grid automatically generated four different clusters, each presenting a good enough silhouette coefficient of cohesion and separation (0.2). The four clusters include 113 out of the 117 cases in the sample. The following figure shows the variables that were most discriminant in cluster analysis.
Figure 1 – The most relevant outcome variables in the cluster analysis
Number of integrations
Quality of integration
Drawing realism
Themes being represented
Overall representation quality
Occupation of space
Participants being represented
Realism of the subjects being represented
Chara cte riza tio n of the subjects being represen ted
Parental couple 's integration
Symbols/deletions
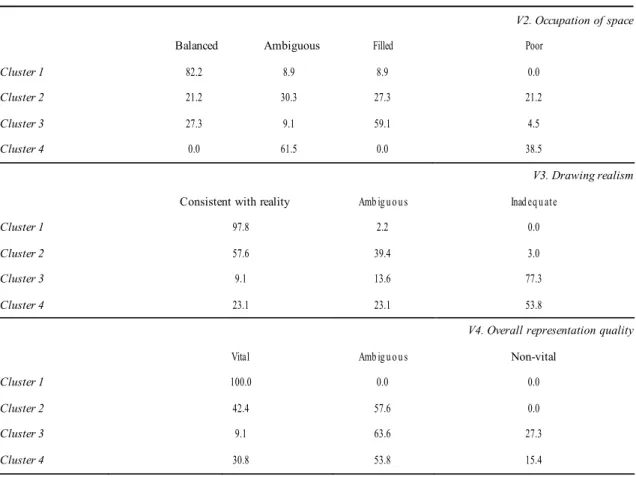
In the explanation of the cluster analysis outcomes (see tab.3), we will only refer to the 6 variables that scored above the cut-off threshold (0.5) and that, therefore, proved to play a role in the cluster formation.
The first cluster comprises 45 (39.8%) CFD and includes variables describing a functional and well structured drawing.
The second cluster includes 33 (29.2%) family drawings and contains very different drawings. Four of six discriminant variables, in fact, are distributed across all the coding categories and for this reason the cluster doesn t have a clear profile. The ambiguous and
contrasting aspects that characterize this cluster affect the relational
’
quality of such families. The two remaining variables, instead, suggest a very good functioning in the family. In particular these two variables concern global aspects of the drawing and show the ability of the family to adequately comply to the researcher instructions.The third cluster is formed by 22 (19.5%) CFD and in this case all the variables seem to be disfunctional. As clearly visible from a mere observation of the drawings, these products are disharmonious, fragmented, figurative contents show no vitality and family drawing is highly problematic.
13 (11.5%) CFD are comprised in the fourth cluster. The common trait to all the variables in this cluster is undoubtedly the total lack of integration between the various elements in the drawings associated to a strong prevalence of individual topics. These formal characteristics in the drawing suggest the presence of a structural separateness between family members. Each individual is given, and acknowledged, a separated space to make his/her own drawing and family members maintain a considerable distance from each other.
Tab. 3 – The frequency distribution of the six discriminant outcome variables in the four clusters
V2. Occupation of space
Balanced Ambiguous Filled Poor
Cluster 1 82.2 8.9 8.9 0.0
Cluster 2 21.2 30.3 27.3 21.2
Cluster 3 27.3 9.1 59.1 4.5
Cluster 4 0.0 61.5 0.0 38.5
V3. Drawing realism
Consistent with reality Amb ig u o u s Inad eq u ate
Cluster 1 97.8 2.2 0.0
Cluster 2 57.6 39.4 3.0
Cluster 3 9.1 13.6 77.3
Cluster 4 23.1 23.1 53.8
V4. Overall representation quality
Vital Amb ig u o u s Non-vital
Cluster 1 100.0 0.0 0.0
Cluster 2 42.4 57.6 0.0
Cluster 3 9.1 63.6 27.3
V5. Themes being represented
One single theme Family splits according to Family splits according Separate individual drawings
intergenerational alliances to intragenerational
alliances
Cluster 1 95.6 4.4 0.0 0.0
Cluster 2 75.8 18.2 6.1 0.0
Cluster 3 18.2 31.8 13.6 36.4
Cluster 4 23.1 0.0 0.0 76.9
V6a. Number of integrations
Presen ces> Presences=
Absences> Absence
Absences Absences Presences
Cluster 1 64.4 26.7 4.4 4.4
Cluster 2 39.4 6.1 48.5 6.1
Cluster 3 18.2 0.0 81.8 0.0
Cluster 4 0.0 0.0 0.0 100.0
V5c. Quality of integrations
Constructive Mainly constructive Constructive Mainly disruptive Absent
equal disruptive Cluster 1 80.0 13.3 2.2
0.0 4.4 Cluster 2 78.8 9.1 6.1
0.0 6.1 Cluster 3 31.8 45.5 4.5
18.2 0.0 Cluster 4 0.0 0.0 0.0
0.0 100.0
A two step cluster analysis was also performed on the process variables, that is, on the variables concerning the description of family interaction. Similarly to what happened before, the analysis led to the creation of four clusters with a silhouette coefficient of cohesion and separation equal to 0.2. Figure two shows the variables that were found to be discriminant for the formation of clusters.
Figure 2 – The most relevant process variables in the cluster analysis
Support within the parental couple
Decision making modality
Father function Emotional climate
Family exchange
Child's acknowledgement of the father
Latency Involvement/ beginning Mother function Child's acknowledgement of the mother
0.0 0.2 0.5 0.8 1.0
The four cluster are rather homogeneous, ranging from 36.8% of the largest to 12.0% of the smallest and include the whole sample (117 out of 117 cases).
Table 4 shows the frequency distribution of the categories to the five variables across the four groups emerged from the cluster analysis.
Tab. 4 – The frequency distribution of the five discriminant process variables in the cluster analysis
V14. Decisio n makin g moda lity
Shared solution Negotiation of Passive acceptance Non-negotiated conflict
conflict Cluster 1 83.7 9.3 7.0 0.0 Cluster 2 0.0 0.0 65.7 34.3 Cluster 3 4.0 0.0 64.0 32.0 Cluster 4 76.6 7.1 0.0 14.3 V15. Emotio n al clima te
Accep tab le levels of Banalization, control, formalism Anguish, numbness, lack of affectiveness
anxiety - calm
Cluster 1 95.3 4.7
0.0
Cluster 3 64.0 24.0 12.0
Cluster 4 71.4 28.6 0.0
V16. Family movement
Dynam ic, particip a ted Dishomogeneous, chaotic Hyperkinetic Static
Cluster 1 86.0 11.6 0.0 2.3
Cluster 2 11.4 22.9 14.3 51.4
Cluster 3 24.0 20.0 0.0 56.0
Cluster 4 7.1 35.7 7.1 50.0
V17ab. Father function
Present Uncertain Absent Excessive
Cluster 1 86.0 14.0 0.0 0.0
Cluster 2 20.0 28.6 28.6 22.9
Cluster 3 20.0 60.0 20.0 0.0
Cluster 4 0.0 57.1 17.9 6.8
V22. Intragenerational differentiation within the parenting couple
Valorization Ambivalence Deprecation
Cluster 1 79.1 18.6 2.3
Cluster 2 0.0 31.4 68.6
Cluster 3 20.0 72.0 8.0
Cluster 4 7.1 85.7 7.1
As it can be easily observed, the making of the drawings in the first cluster is functional. In the second cluster, instead, the interactive process is disturbed by a conflict that makes family relations non functional or strongly problematic.
The third and fourth clusters specific characteristics are less identifiable. In fact four of the five variables that play a major role in the clusters formation are the same in the two groups. Concerning the decision making process, the fifth variable was rather problematic in the third cluster (passive acceptance and avoidance) and functional (shared decision) in the fourth.
Moreover, if the five variables that did not reach the acceptability threshold are taken into consideration, two more variables are found to differentiate the two clusters from each other. Both these variables refer to the initial phase of the drawing and concern the language and the decision making time. Therefore, the difference between these two clusters seem to be greater at the beginning of the process, where family members are called to face both the uncertainty of being observed as well as the anxiety connected to having to perform a typical problem solving task.
As stated above, the development of a system able to calculate a synthetic score for the analysis of CFDs is based on the 11 variables (6 outcome and 5 process) that proved to be significant in the cluster formation as well as on the combination of the variables themselves.
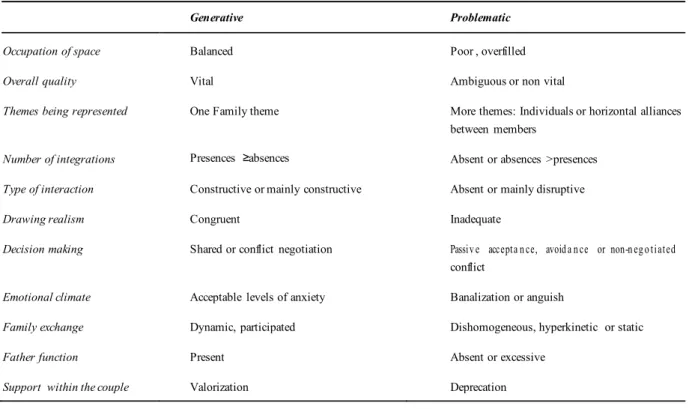
The cluster analyses performed on both the process and outcome variables led to the emergence of two clear and distinguishable functional and dysfunctional clusters. We than assume that these could be two of the drawing typologies that were named generative and problematic respectively (see table 5).
Tab. 5 – The typologies
Generative Problematic
Occupation of space Balanced Poor , overfilled
Overall quality Vital Ambiguous or non vital
Themes being represented One Family theme More themes: Individuals or horizontal alliances
between members
Number of integrations Presences ≥absences Absent or absences >presences
Type of interaction Constructive or mainly constructive Absent or mainly disruptive
Drawing realism Congruent Inadequate
Decision making Shared or conflict negotiation Passiv e accepta n ce, avoid a n ce or non-n eg o tiated
conflict
Emotional climate Acceptable levels of anxiety Banalization or anguish
Family exchange Dynamic, participated Dishomogeneous, hyperkinetic or static
Father function Present Absent or excessive
Support within the couple Valorization Deprecation
In order to produce typology that, far from being idealized, are as close as possible to reality, the generative typology was divided in two groupings (one corresponding to the best possible form of family functioning and the other to a sufficiently adequate functioning). For this reason, according to a prevalence criterion, 8 out of 11 is the minimum number of variables that have to be simultaneously satisfied for a case to be assigned either to functional or dysfunctional typology. In this way the family drawing that includes 8 functional (or dysfunctional) variables inevitably implies the presence of both outcome and process variables.
According to this logic, the rules to determine the appointment of single cases to these family typologies are the following:
for a case to be included in the optimal-generative typology, all the 11 variables need to be present according to the functional form;
for a case to be included in the sufficiently adequate typology, the functional variables need to be in between 8 and 10;
if 8 or more variables present dysfunctional form the case should be considered as belonging to the problematic profile;
Following the so-called intermediate functioning profiles, that are not functional nether dysfunctional, and that represent over a half of the cases in our sample, will be described.
The results of the preceding cluster analyses, that showed the qualitative relevance of some of the variables found in the CFDs, were used to define others typologies.
Contrasting, ambiguous as well as chaotic aspects characterized the first cluster. If ambiguity and the presence of contrasting variables are used to define and discriminate a certain set of drawings, they will be characterized by both generative as well as problematic variables. This means that a single case can be attributed to this typology if at least four generative and as many problematic variables are found simultaneously (as described above, the presence of less than 4 or more than 7 variables would in fact lead us to assign the case to either the problematic or the adequate configurations).
The cluster analysis also allowed us to outline a second typology characterized by the presence of ambivalence and deprecation within the parenting couple as well as by the ambiguous or frankly problematic position held by fathers (that were either absent or too present). Family members in this cluster, however, succeed in producing integrated and collaborative drawings. We can conclude that, in order to be included in the problematic parenting typology, a drawing should present the following characteristics:
ambivalence or deprecation within the couple relationship; ambiguous, absent or excessively present fathering figures;
good levels of integration in the graphic production (presences absences).
The third typology emerging from the cluster analysis is characterized by the lack of integration within the drawing, to the point that these family were referred to as separated. Inclusion criteria for a drawing to be attributed to this cluster are:
complete lack of integration with the parenting couple; individual involvement in task execution;
absence (or limited presence) of intergenerational integrationd.
Computing rules were applied to all the Conjoint Family Drawings
≥
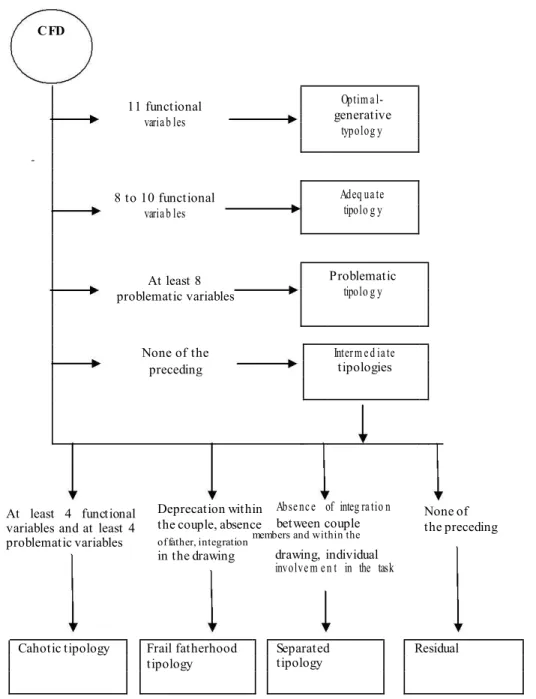
included in the intermediate category in order to determine whether clear and separate groups can be identified or, whether, on the contrary, some overlapping between groups is observed. Outcomes show that the computing rules set by researchers can be accepted: only two cases out of 64 (3.12%) are simultaneously present in more than one grouping.As shown in figure 3, the CFD synthetic evaluation system is configured as a logic-conditional path, in which a set of consecutive passages allow each drawing to be assigned to a given typology that, in turn, corresponds to a specific family interaction.
d The inclusion of a different variabl e, that was not part of the original 11 relevant variables was perceived as necessary in this case. In
fact, although this variable seems to have a rather limited discriminant value, its qualitative and clinical relevan ce within the present typological configuration appears to be key.
Fig. 3 The decision tree for the identification of family typologies
–
CFD
11 functional generativeOptim a l-
varia b les typolog y 8 to 10 functional Adeq ua te varia b les tipolo g y
At least 8 Problematic tipolo g y problematic variables
None of the Inter m e d ia te preceding tipologies
At least 4 functional variables and at least 4 problematic variables
Deprecation within Abse nc e of integ ra tio n the couple, absence between couple
of father, integration members and within the
in the drawing drawing, individual involve m e n t in the task
None of the preceding
Cahotic tipology Frail fatherhood Separated Residual tipology tipology
Lastly, the relationship between the various typologies and the characteristics of the families in our sample is examined.
Tab.6 – Bivariate analysis between typologies and the family characteristics
Italian Immigrant Child Costud y In treatment
Evalu a tio n Generative-optimal 18.2 12.5 15.0 0.0 Adequate 33.3 43.8 12.5 0.0 Cahotic 3.0 25.0 15.0 10.7 Prolematic parenting 15.2 0.0 30.0 14.3 Separated 15.2 0.0 7.5 25.0 Problematic 6.1 0.0 10.0 35.7 Residual 9.1 18.8 10.0 14.3 Total 100.0 100.0 100.0 100.0
The outcomes of this analysis clearly show a congruence between the typologies obtained through the CFD synthetic evaluation computing system and the characteristics of the families in our sample. More than half of the non-clinical families that were met in research contexts belong to the generative typology while only a small number of these families fall in the problematic typology. On the contrary, families that were recruited in therapeutic and clinical contexts show a high prevalence of problematic profiles and were never assigned to the generative group.
7. Conclusions
The Conjoint Family Drawing technique might represent and answer to the increasing need for family assessment tools in today's clinical settings. However, no empirical evidence was ever produced in terms of testing its actual potential as an assessment tool.
The present article aims at empirically validating the use of this instrument by providing a clear and defined coding grid as well as evaluating the discriminant validity of the various variables identified. Therefore, the paper tries to offer preliminary empirical evidences to support the use of Conjoint Family Drawings in both research and clinical settings.
Further studies involving representative samples of specific population segments are needed in order to confirm the discriminant ability of drawings. Moreover, comparative studies matching the outcomes obtained from the administration of the CFD with those from other assessment techniques might be extremely useful in proving its reliability and specificity.
8. References
Archer, R. P., Buffington-Vollum, J., Stredny, R. V., & Handel, R. W. (2006). A survey of psychological test use patterns among forensic psychologists. Journal of Personality Assessment, 87(1), 84-94. doi:http://dx.doi.org/10.1207/s15327752jpa8701_07
Artut, K. (2006). Art education theories and methods (5th ed.), Ani Publishing, Ankara.
Betts, D. J. (2006). Art therapy assessments and rating instruments: Do they measure up? The Arts in Psychotherapy, 33(5), 422-434. doi:http://dx.doi.org/10.1016/j.aip.2006.08.001
Bing, E., (1970). The Conjoint Family Drawing, Family Process, 9: 173-193.
Boszormenyi-Nagy, I., & Spark, G. M. (1973). Invisible loyalties: Reciprocity in intergenerational family therapy. Oxford, England: Harper & Row, Oxford. Retrieved from http://search.proquest.com/docview/615909085?accountid=9941
Bowen, M. (1978), Family therapy in clinical practice, Jason Aronson, Inc., New York.
Brassac, C., & Mietkiewicz, M. (2010). The joint production of the drawing of a family: An interactional story. Early Child Development and Care, 180(4), 475-487. doi:http://dx.doi.org/10.1080/03004430802066281
Burns, R. C., & Kaufm an, S. H. (1970). Kinetic family drawings (K-F-D): An introduction to understanding children through kinetic drawings. Oxford, England: Brunner/Mazel, Oxford. Retrieved from http://search.proquest.com/docview/615704672?accountid=9941 Cigoli, V., & Scabini, E., (2006). Family identity: Ties, symbols, and transitions. Mahwah, NJ, US: Lawrence Erlbaum Associates Publishers, Mahwah, NJ. Retrieved from http://search.proquest.com/docview/621210748?accountid=9941
Cigoli, V., Galimberti, C., & Mombelli, M., (1988), Il legame disperante, Raffaello Cortina, Milano.
Einarsdottir, J., Dockett, S., & Perry, B., (2009). Making meaning: Children's perspectives expressed through drawings. Early Child Development and Care, 179(2), 217-232. doi:http://dx.doi.org/10.1080/03004430802666999
Eitel, K., Szkura, L., & Pokorny, D., & Von Wietersheim, J., (2008), “Do you see what I see? A study about the interrater rel iability in art therapy”, Psychotherapy research, 18: 216-224.
Erickson, S. K., Lilienfeld, S. O., & Vitacco, M. J. (2007). A critical examination of the suitability and limitations of psychological tests in family court. Family Court Review, 45(2), 157-174. doi:http://dx.doi.org/10.1111/j.1744-1617.2007.00136.x
Freilich, R., & Shechtman, Z. (2010). The contribution of art therapy to the social, emotional, and academic adjustment of children with learning disabilities. The Arts in Psychotherapy, 37(2), 97-105. doi:http://dx.doi.org/10.1016/j.aip.2010.02.003
Fury, G., Carlson, E. A., & Sroufe, L. A. (1997). Children's representations of attachm ent relationships in family drawings. Child Development, 68(6), 1154-1164. Retrieved from http://search.proquest.com/docview/619312139?accountid=9941
Gantt, L., & Tabone, C., (1998). The Formal Elements Art Therapy Scale: The Rating Manual. Morgantown, WV: Gargoyle Press.
Garb, H. N., Lilienfeld, S. O., & Wood, J. M. (2004). Projective techniques and behavioral assessment. Hoboken, NJ, US: John Wiley & Sons Inc, Hoboken, NJ. Retrieved from http://search.proquest.com/docview/620358802?accountid=9941
Gozzoli, C., & Tamanza, G., (1998). Family Life Space. L’analisi metrica del disegno, FrancoAngeli, Milano.
Hagood, M. M. (2002). A correlational study of art-based measures of cognitive development: Clinical and research implications for art therapists working with children. Art Therapy, 19(2), 63-68. doi:http://dx.doi.org/10.1080/07421656.2002.10129342
Hojnoski, R. L., Morrison, R., Brown, M., & Matthews, W. J. (2006). Projective test use among school psychologists: A survey and critique. Journal of Psychoeducational Assessment, 24(2), 145-159. doi:http://dx.doi.org/10.1177/0734282906287828
Kwiatkowska, H. Y. (1967). The use of families' art productions for psychiatric evaluation. Bulletin of Art Therapy, 6(2), 52-72. Retrieved from http://search.proquest.com/docview/615491432?accountid=9941
LaRoque, S. D., & Obrzut, J. E. (2006). Pencil pressure and anxiety in drawings: A techno-projective approach. Journal of Psychoeducational Assessment, 24(4), 381-393. doi:http://dx.doi.org/10.1177/073428290628852
Lilienfeld, S. O., Wood, J. M., & Garb, H. N. (2000). The scientific status of projective techniques. Psychological Sci ence in the Public Interest, 1(2), 27-66. doi:http://dx.doi.org/10.1111/1529-1006.002
Matto, H. C., Naglieri, J. A., & Clausen, C. (2005). Validity of the draw-A-person: Screening procedure for emotional disturbance (DAP:SPED) in strengths-based assessment. Research on Social Work Practice, 15(1), 41-46. doi:http://dx.doi.org/10.1177/1049731504269553
Merrell, K. W. (2008). Helping students overcome depression and anxiety: A practical guide (2nd ed.). New York, NY, US: Guilford Press, New York, NY. Retrieved from http://search.proquest.com/docview/622132756?accountid=9941
Minuchin, S. (1974). Families & family therapy. Oxford, England: Harvard U. Press, Oxford. Retrieved from http://search.proquest.com/docview/615944993?accountid=9941
Naglieri, J. A., (1988). Draw-A-Person: A Quantitative Scoring System, The Psychological Corporation, San Antonio.
Olson, D. H., Sprenkle, D. H., & Russell, C. S. (1979). Circumplex model of marital and family systems: I. cohesion and adapt ability dimensions, family types, and clinical applications. Family Process, 18(1), 3-28. Retrieved from http://search.proquest.com/docview/616430729?accountid=9941
Oster, G. D., & Crone, P. G. (2004). Using drawings in assessment and therapy: A guide for mental health professionals (2nd ed.). New York, NY, US: Brunner-Routledge, New York, NY. Retrieved from http://search.proquest.com/docview/620532569?accountid=9941
Palmer, L., Farrar, A. R., Valle, M., Ghahary, N., Panella, M., & DeGraw, D. (2000). An investigation of the clinical use of the house-tree-person projective drawings in the psychological evaluation of child sexual abuse. Child Maltreatment, 5(2), 169-175. Retrieved from http://search.proquest.com/docview/619544225?accountid=9941
Smith, G. M. (1985). The collaborative drawing technique. Journal of Personality Assessment, 49(6), 582-585. Retrieved from http://search.proquest.com/docview/617144632?accountid=9941
Lobb, M. S. (2001). The theory of sel f in gest alt therapy: A restat ement of some aspects. Gestalt Review, 5(4), 276-288. Retrieved from http://search.proquest.com/docview/619833964?accountid=9941
Yamagat a, K. (2007). Differential emergence of representational systems: Drawings, letters, and numerals. Cognitive Development, 22(2), 244-257. doi:http://dx.doi.org/10.1016/j.cogdev.2006.10.006