DEMOGRAPHIC RESEARCH
A peer-reviewed, open-access journal of population sciences
DEMOGRAPHIC RESEARCH
VOLUME 42, ARTICLE 5, PAGES 133–148
PUBLISHED 21 JANUARY 2020
http://www.demographic-research.org/Volumes/Vol42/5/ DOI: 10.4054/DemRes.2020.42.5
Research Article
Traditional versus Facebook-based surveys:
Evaluation of biases in self-reported
demographic and psychometric information
Kyriaki Kalimeri
Mariano G. Beiro´
Andrea Bonanomi
Alessandro Rosina
Ciro Cattuto
This publication is part of the Special Collection on “Social Media and Demographic Research,” organized by Guest Editor Emilio Zagheni.
c
2020 Kalimeri, Beir´o, Bonanomi, Rosina & Cattuto. This open-access work is published under the terms of the Creative Commons Attribution 3.0 Germany (CC BY 3.0 DE), which permits use, reproduction, and distribution in any medium, provided the original author(s) and source are given credit.
1 Introduction 134
2 Experimental design 136
3 Results 137
3.1 Study 1: Population bias – platform 137
3.2 Study 2: Self-selection bias – recruitment 138
3.3 Study 3: Behavioural bias 138
4 Limitations 141
5 Conclusions and future directions 142
6 Acknowledgments 143
Traditional versus Facebook-based surveys: Evaluation of biases in
self-reported demographic and psychometric information
Kyriaki Kalimeri1 Mariano G. Beir´o2 Andrea Bonanomi3 Alessandro Rosina3 Ciro Cattuto4
Abstract
BACKGROUNDSocial media in scientific research offers a unique digital observatory of human be-haviours and hence great opportunities to conduct research at large scale, answering complex sociodemographic questions. We focus on the identification and assessment of biases in social-media-administered surveys.
OBJECTIVE
This study aims to shed light on population, self-selection, and behavioural biases, empir-ically comparing the consistency between self-reported information collected tradition-ally versus social-media-administered questionnaires, including demographic and psy-chometric attributes.
METHODS
We engaged a demographically representative cohort of young adults in Italy (approxi-mately 4,000 participants) in taking a traditionally administered online survey and then, after one year, we invited them to use our ad hoc Facebook application (988 accepted) where they filled in part of the initial survey. We assess the statistically significant dif-ferences indicating population, self-selection, and behavioural biases due to the different context in which the questionnaire is administered.
1Data Science Laboratory, ISI Foundation, Turin, Italy. Email:[email protected].
2Facultad de Ingenier´ıa, INTECIN (CONICET), CABA, Universidad de Buenos Aires, Buenos Aires,
Ar-gentina.
3Department of Statistical Science, Universit`a Cattolica del Sacro Cuore, Milan, Italy. 4Data Science Laboratory, ISI Foundation, Turin, Italy.
RESULTS
Our findings suggest that surveys administered on Facebook do not exhibit major biases with respect to traditionally administered surveys in terms of neither demographics nor personality traits. Loyalty, authority, and social binding values were higher in the Face-book platform, probably due to the platform’s intrinsic social character.
CONCLUSION
We conclude that Facebook apps are valid research tools for administering demographic and psychometric surveys, provided that the entailed biases are taken into consideration. CONTRIBUTION
We contribute to the characterisation of Facebook apps as a valid scientific tool to ad-minister demographic and psychometric surveys, and to the assessment of population, self-selection, and behavioural biases in the collected data.
1. Introduction
Social sciences are going through a revolution, in light of the immense possibilities that arise from the ability to observe real-world human behaviours via digital data, timely, and at a grander scale. Digital data offer rich, fine-grained individual information at a population level depicting a complementary view of the society (Lazer et al. 2009; Kalimeri et al. 2019a), especially when official records are sparse or unavailable. A rapidly growing body of research now employs social media data as a proxy to address challenging demographic research questions of a wide range of social issues. Topics may range from understanding migrants’ assimilation in society (Dubois et al. 2018) to tracking unemployment rates (Burke and Kraut 2013; Bonanomi et al. 2017; Llorente et al. 2015), or even to predicting the probability that a protest will turn violent (Mooijman et al. 2018).
In the demographic research field, many studies regularly rely on surveys to tackle the interplay between psychological well-being and societal issues (Parr 2010; Moor and Komter 2012; Bernardi and Kl¨arner 2014; Ho 2015; Teerawichitchainan, Knodel, and Pothisiri 2015; Morrison and Clark 2016). These are often administered to a scientifi-cally constructed sample of the population, however, high-quality survey data require a substantial investment of time, effort, and resources (Wilson, Gosling, and Graham 2012; Schober et al. 2016), especially in cases dealing with fast-evolving phenomena such as crisis response (Imran et al. 2015) and deployment of resources during health emergen-cies (Vespignani 2009). In addition to providing rich observational data, social media platforms can also act as surveying tools, adding to existing traditional practices (Snelson 2016). The vast potential of this approach was demonstrated when a Facebook-hosted
surveying application (FB-app hereafter) reached over four million users (Stillwell and Kosinski 2004). In line with this approach, Bonanomi et al. (2017), studied the phe-nomenon of youth unemployment – and in particular, the NEET (not in education, em-ployment, or training) community – while Kalimeri et al. (2019b) analysed the attitudes, behaviours, and opinion formation towards vaccination. Both studies administered psy-chologically validated questionnaires via FB-apps.
There are indisputable benefits of such approaches, ranging from the possibility to rapidly reach out to populations previously unavailable (Pew Research Center 2018), complementing the traditional data sources in a cost-effective way (Murphy, Hill, and Dean 2014; Adler et al. 2019). However, and despite their enormous potential, social media data come with their own biases and limitations (Reips 2002; Pew Research Cen-ter 2018; Ara´ujo et al. 2017). Olteanu et al. (2016) provided an in-depth survey on the methodological limitations and pitfalls in social media studies, that are often over-looked. Well-studied data quality issues common to all social media platforms include sparsity (Baeza-Yates 2013), representativity (Ruths and Pfeffer 2014), and noise (Sal-ganik 2017), but also include biases regarding data samples (Tufekci 2014; Metaxas, Mustafaraj, and Gayo-Avello 2011) and content (Wu et al. 2011; Baeza-Yates 2018). When social media platforms are employed as surveying tools, the entailed biases are even more challenging to define and quantify; for instance, the psychological predisposi-tion towards a specific form of social media. The existing studies on biases focus mainly on representativity aspects compared to census data (Schober et al. 2016), or on the con-sistency of survey data obtained via crowdsourcing platforms (Law et al. 2017). Still, no studies are assessing the consistency of surveys administered in a traditional online mode versus social media platforms.
In line with the scheme proposed by the total error framework (Sen et al. 2019), we place the focal point on three types of biases – namely, population, self-selection, and behavioural – following a straightforward experimental scenario. Initially, a survey was administered in a traditional online manner. Subsequently, after approximately one year, the same cohort was invited to use an ad hoc FB-app. The core contribution of this study is a systematic assessment of biases that may be entailed in data obtained from social-media-administered surveys, and in particular on the Facebook platform. We focus not only on demographic differences that might be more expected but also on psychological biases due to the nature of the conveyed surveys. Here we operationalise the psychome-tric constructs in terms of personality traits and moral values. Our findings suggest that Facebook is indeed a valid research tool to administer social and psychometric research surveys; nonetheless, its not entirely neutral character should be taken into consideration.
2. Experimental design
Our experimental design consists of two phases. In the first phase, we engaged a probability-based and demographically representative cohort of the youth population in Italy. The cohort originated from a nationwide project launched in 2015 – the ‘Rapporto Giovani’ – which focuses on youth-related issues (age range 18 to 33 years, average 25.7 ± 4.7, N = 9.358) carried out by Istituto Giuseppe Toniolo di Studi Superiori (2017). We invited par-ticipants via email to fill in an initial survey, administered following a CAWI (computer-assisted web interviewing) methodology. This survey consisted of demographic ques-tions and two validated psychometric questionnaires, namely, the five-factor inventory (Big5, hereafter) (Gosling, Rentfrow, and Swann 2003; Costa Jr and McCrae 1992) for personality and the moral foundations theory (MFT, hereafter) (Haidt and Joseph 2004) for morality assessment. In the second phase – approximately one year after the initial survey – the cohort received an email invitation to access our ad hoc FB-app, accessi-ble atlikeyouth.org, that among other functions, administered the same Big5 and MFT psychometric questionnaires (Bonanomi et al. 2018). A consent form was obtained in terms of a privacy agreement which the participants declared to accept upon registration. Our experimental design is postulated in three studies, where we assess the differences in:
• Study 1: Population bias – platform
Demographics and psychometric attributes between the population of users who maintain a Facebook profile against those who do not.
• Study 2: Self-selection bias – recruitment
Demographics and psychometric attributes between the population of users who accepted to participate in the FB-app and those who did not.
• Study 3: Behavioural bias
User behaviour across platforms; here, the comparison is made on the psychometric self-assessments in the traditional survey versus those given through the Facebook-administered survey.
Since our data include both categorical and ordinal attributes, we employed the Mann-Whitney U nonparametric statistical test to compare the populations in question for Studies 1 and 2. The effect size is estimated as d = mn2U − 1, where n and m represent the population sizes and U is the Mann-Whitney U statistic (Cliff 1993). We consider any ef-fect size with magnitude d as ‘negligible’ if |d| < 0.147, ‘small’ if |d| < 0.33, ‘medium’ if |d| < 0.474 and ‘large’ otherwise, according to the interpretation intervals suggested by (Romano et al. 2006). The Wilcoxon signed-rank nonparametric test (Wilcoxon 1946) was used to test differences of paired data in Study 3. The choice of the test was based on the fact that the assumption of normal distribution of the differences, required for the
paired t-test, is not satisfied for all the psychometric attributes. The effect size here is estimated according to the simple difference formula proposed by Kerby (2014).
3. Results
The traditionally administered survey was filled in by 6,380 participants. To improve the data quality, we excluded from the study those participants who either (1) gave identical responses to both Big5 and MFT individual questionnaire items, or (2) gave mistaken responses in the two quality control questions. After this preprocessing step, we excluded approximately 34% of the participants. The remaining 4,239 individuals became our initial cohort (see Table 2). After our email invitation approximately one year after the initial survey, about 76% of the initial cohort (denoted as the traditional cohort hereafter) did not log into the FB-app. The remaining 23% of the initial cohort did log into the application and are denoted as the FB cohort hereafter.
Table 2 reports the statistics on the two populations along with their demographic characteristics. All analysis is performed in Python Rossum (1995). Data and source code are available online at https://osf.io/gx7df/. For each demographic attribute, we compared the traditional and FB cohorts against the initial cohort. No significant differences emerged for any of the attributes, providing evidence that both the traditional and the FB cohorts are demographically representative subsets of the initial cohort with respect to age, gender, employment, and educational level.
3.1 Study 1: Population bias – platform
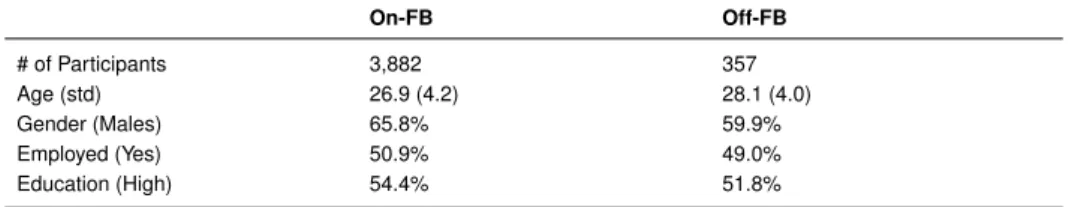
We denote the participants who declare to maintain a Facebook profile as ‘On-FB’ and those who do not as ‘Off-FB’. Table 1 reports the total number of participants in both populations as well as their demographic information. We compared the two popula-tions, On-FB and Off-FB, according to the self-reported information they provided in the initial survey regarding their demographic and psychometric attributes. The outcome of the test showed a small difference in the age of the two cohorts, with the FB cohort rep-resenting a slightly younger population (p-value < 0.001 and |d| < 0.17), but no other difference in demographic attributes was pointed out (see Table 1). Regarding person-ality and moral traits, we observe that participants without a Facebook profile were less extroverted (p-value < 0.001, |d| < 0.14) with minor differences also present in other traits, as for example, their lower level of openness to new experiences (p-value < 0.001, |d| < 0.1). At the same time Off-FB participants appear to be more conscientious (p-value < 0.001, |d| < 0.1) and more neurotic (p-(p-value < 0.01, |d| < 0.1) (see Table 3). Despite the limited size of the Off-FB sample – only 8.4% of the cohort claimed not to
have a Facebook profile – these differences are statistically significant and hence, should be considered. No significant differences were found for the moral domain attributes.
3.2 Study 2: Self-selection bias – recruitment
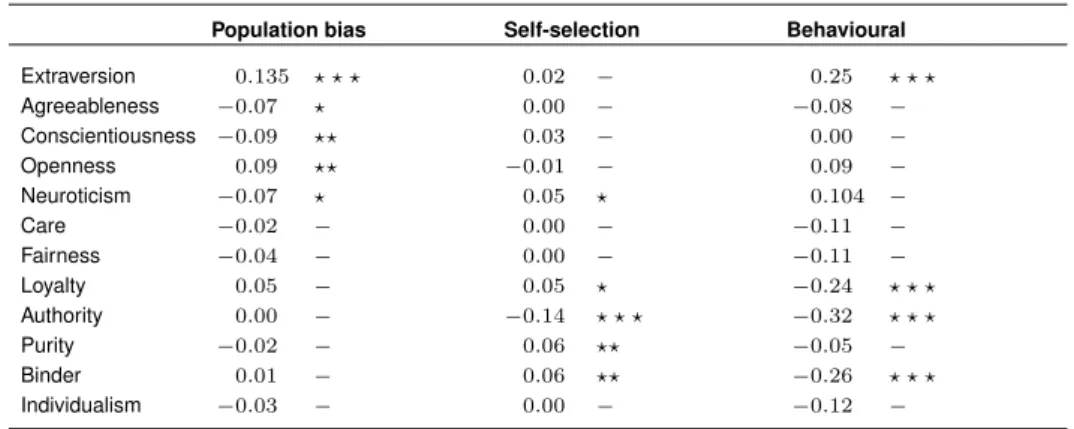
To assess the self-selection biases in the recruitment phase, we compared the demo-graphic and psychometric attributes of the participants in the traditional cohort against those in the FB cohort. To avoid any confounding factors introduced by the platform, we compared the responses obtained from the initial survey for both groups. The Mann-Whitney U test did not show any significant differences, neither for the demographic attributes (see Table 1) nor for the Big5 personality traits (see Table 3). Instead, small differences in purity (p-value < 0.001, |d| < 0.06), loyalty (p-value < 0.01, |d| < 0.09) and binding (p-value < 0.001, |d| < 0.06) values emerged (see Table 3).
3.3 Study 3: Behavioural bias
Finally, we focused on behavioural biases due to self-reporting; to do so, we compared the participants’ responses in the traditional survey against their responses on the Facebook administered survey. The Wilcoxon signed-ranks test showed that when responding in the FB-app, the median scores were statistically significantly higher than the median scores obtained in the traditional survey for the attributes of authority, loyalty, and social binding. Participants judged themselves as slightly more authoritarian (p-value < 0.001, r = −0.32) and loyal (p-value < 0.001, r = −0.24) (Table 3). They also claimed to value more social binding principles (p-value < 0.001, r = −0.26). These latter findings may be due to Facebook’s intrinsic social character.
Moving from a population to the individual scale, we assessed the within-subject variability between the traditional and the FB-app survey. For each psychometric at-tribute, we estimated the Kendall’s tau correlation values obtained from the individual responses in the traditional and the respective Facebook survey. Then, we randomly shuffled the answers of all participants in the traditional and FB cohorts 1,000 times and computed the Kendall’s tau correlation value each time. The mean and standard deviation of the bootstrapped distributions are reported in Table 4 for the personality and morality attributes, respectively. The correlations between the two surveys lie at an intermediate range (from 0.3 to 0.55) but are significantly higher than for the null model (see Table 4). This supports the idea that there is good consistency in self-reporting.
Table 1: Descriptive statistics of the population that declared to maintain a Facebook profile (On-FB) and the one that does not (Off-FB)
On-FB Off-FB # of Participants 3,882 357 Age (std) 26.9 (4.2) 28.1 (4.0) Gender (Males) 65.8% 59.9% Employed (Yes) 50.9% 49.0% Education (High) 54.4% 51.8%
Note: We compare the following demographic information of the two cohorts: (1) population, (2) age, (3) gender distribution, (4) employment, and (5) educational level, reporting the percentage of participants who pursue or have a university degree. A Mann-Whitney U test on the two cohorts pointed out only the age difference as statistically significant withp < 0.001 and small effect size |d| < 0.17.
Table 2: Population size for the initial cohort as well as its two subsets, participants who filled in the online survey but chose not to enter the FB-app (traditional), and those who filled in the online survey and then participated also in the Facebook-administered survey (FB) Initial Traditional FB Population 4,239 3,251 956 Age (std) 27.0 (4.2) 27.1 (4.3) 26.9 (4.2) Gender (Males) 65.3% 64.3% 65.8% Employed (Yes) 50.8% 50.4% 50.9% Education (High) 54.1% 55.2% 54.4%
Note: For the three cohorts we present a comparison of the basic demographic information in terms of population, average and standard deviation of age, gender distribution of the population in terms of the percentage of male par-ticipants, the percentage of the population who are employed, and the level of education referring to the percentage of participants who have a university degree of any level or are enrolled in the university. Mann-Whitney U tests on all variables did not detect any statistically significant differences.
Table 3: Effect sizes and statistical significance for the Big5 and MFT attributes
Population bias Self-selection Behavioural
Extraversion 0.135 ? ? ? 0.02 − 0.25 ? ? ? Agreeableness −0.07 ? 0.00 − −0.08 − Conscientiousness −0.09 ?? 0.03 − 0.00 − Openness 0.09 ?? −0.01 − 0.09 − Neuroticism −0.07 ? 0.05 ? 0.104 − Care −0.02 − 0.00 − −0.11 − Fairness −0.04 − 0.00 − −0.11 − Loyalty 0.05 − 0.05 ? −0.24 ? ? ? Authority 0.00 − −0.14 ? ? ? −0.32 ? ? ? Purity −0.02 − 0.06 ?? −0.05 − Binder 0.01 − 0.06 ?? −0.26 ? ? ? Individualism −0.03 − 0.00 − −0.12 −
Note: Assessing: (1) population bias of the platform, comparing those who maintain a Facebook profile against those who did not (Mann-Whitney U), (2) self-selection bias due to recruitment, comparing those who participated in the survey but did not access the FB-app against those who accessed the application (Mann-Whitney U), (3) behavioural bias due to within-individual variability, the comparison is made between the responses to the traditional survey and those given to the Facebook-administered survey (Wilcoxon signed-ranks). The effect size is reported in terms of d-Cliff for the Mann-Whitney U test and with the simple difference formula for the Wilcoxon signed-ranks. The null hypothesis represents that both distributions are similar. A positive sign means that the median of the first population is higher than that of the second population. Note that ‘? ? ?’ a p-value < 0.001,‘??’ a p-value < 0.01, ‘?’ a p-value < 0.05, and ‘−’ indicates no statistical significance observed.
Table 4: Individual self-consistency of personality traits (Big5) and moral dimensions (MFT) reporting evaluated by means of Kendall’s tau correlation between an individual’s responses on the traditional survey and on Facebook
Correlation Bootstrapping Mean (STD)
Extraversion 0.53 ? ? ? 0.000 (0.03) Agreeableness 0.42 ? ? ? 0.000 (0.03) Conscientiousness 0.52 ? ? ? 0.000 (0.03) Openness 0.50 ? ? ? 0.000 (0.03) Neuroticism 0.52 ? ? ? 0.000 (0.03) Care 0.43 ? ? ? −0.001 (0.03) Fairness 0.30 ? ? ? −0.001 (0.03) Loyalty 0.44 ? ? ? 0.000 (0.03) Authority 0.41 ? ? ? −0.001 (0.03) Purity 0.40 ? ? ? 0.000 (0.03) Binder 0.46 ? ? ? 0.000 (0.03) Individualism 0.38 ? ? ? 0.000 (0.03)
Note: We report the median and interquartile range of the Kendall’s tau correlation values obtained when we shuffle the responses in the traditional and FB cohorts for all the individuals 1,000 times. The difference between the actual correlation value and the randomised experiment sustains the claim for self-consistency between traditional and Facebook-administered surveys. Note that, ‘? ? ?’ indicates p-value < 0.001.
4. Limitations
Understandably, this study entails a series of limitations; first and foremost, our sample is from a young population in Italy. Apart from the geographical and cultural effect, young people are more at ease with sharing their private information (Anderson and Rainie 2010; Burkell et al. 2014; Kezer et al. 2016). At the same time, since they have already par-ticipated in a traditional survey, they are accustomed to taking questionnaires regarding their personal and demographic attributes. Since our initial cohort is representative of the Italian youth and the recruited population on Facebook closely follows the same demo-graphic characteristics, we claim that a participant that is recruited on Facebook follows the demographics of the population under investigation. We are able to make claims only about the people that are part of our cohort though, and we cannot draw conclusions on the average Facebook user, who does not fall under the scope of this study. Given the limited size of our cohort (approximately 4,000 participants), our findings are to be inter-preted with caution. Moreover, we acknowledge that the initial survey might be subject to the same methodological biases of every survey (Groves and Lyberg 2010; Olteanu et al. 2016), which, are beyond our control; the same holds for the recruitment and the follow-up survey.
5. Conclusions and future directions
Since the 2000s, the massification of the internet has brought significant advantages to the collection of research data, in terms of enrichment and diversity of data, while at the same time reducing the research costs. Social sciences are shifting into employing social media as both behavioural proxies and surveying tools, complementing existing practices and providing new insights into complex societal questions. The core contribution of this study is the systematic assessment of biases entailed in data obtained from surveys administered on social media platforms and in particular Facebook.We focused on differ-ences in demographic and psychometric attributes that might indicate (1) population, (2) self-selection in the recruitment phase; and (3) behavioural biases.
The major shortcoming of this study is the limited size of our cohort (4,000 people on the initial survey and 988 people on the FB survey), and the focus on a specific geographic location and age range. Given this limitation, our findings suggest that the population that chose not to proceed to the Facebook-administered survey does not exhibit major deviations with respect to the population of the traditionally managed survey in terms of neither demographics nor psychometric attributes. Consequently, we conclude that this evidence supports the claim that self-selection biases of the Facebook platform are negligible.
Conversely, when carrying out surveys on Facebook, population and behavioural biases are to be taken into account. In terms of population biases, when we analysed the personality traits (Big5) of the sample that declared not to maintain a Facebook pro-file, we found these participants to be more introverted, conscientious, and neurotic than those who do use Facebook. Regarding behavioural biases, some small, yet statistically significant, behavioural differences emerged between the responses in the traditional and the Facebook-administered surveys. When on Facebook, participants rated themselves as more loyal, authoritative, and more fond of social binding values, which may indicate that engaging in a social media platform like Facebook affects the individuals’ behaviour reflected by their self-reporting.
This study contributes to the limited body of research on this arising issue, with an empirical assessment on population, self-selection, and behavioural biases present in surveys administered on social media. The results obtained from Facebook-administered surveys are similar to those of the traditional surveys in terms of basic demographic and psychometric attributes. Moreover, given the cost-effectiveness of the platform, such sur-veying approaches can supplement the traditional demographic and sociological practices in addressing research questions in a more timely manner and on a grander scale. Keep-ing in mind the limitations of our study and the observed biases, our findKeep-ings suggest that the Facebook platform can be employed as a potent research tool to administer social and psychometric research surveys; because the character of the Facebook platform is not entirely neutral.
6. Acknowledgments
KK and CC gratefully acknowledge support from the Lagrange Project of the ISI Founda-tion funded by the CRT FoundaFounda-tion. AR and AB gratefully acknowledge Istituto Toniolo and Fondazione Cariplo for support to the project. We are grateful to Dr Luca Rossi for the helpful discussions.
References
Adler, N., Cattuto, C., Kalimeri, K., Paolotti, D., Tizzoni, M., Verhulst, S., Yom-Tov, E., and Young, A. (2019). How search engine data enhance the understanding of de-terminants of suicide in india and inform prevention: Observational study. Journal of Medical Internet Research21(1): e10179. doi:10.2196/10179.
Anderson, J. and Rainie, L. (2010). Millennials will make online sharing in networks a lifelong habit. Washington, D.C.: Pew Research.
Ara´ujo, M., Mejova, Y., Weber, I., and Benevenuto, F. (2017). Using Facebook ads audiences for global lifestyle disease surveillance: Promises and limitations. Paper presented at the 2017 ACM on Web Science Conference, New York, USA, June 21– 23, 2017.
Baeza-Yates, R. (2013). Big data or right data? Paper presented at the 7th Al-bertao Mendelzon International Workshop on Foundations of Data Management, Puebla/Cholula, Mexico, May 21–23, 2013.
Baeza-Yates, R. (2018). Bias on the web. Communications of the ACM 61(6): 54–61.
doi:10.1145/3209581.
Bernardi, L. and Kl¨arner, A. (2014). Social networks and fertility. Demographic Research 30(22): 641–670.doi:10.4054/DemRes.2014.30.22.
Bonanomi, A., Rosina, A., Cattuto, C., and Kalimeri, K. (2017). Understanding youth unemployment in Italy via social media data. Paper presented at the 28thIUSSP
Inter-national Population Conference, Cape Town, South Africa, October 29 – November 3, 2017.
Bonanomi, A., Rosina, A., Cattuto, C., and Kalimeri, K. (2018). Social media data per lo studio della disoccupazione giovanile italiana: Il progetto likeyouth .
Burke, M. and Kraut, R. (2013). Using Facebook after losing a job: Differential ben-efits of strong and weak ties. Paper presented at the 2013 Conference on Computer Supported Cooperative Work, San Antonio, United States, February 23–27, 2013.
doi:10.1145/2441776.2441936.
Burkell, J., Fortier, A., Wong, L.L.Y.C., and Simpson, J.L. (2014). Facebook: Public space, or private space? Information, Communication and Society 17(8): 974–985.
doi:10.1080/1369118X.2013.870591.
Cliff, N. (1993). Dominance statistics: Ordinal analyses to answer ordinal questions. Psychological Bulletin114(3): 494–509.doi:10.1037//0033-2909.114.3.494.
relevance to personality disorders. Journal of Personality Disorders 6(4): 343–359.
doi:10.1521/pedi.1992.6.4.343.
Dubois, A., Zagheni, E., Garimella, K., and Weber, I. (2018). Studying migrant assimi-lation through Facebook interests. Paper presented at the International Conference on Social Informatics, St. Petersburg, Russia, September 25–28, 2018. doi:10.1007/978-3-030-01159-8 5.
Gosling, S.D., Rentfrow, P.J., and Swann, W.B. (2003). A very brief measure of the big-five personality domains. Journal of Research in Personality 37(6): 504–528.
doi:10.1016/S0092-6566(03)00046-1.
Groves, R.M. and Lyberg, L. (2010). Total survey error: Past, present, and future. Public Opinion Quarterly74(5): 849–879. doi:10.1093/poq/nfq065.
Haidt, J. and Joseph, C. (2004). Intuitive ethics: How innately prepared intuitions generate culturally variable virtues. Daedalus 133(4): 55–66.
doi:10.1162/0011526042365555.
Ho, J.H. (2015). The problem group? Psychological wellbeing of unmarried people living alone in the Republic of Korea. Demographic Research 32(47): 1299–1328.
doi:10.4054/DemRes.2015.32.47.
Imran, M., Castillo, C., Diaz, F., and Vieweg, S. (2015). Processing social media mes-sages in mass emergency: A survey. ACM Computing Surveys (CSUR) 47(4): 67.
doi:10.1145/2771588.
Istituto Giuseppe Toniolo di Studi Superiori (2017). La condizione giovanile in Italia. Rapporto Giovani.Bologna: Il Mulino.
Kalimeri, K., Beir´o, M.G., Delfino, M., Raleigh, R., and Cattuto, C. (2019a). Predicting demographics, moral foundations, and human values from digital behaviours. Com-puters in Human Behavior92: 428–445.doi:10.1016/j.chb.2018.11.024.
Kalimeri, K., G. Beir´o, M., Urbinati, A., Bonanomi, A., Rosina, A., and Cattuto, C. (2019b). Human values and attitudes towards vaccination in social media. Paper presented at The 2019 World Wide Web Conference, New York, United States, May 13–17, 2019. doi:10.1145/3308560.3316489.
Kerby, D.S. (2014). The simple difference formula: An approach to teaching nonpara-metric correlation. Comprehensive Psychology 3: 11–IT.doi:10.2466/11.IT.3.1. Kezer, M., Sevi, B., Cemalcilar, Z., and Baruh, L. (2016). Age differences in privacy
attitudes, literacy and privacy management on Facebook. Cyberpsychology: Journal of Psychosocial Research on Cyberspace10(1). doi:10.5817/CP2016-1-2.
as a tool for research: Implications of uncertainty. Paper presented at the 2017 ACM Conference on Computer Supported Cooperative Work and Social Computing, Oregon, United States, February 25 – March 1, 2017. doi:10.1145/2998181.2998197.
Lazer, D., Pentland, A.S., Adamic, L., Aral, S., Barabasi, A.L., Brewer, D., Christakis, N., Contractor, N., Fowler, J., Gutmann, M., and King, G. (2009). Life in the network: The coming age of computational social science. Science (New York, N.Y.) 323(5915): 721–723.doi:10.1126/science.1167742.
Llorente, A., Garcia-Herranz, M., Cebrian, M., and Moro, E. (2015). Social media finger-prints of unemployment. PLOS ONE 10(5): 1–13.doi:10.1371/journal.pone.0128692. Metaxas, P.T., Mustafaraj, E., and Gayo-Avello, D. (2011). How (not) to pre-dict elections. Paper presented at the 2011 IEEE Third Inernational Conference on Social Computing (SocialCom), Boston, United States, October 9–11, 2011.
doi:10.1109/PASSAT/SocialCom.2011.98.
Mooijman, M., Hoover, J., Lin, Y., Ji, H., and Dehghani, M. (2018). Moralization in so-cial networks and the emergence of violence during protests. Nature Human Behaviour 1–389.doi:10.1038/s41562-018-0353-0.
Moor, N. and Komter, A. (2012). Family ties and depressive mood in Eastern and Western Europe. Demographic Research 27(8): 201–232.doi:10.4054/DemRes.2012.27.8. Morrison, P.S. and Clark, W.A. (2016). Loss aversion and duration of residence.
Demo-graphic Research35(36): 1079–1100.doi:10.4054/DemRes.2016.35.36.
Murphy, J., Hill, C.A., and Dean, E. (2014). Social media, sociality and survey research. Hoboken: Wiley Online Library.
Olteanu, A., Castillo, C., Diaz, F., and Kiciman, E. (2016). Social data: Biases, method-ological pitfalls, and ethical boundaries 2: 13.doi:10.2139/ssrn.2886526.
Parr, N. (2010). Satisfaction with life as an antecedent of fertility: Partner + happiness = children? Demographic Research 22(21): 635–662.doi:10.4054/DemRes.2010.22.21. Reips, U.D. (2002). Standards for internet-based experimenting. Experimental
Psychol-ogy49(4): 243–256.
Romano, J., Kromrey, J., Coraggio, J., and Skowronek, J. (2006). Appropriate statistics for ordinal level data: Should we really be using t-test and Cohen’s d for evaluating group differences on the NSSE and other surveys? Paper presented at the annual meeting of the Florida Association of Institutional Research, Cocoa Beach, United States,, 2006.
Rossum, G. (1995). Python reference manual. Amsterdam: Centre for Mathematics and Computer Science.
Ruths, D. and Pfeffer, J. (2014). Social media for large studies of behavior. Science 346(6213): 1063–1064.doi:10.1126/science.346.6213.1063.
Salganik, M.J. (2017). Bit by bit: Social research in the digital age. Princeton: Princeton University Press.
Schober, M.F., Pasek, J., Guggenheim, L., Lampe, C., and Conrad, F.G. (2016). Social media analyses for social measurement. Public Opinion Quarterly 80(1): 180–211.
doi:10.1093/poq/nfv048.
Sen, I., Floeck, F., Weller, K., Weiss, B., and Wagner, C. (2019). A total error framework for digital traces of humans. arXiv preprint arXiv:1907.08228 .
Snelson, C.L. (2016). Qualitative and mixed methods social media research: A review of the literature. International Journal of Qualitative Methods 15(1).
doi:10.1177/1609406915624574.
Stillwell, D.J. and Kosinski, M. (2004). mypersonality project: Example of successful utilization of online social networks for large-scale social research. American Psychol-ogist59(2): 93–104.
Teerawichitchainan, B.P., Knodel, J., and Pothisiri, W. (2015). What does living alone really mean for older persons? A comparative study of Myanmar, Vietnam, and Thai-land. Demographic Research 32(48): 1329–1360.doi:10.4054/DemRes.2015.32.48. Pew Research Center (2018). Social media fact sheet [electronic resource]. Washington,
D.C.: Pew Research Center.pewinternet.org/fact-sheet/social-media/.
Tufekci, Z. (2014). Big questions for social media big data: Representativeness, validity and other methodological pitfalls. ICWSM 14: 505–514.
Vespignani, A. (2009). Predicting the behavior of techno-social systems. Science 325(5939): 425–428.doi:10.1126/science.1171990.
Wilcoxon, F. (1946). Individual comparisons of grouped data by ranking methods. Jour-nal of Economic Entomology39(2): 269–270.
Wilson, R.E., Gosling, S.D., and Graham, L.T. (2012). A review of Facebook re-search in the social sciences. Perspectives on Psychological Science 7(3): 203–220.
doi:10.1177/1745691612442904.
Wu, S., Hofman, J.M., Mason, W.A., and Watts, D.J. (2011). Who says what to whom on twitter. Paper presented at the 20th international conference on World wide web, Hyderabad, India, March 28 – April 1, 2011.doi:10.1145/1963405.1963504.