CHEMICAL ENGINEERING
TRANSACTIONS
VOL. 44, 2015
A publication of
The Italian Association of Chemical Engineering Online at www.aidic.it/cet Guest Editors:Riccardo Guidetti,Luigi Bodria, Stanley Best
Copyright © 2015, AIDIC Servizi S.r.l.,
ISBN 978-88-95608-35-8; ISSN 2283-9216
Preliminary trials on Hyperspectral Imaging Implementation to
Detect Mycotoxins in Dried Figs
Souraya Benalia
a, Bruno Bernardi
*a, Sergio Cubero
b, Antonio Leuzzi
c, Michele
Larizza
c, José Blasco
ba Dipartimento di Agraria. Università degli Studi Mediterranea di Reggio Calabria, Feo Di Vito, 89122 Reggio Calabria, Italy, b Centro de Agroingeniería. Instituto Valenciano de Investigaciones Agrarias (IVIA), Cra. Moncada-Naquera Km 5,
Moncada, Spain
c Azienda Regionale per lo Sviluppo dell'Agricoltura Calabrese (ARSAC),Via Trieste 95, Cosenza, Italy.
Very nutritional and healthy, dried figs constitute an appreciated food for local populations of the Mediterranean area. However, the incidence of mycotoxins in this product, mainly attributed to traditional and poor agricultural practices, has been widely demonstrated and may develop quickly if storage conditions are not suitable, exceeding maximum safety thresholds set by European Union regulations. Mycotoxin identification is currently achieved by means of destructive methods that need sample preparation, and moreover are expensive and time consuming. Early and reliable detection techniques are required to prevent high risks for humans. Hyperspectral imaging is currently used for quality evaluation and safety inspection of agricultural products and food. It has not been used for the detection of dried fig contamination but could be a promising tool to determine the best spectral bands that permit contaminated fruit to be identified and eliminated, especially when applied to postharvest automated processes. In this context, the present work deals with preliminary trials on the ability of hyperspectral imaging to identify contaminations with aflatoxins and ochratoxin A on dried fig of Cosenza (PDO, Protected Designation of Origin) fruit by analyzing UV-induced fluorescence. Artificially contaminated figs did not show any fluorescence while decayed figs emitted fluorescence between 450 nm and 490 nm. The obtained results highlighted important aspects to be considered in order to improve the applied methodology and carry out further researches on the present theme.
1. Introduction
Mycotoxin occurrence in food and animal feed presents a high risk to the health of humans and livestock (Anklam et al. 2002), and may cause serious diseases (Luttfullah and Hussain 2011). Their incidence in dried figs, mainly attributed to traditional and poor agricultural practices (Öztekin et al. 2006), has been widely demonstrated (Iamanaka et al. 2007). These contaminations may develop quickly if storage conditions are not suitable; exceeding maximum safety thresholds set by European Union regulations (Zorlugenç et al. 2008). Currently, mycotoxins are determined by destructive analytical methods, which are expensive, time consuming, and not appropriate for instantaneous control (Fernández-Ibañez et al. 2009). Furthermore, these techniques are based on sampling, while mycotoxin contamination is highly heterogeneous (Kalkan et al. 2011). Therefore, their detection on foodstuffs has not only to be reliable but should avoid the expenditure of time and money (Siriacha 1991).
Analytical techniques based on Computer Vision Systems (CVS) present many advantages: mainly, rapidness, effectiveness, accuracy and objectiveness. Moreover, they are non destructive, do not need sample treatment, and are able to assess the whole area of the product despite uneven features present (Cubero et al. 2011). Hyperspectral imaging, also called imaging spectroscopy or chemical imaging (Lorente et al. 2012) is an emerging non-destructive analytical technique (Del Fiore et al. 2010) currently used for quality evaluation and safety inspection of agricultural products and food (Ariana and Lu 2010). It offers a
DOI: 10.3303/CET1544027
Please cite this article as: Benalia S., Bernardi B., Cubero S., Leuzzi A., Larizza M., Blasco J., 2015, Preliminary trials on hyperspectral imaging implementation to detect mycotoxins in dried figs, Chemical Engineering Transactions, 44, 157-162 DOI: 10.3303/CET1544027
large amount of information on the spatial and spectral characteristics (Gowen et al. 2007) of the products. This would allow for a better prediction of quality attributes than other systems, especially when applied to automated processes in postharvest. Several studies on hyperspectral imaging application for agricultural and food product assessment have been reported in the literature such as Gómez Sanchis (2010), Del Fiore et al. (2010) as well as Shahin and Symons (2011).
The analyses carried out by Di Sanzo et al. (2009) using HPLC illustrated that 26 % of Fichi di Cosenza DOP (PDO Figs of Cosenza) from Southern Italy were contaminated with aflatoxins. Out of these, 40 % was above 4 ppb, which is the maximum level allowed by European Union regulations for total aflatoxins (European Commission 2010). Also, 4 % of the analyzed samples were contaminated with ochratoxin A, of which, 26 % were above the maximum level of 10 ppb (European Commission 2006). Spectral imaging has not been used for the detection of dried fig contamination and could be a tool to determine the best spectral bands that permit contaminated fruit to be identified and eliminated. In this context, this work studies the ability of standard and hyperspectral imaging to identify dried fig contaminations with mycotoxins using UV-induced fluorescence.
2. Material and methods
2.1 Samples and reagents
The experiments considered 50 PDO (Protected Designation of Origin) dried figs harvested during the 2012 season, provided by the Consortium of “Fichi di Cosenza DOP” (European Commission 2011) in Southern Italy. A further 50 purchased fruits of the same variety ‘Dottato’, from the previous season, which showed a certain quality loss, were used for comparison purposes. The PDO fig group was divided into two subgroups and respectively contaminated with aflatoxins and ochratoxin A (OTA). Specific analytical standards of aflatoxins (B1: 01 μg/mL, B2: 0.3 μg/mL, G1: 01 μg/mL, G2: 0.3 μg/mL in varied methanol) and ochratoxin A (10 μg/mL in acetonitril) were purchased from Sigma-Aldrich.
Fig contamination occurred under a laminar flow hood. The applied mycotoxin concentrations corresponded to 4 ppb for total aflatoxins, and 10 ppb for OTA. To obtain these concentrations for each fig, the amount of the
standard to take was established according to AflaTest® HPLC (VICAM 2007) and OchraTest™ and
OchraTest™ WB HPLC (VICAM 2008) instructions manuals; then, 20 µL were taken for aflatoxin and 14 µL for ochratoxin. Moreover, some drops each of a different concentration of both standards were deposited on an inert substrate to obtain a calibration curve.
2.2 Image acquisition by hyperspectral system
Images were taken of the certified figs before and after contamination, as well as images of the deteriorated figs from the previous season. Hyperspectral images were achieved by means of CoolSnap ES camera of Photometrics, that implemented a CCD Sony ICX285 having a matrix format of 1,392 x 1,040 pixels and 12 bit colour depth. The acquisition system was equipped with a LCTF (Varispec VIS07) sensitive in the range 460 nm – 720 nm with a resolution of 7 nm. Lighting was performed using eight black light (or UV-A light) fluorescent tubes (Sylvania blacklight-blue F 18W/ BLB-T8), that efficiently emitted UV-A at 315 nm - 400 nm (peak at 352 nm and 368 nm) and which had a strong photochemical and fluorescent effect. The time to acquire one hyperspectral image was of 28 seconds for each fig. This device (Figure 1) was used in order to verify whether mycotoxin detection wavelengths corresponded to those employed in conventional destructive methods. As a final stage, contamination could be quantified by analyzing reflectance spectra.
2.3 Image acquisition by digital camera
RGB image were taken with a digital camera Canon EOS 550D that allowed images to be captured with a size of 2,592 x 1,728 pixels and a resolution of 0.06 mm/pixel. Lighting was provided by the same eight fluorescent tubes used in the hyperspectral system. The lamps were placed on the four sides of the squared inspection chamber in a 0°/45° configuration. This system was mainly employed for comparison purposes, as well as to check the fluorescence emitted by contaminated figs under UV-A light.
Figure 1. The hyperspectral system used for image acquisition
3. Results and discussion
The removal of aflatoxin contaminated figs as widely carried out in some processing plants using UV-light (365 µm), has been proved to be efficient (Karbancioglu-Güler & Heperkan 2009). Indeed, levels of 100-1,400 µg/kg B1, and 0.2-1,900 µg/kg B2 aflatoxins were detected on fruits showing a blue and green fluorescence under ultraviolet light, as reported by Iamanaka et al. (2007).
In both imaging systems, wavelength of UV-A radiation mimic conditions for mycotoxin detection with HPLC, i.e.
Aflatoxins: excitation: 360 nm to 365 nm, detection: 425 nm to 460 nm;
OTA: excitation: 333 nm, detection 443 nm to 477 nm.
Weak, low intensity fluorescence could be observed on the inert surface. It could, however, not be observed on artificially contaminated figs with the above mentioned concentrations, i.e. 4 ppb for aflatoxins and 10 ppb for OTA. In contrast, Kalkan et al. (2011) were able to classify hazelnuts as contaminated (>4 ppb) or not-contaminated (<4 ppb) with aflatoxins (92.3 % accuracy) from data obtained by hyperspectral imaging. Moreover, Fujita et al. (2013) demonstrated the possibility of a fast and quantitative detection of aflatoxin in experimentally contaminated nutmeg extract using fluorescence fingerprint.
The characteristic fluorescence is due to the interaction between peroxidases normally found in living plants and kojic acid produced by Aspergillus, but could also be associated with mycotoxins (Siriacha 1991). However, this fluorescence could not be always revealed even on contaminated food (Wilson 1989). Thus, the fact that figs did not present any fluorescence may be attributed to a low quantity of peroxidases.
Also, it has been assumed that the rough and dry surface of figs could absorb the infinitesimal concentrations of mycotoxins, impeding their detection.
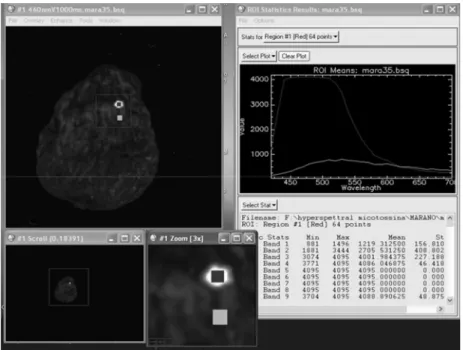
However, it is to be noticed that fluorescence occurred on some of the figs from the previous season. The greatest difference between the spectra of the fluorescent area and a non-fluorescent one reaches its maximum between 450 nm and 490 nm (Figure 2), thus corresponding to emission wavelengths reported in literature.
Figure 2. The spectra of emitted fluorescence obtained from a fluorescent area and non-fluorescent one
An observation under a stereomicroscope (Leica M165C, Switzerland) demonstrated the presence of fungal mycelia (Figure 3). This, points out the possibility of using hyperspectral imaging for mycotoxin detection and quantification.
Figure 3. Presence of filamentous fungi mycelia on fig skin observed under stereomicroscope
4. Conclusions
The present trials illustrate a primary approach of mycotoxin detection on artificially mycotoxin-contaminated dried figs (PDO figs of Cosenza, Southern Italy) by hyperspectral imaging under UV light. Mycotoxin detection and quantification could not be carried out on artificially-contaminated figs, since that they did not show any fluorescence. However, the presence of a weak signal on the inert surface as well as on the naturally contaminated figs encourage realizing further experiments. The employed methodology has to be improved. Also, it is necessary to explore more spectral bands that allow the identification of contaminated figs using
more sophisticated image processing techniques, as reported by (Kalkan et al. 2011). Only in this way, reliable and certain conclusions could be reached.
Acknowledgements
The authors have contributed equally to the present work. Experimental trials were carried at Centro de Agroingeniería, Instituto Valenciano de Investigaciones Agrarias (IVIA - Valencia, Spain).
References
Anklam E., Stroka J., Boenke A., 2002, Acceptance of analytical methods for implementation of EU legislation with a focus on mycotoxins, Food Control, 13(3), 173–183.
Ariana D.P., Lu R., 2010, Evaluation of internal defect and surface color of whole pickles using hyperspectral imaging, Journal of Food Engineering, 96(4), 583–590.
Cubero S., Aleixos N., Moltó E., Gómez-Sanchis J., Blasco J., 2011, Advances in machine vision applications for automatic inspection and quality evaluation of fruits and vegetables, Food and Bioprocess Technology, 4(4), 487–504.
Del Fiore A., Reverberi M., Ricelli A., Pinzari F., Serranti S., Fabbri A.A., Bonifazi G., Fanelli C., 2010, Early detection of toxigenic fungi on maize by hyperspectral imaging analysis, International journal of food microbiology, 144(1), 64–71.
Di Sanzo R., Postorino S., Suraci F., Carabetta S., Fuda S., Russo M.T., 2009, Mycotoxins contamination in dried figs and their by-products, In 3rd International Congress on Food and Nutritions, Antalya, Turkey. European Commission, 2006, Commission Regulation (EC) No 1881/2006 of 19 December 2006 setting
maximum levels for certain contaminants in foodstuffs, Official Journal of the European Union L 364/5 (20.12.20) <www.eur-lex.europa.eu> accessed 01.12.2014
European commission, 2010, Commission Regulation (EU) No 165/2010 of 26 February 2010 amending Regulation (EC) No 1881/2006 setting maximum levels for certain contaminants in foodstuffs as regards aflatoxinsText with EEA relevance - Reg165, Official Journal of the European Union, L 50/8 (27.2.201), <www.fsai.ie> accessed 01.12.2014
European Commission, 2011, Commission Implementing Regulation (EU) No 596/2011 of 7 June 2011 entering a name in the register of protected designations of origin and protected geographical indications [Fichi di Cosenza (PDO)], Official Journal of the European Union L 162, 22/06/2011 <www.eur-lex.europa.eu> accessed 05.05.2014
Fernández-Ibañez V., Soldado A., Martínez-Fernández A., de la Roza-Delgado B., 2009, Application of near infrared spectroscopy for rapid detection of aflatoxin B1 in maize and barley as analytical quality assessment, Food Chemistry, 113(2), 629–634.
Fujita K., Sugiyama J., Tsuta M., Shibata M., Kokawa M., Onda H., Sagawa T., 2013, Detection of aflatoxins B1, B2, G1 and G2 in nutmeg extract using fluorescence fingerprint, Food Science and Technology Research, 19(4), 539–545.
Gómez Sanchis J., 2010, Detección automática de podredumbres en cítricos mediante procesado avanzado de imágenes hiperespectrales, Universitat de València, Valencia, España
Gowen A.A., O’Donnell C.P., Cullen P.J., Downey G., Frias J.M., 2007, Hyperspectral imaging – an emerging process analytical tool for food quality and safety control, Trends in Food Science & Technology, 18(12), 590–598.
Iamanaka B.T., Castle de Menezes H., Vicente E., Leite R.S.F., Taniwaki M.H., 2007, Aflatoxigenic fungi and aflatoxins occurrence in sultanas and dried figs commercialized in Brazil, Food Control 18(5), 454–457. Kalkan H., Beriat P., Yardimci Y., Pearson T.C., 2011, Detection of contaminated hazelnuts and ground red
chili pepper flakes by multispectral imaging, Computers and Electronics in Agriculture, 77(1), 28–34. Karbancioglu-Güler F., Heperkan D., 2009, Natural occurrence of fumonisin B1 in dried figs as an unexpected
hazard, Food and chemical toxicology, 47(2), 289–92.
Lorente D., Aleixos N., Gómez-Sanchis J., Cubero S., García-Navarrete O.L., Blasco J., 2012, Recent advances and applications of hyperspectral imaging for fruit and vegetable quality assessment, Food and Bioprocess Technology, 5(4), 1121–1142.
Luttfullah G., Hussain A., 2011, Studies on contamination level of aflatoxins in some dried fruits and nuts of Pakistan, Food Control, 22(3-4), 426–429.
Öztekin S., Zorlugenç B., Zorlugenç F.K., 2006, Effects of ozone treatment on microflora of dried figs, Journal of Food Engineering, 75(3), 396–399.
Shahin M.A., Symons S.J., 2011, Detection of fusarium damaged kernels in Canada western red spring wheat using visible/near-infrared hyperspectral imaging and principal component analysis, Computers and Electronics in Agriculture, 75(1), 107–112.
Siriacha P., 1991, Bright greenish-yellow fluorescence test for aflatoxin estimation, In Mycotoxin prevention
and control in foodgrains, <www.fao.org> accessed 01.12.2014
VICAM, 2007, AflaTest HPLC Instruction Manual, 32p.
VICAM, 2008, OchraTest and OchraTest WB Instruction manual, 25p.
Wilson D.M., 1989, Analytical methods for aflatoxins in corn and peanuts, Arch. Environ. Contam. Toxicol., 18, 308–314.
Zorlugenç B., Zorlugenç F.K., Öztekin S., Evliya I.B., 2008, The influence of gaseous ozone and ozonated water on microbial flora and degradation of aflatoxin B(1) in dried figs, Food and chemical toxicology, 46(12), 3593–3597.