The Mpemba effect in spin glasses is a persistent
memory effect
Marco Baity-Jesia,b, Enrico Calorec,d, Andres Cruzb,e, Luis Antonio Fernandezb,f, Jos ´e Miguel Gil-Narvi ´onb, Antonio Gordillo-Guerrerob,g,h, David I ˜niguezb,i, Antonio Lasantaj, Andrea Maioranob,k, Enzo Marinarik,l,m, Victor Martin-Mayorb,f, Javier Moreno-Gordob,e, Antonio Mu ˜noz Sudupeb,f, Denis Navarron,o, Giorgio Parisik,l,m,1, Sergio Perez-Gavirob,e,p, Federico Ricci-Tersenghik,l,m, Juan Jesus Ruiz-Lorenzob,h,q, Sebastiano Fabio Schifanod,r, Beatriz Seoaneb,s,t, Alfonso Taranc ´onb,e, Raffaele Tripiccionec,d, and David Yllanesb,u,v,1
aDepartment of Chemistry, Columbia University, New York, NY 10027;bInstituto de Biocomputaci ´on y F´ısica de Sistemas Complejos, Universidad de Zaragoza, 50018 Zaragoza, Spain;cDipartimento di Fisica e Scienze della Terra, Universit `a di Ferrara, I-44122 Ferrara, Italy;dSezione di Ferrara, Istituto Nazionale di Fisica Nucleare, I-44122 Ferrara, Italy;eDepartamento de F´ısica Te ´orica, Universidad de Zaragoza, 50009 Zaragoza, Spain;fDepartamento de F´ısica Te ´orica, Universidad Complutense, 28040 Madrid, Spain;gDepartamento de Ingenier´ıa El ´ectrica, Electr ´onica y Autom ´atica, Universidad de Extremadura, 10003 C ´aceres, Spain;hInstituto de Computaci ´on Cient´ıfica Avanzada, Universidad de Extremadura, 06006 Badajoz, Spain;iFundaci ´on Agencia Aragonesa para la Investigaci ´on y el Desarrollo, Diputaci ´on General de Arag ´on, 50018 Zaragoza, Spain;jGregorio Mill ´an Institute of Fluid Dynamics, Nanoscience and Industrial Mathematics, Department of Materials Science and Engineering and Chemical Engineering, Universidad Carlos III de Madrid, 28911 Legan ´es, Spain;kDipartimento di Fisica, Sapienza Universit `a di Roma, I-00185 Rome, Italy;lSezione di Roma 1, Istituto Nazionale di Fisica Nucleare, I-00185 Rome, Italy;mNanotec, Consiglio Nazionale delle Ricerche, I-00185 Rome, Italy;nDepartamento de Ingenier´ıa, Electr ´onica y Comunicaciones, Universidad de Zaragoza, 50018 Zaragoza, Spain;oI3A, Universidad de Zaragoza, 50018 Zaragoza, Spain;pCentro Universitario de la Defensa, Universidad de Zaragoza 50090 Zaragoza, Spain;qDepartamento de F´ısica, Universidad de Extremadura, 06006 Badajoz, Spain;rDipartimento di Matematica e Informatica, Universit `a di Ferrara, I-44122 Ferrara, Italy;sLaboratoire de Biologie Computationnelle et Quantitative, UMR 7238, Sorbonne Universit ´es, 75005 Paris, France;tInstitut des Sciences du Calcul et des Donn ´ees, Sorbonne Universit ´es, 75005 Paris, France;uSoft and Living Matter Program, Department of Physics, Syracuse University, Syracuse, NY 13244; andvChan Zuckerberg Biohub, San Francisco, CA 94158
Contributed by Giorgio Parisi, June 6, 2019 (sent for review December 5, 2018; reviewed by Kurt Binder and Srikanth Sastry) The Mpemba effect occurs when a hot system cools faster than
an initially colder one, when both are refrigerated in the same thermal reservoir. Using the custom-built supercomputer Janus II, we study the Mpemba effect in spin glasses and show that it is a nonequilibrium process, governed by the coherence length ξ of the system. The effect occurs when the bath temperature lies in the glassy phase, but it is not necessary for the thermal protocol to cross the critical temperature. In fact, the Mpemba effect follows from a strong relationship between the internal energy and ξ that turns out to be a sure-tell sign of being in the glassy phase. Thus, the Mpemba effect presents itself as an intriguing avenue for the experimental study of the coherence length in supercooled liquids and other glass formers.
spin glasses | memory effects | Mpemba effect | nonequilibrium physics
T
he Mpemba effect (ME) refers to the observation that the hotter of 2 identical beakers of water, put in contact with the same thermal reservoir, can cool faster under certain con-ditions (1). The phenomenon is not specific to water, as it has been reported for nanotube resonators (2) and clathrate hydrates (3). However, although records of the ME date as far back as Aristotle (4, 5), its very existence has been questioned (6).The ME is a nonequilibrium process (7–9), and when a com-plex system evolves out of equilibrium, its past history determines its fate. The simplest of these memory effects is, probably, the Kovacs effect (10): After a temperature cycle, a glassy polymer is left at the working temperature T with a specific volume equal to its equilibrium value. However, the polymer is still out of equi-librium, as evinced by a nonmonotonic further time evolution of the specific volume. Memory effects are ubiquitous and rele-vant in many systems of technological and/or biological interest. Important examples include disordered materials (11), polymers (12), amorphous solids (13), granular matter (14), biological sys-tems (15), batteries (16), and, of course, the disordered magnetic alloys known as spin glasses, which display spectacular memory effects (17).
Here, we show that spin glasses (18) are an especially apt model system to investigate the ME. Using the Janus II super-computer (19), custom-built for spin-glass simulations, we show that the ME is indeed present in spin glasses, and we clarify its origin: It is a nonequilibrium memory effect, encoded in the glassy coherence length.
One major advantage of spin glasses as a model system is that, while their behavior is very complex, we now know that many of their major nonequilibrium processes are ruled by the coherence length ξ of the growing glassy domains (20–23). This includes, as we show in this paper, the ME. In the simplest protocol, a sample initially at a high temperature is suddenly placed at the working temperature T , lower than the critical temperature Tc.
The system relaxes afterward, but response functions such as the magnetic susceptibility depend on time for as long as one has the patience to wait [in analogy with living beings, glasses are said to
Significance
The Mpemba effect, wherein an initially hotter system relaxes faster when quenched to lower temperatures than an initially cooler system, has attracted much attention. Paradoxically, its very existence is a hot topic. Using massive numerical simu-lations, we show unambiguously that the Mpemba effect is present in the archetypical model system for complex behavior, spin glasses. We find that the Mpemba effect in spin glasses is due to the aging dynamics of the internal energy, as controlled by the nonequilibrium spin-glass coherence length. Interest-ingly, the effect is not present when the system remains all of the time in the paramagnetic phase. Therefore, the Mpemba effect suggests itself as an effective probe for a glass transition, potentially useful for other glass-forming systems.
Author contributions: L.A.F., A.L., E.M., V.M.-M., and J.J.R.-L. designed research; M.B.-J., E.C., A.C., L.A.F., J.M.G.-N., A.G.-G., D.I., A.L., A.M., E.M., V.M.-M., J.M.-G., A.M.S., D.N., G.P., S.P.-G., F.R.-T., J.J.R.-L., S.F.S., B.S., A.T., R.T., and D.Y. performed research; L.A.F., A.L., V.M.-M., and J.J.R.-L. analyzed data; M.B.-J., E.C., A.C., J.M.G.-N., A.G.-G., D.I., A.M.S., S.P.-G., S.F.S., A.T., and R.T. contributed Janus II hardware/software development; L.A.F., A.L., A.M., E.M., V.M.-M., J.M.-G., G.P., F.R.-T., J.J.R.-L., and D.Y. contributed physical inter-pretation of results; J.M.G.-N. and D.N. contributed Janus II simulation software; D.I., S.F.S., A.T., and R.T. contributed Janus II design; and M.B.-J., A.L., V.M.-M., J.M.-G., F.R.-T.,
J.J.R.-L., B.S., and D.Y. wrote the paper.y
Reviewers: K.B., University of Mainz; and S.S., Jawaharlal Nehru Center for Advanced
Scientific Research.y
Conflict of interest statement: G.P. received funding from the Simons collaboration, and
S.S. has received travel expenses to attend the Simons collaboration annual meetings.y
Published under thePNAS license.y
1To whom correspondence may be addressed. Email: [email protected] or
APPLIED
PHYSICAL
SCIENCES
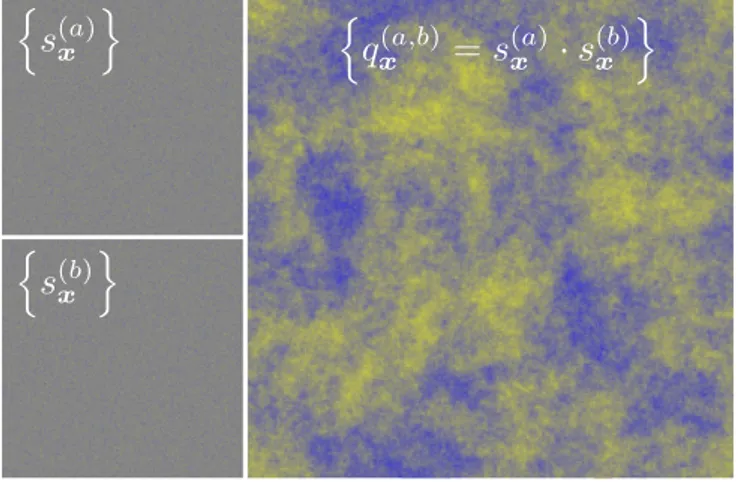
age (12)]. As aging proceeds, the size of the magnetic domains, ξ(t ), perennially grows (yet, the magnetic ordering is apparently random; Fig. 1).
Only recently have we learned how to compute ξ(t) reli-ably from microscopic correlation functions (24). Interestingly enough, this microscopic ξ(t) matches (23) the length scale determined from macroscopic responses in experiments (26).
The time growth of ξ(t) will be a crucial issue. In the para-magnetic phase, T > Tc= 1.102(3)(27), ξ grows up to its
equi-librium value, which can be very large close to Tc. On the other
hand, below Tc, ξ(t) grows without bounds, but excruciatingly
slowly. Empirically, one finds that t and ξ(t) are related through (25, 28)
ξ ∝ t1/z (T ), z (T < Tc) ≈ 9.6
Tc
T . [1]
The exponent z (T ), already very large near Tc, becomes even
larger upon lowering T . The very large value of z (T ) explains why supercomputers such as Janus II, specifically designed to simulate spin glasses (19), are necessary. Indeed, one has to simulate the dynamics for a long time to see ξ(t) vary by a sig-nificant amount. The simulations discussed herein (ref. 25 and Materials and Methods) have t varying by 11 orders of mag-nitude, for systems large enough to be representative of the thermodynamic limit. On the other hand, for T > TcEq. 1 holds
only out of equilibrium, when ξ has not yet approached its final equilibrium value. Under such circumstances, z ≈ 6 has been computed numerically (29).
Results
The ME in Spin Glasses.The first step in a numerical study of the ME is identifying which thermometric magnitude corre-sponds to the off-equilibrium temperature that would be found experimentally. In our case, this is the energy density (i.e., the
Fig. 1. Spin-glass coherence length. (Upper Left) A snapshot of a configu-ration {s(a)
x }, which has evolved for t = 236Monte Carlo steps at T = 0.7 ≈
0.64Tc. We show the average magnetization on the xy plane, averaging over
z. (Lower Left) Another configuration {s(b)
x }of the same sample, prepared
in the same way as {s(a)
x }. No visible ordering is present in either
configura-tion because the preferred pattern of the magnetic domains cannot be seen by eye (s = 1 is plotted in yellow and−1 in blue). (Right) If one measures the overlap between the 2 configurations (Eq. 5 in Materials and Methods) and with the same color code used for the spins, the preferred pattern of the magnetic domains, of size ξ, becomes visible. A reliable method to extract ξfrom the overlap fields has been known for some time (24), but only in 2018 has it been possible to reach accuracies better than 1% in ξ (25), thanks to the Janus II computer (19) and the use of many clones for the same sam-ple (this strategy works only if the system size, which here is L = 160, turns out to be much larger than ξ).
Fig. 2. Classical Mpemba protocol. We show the time evolution of the energy of spin-glass systems initially prepared at a higher temperature (T = 1.3; red line) or at a lower temperature (T = 1.2; blue lines), but always in the paramagnetic (high-temperature) phase (Tc≈1.10). In all 3 cases, the systems are initially left to evolve out of equilibrium until they reach the internal energies shown in the key. At t = 0, all preparations are quenched—that is, put in contact with a thermal reservoir at temper-ature T = 0.7 ≈ 0.64Tc. As discussed in the text, the instantaneous internal energy is a measure of the (off-equilibrium) sample temperature. In agree-ment with the original Mpemba experiagree-ment (1), the system originally at the higher energy cools faster. (Lower Left Inset) Close-up of the first cross-ing between energy curves, showcross-ing the very small error bars, equal to the thickness of the lines [here and in all other figures, error bars represent one-SD; control variates (see ref. 30 and Materials and Methods) are used to improve accuracy]. (Upper Right Inset) Close-up of the second crossing between energy curves.
instantaneous energy per spin E ; Materials and Methods). E is a natural choice, because it is the observable conjugated with tem-perature. Furthermore, in equilibrium, there is a monotonically increasing correspondence between T and E .
After the above considerations, we are ready to investigate the ME in spin glasses (see Materials and Methods for details on the model and observables). Our first protocol strongly resembles the original Mpemba experiment (1). We studied the evolu-tion of 2 different nonequilibrium preparaevolu-tions for the same system: In preparation 1, the system started in a thermal bath at T1= 1.3 and was left to evolve until it reached an initial
energy E1(t = 0) ≈ −1.6428, while in preparation 2, it was put
in a bath at T2= 1.2, where it reached a much lower
ini-tial energy E2(t = 0) ≈ −1.6714.∗ Note that these states are
out of equilibrium: T1 and T2 only indicate the temperature
of the bath. At time t = 0, both systems were quenched— that is, they were placed in contact with a thermal reservoir at T = 0.7 ≈ 0.64Tc. Fig. 2 shows the evolution of the
ener-gies (temperatures) after the quench: The hotter preparation (red) relaxes to low energies faster than the colder prepara-tion (solid blue). This is a perfect correspondence with the ME (1).
We also show with a blue dotted line the evolution of a third preparation, starting again at the lower temperature T = 1.2, but with a slightly lower initial energy E3(t = 0) ≈ −1.6738. Even in
this case, the ME is present, but the crossing of the energy curves takes place at a much longer time, even though the difference between the preparation energies E2 and E3 is of only 0.15%.
We need to find the controlling parameter.
*The configuration of the system before being exposed to either bath is random with a
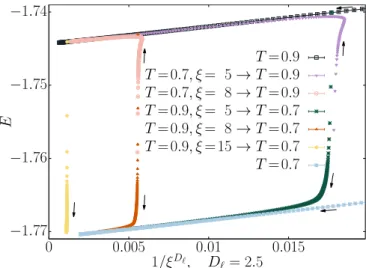
Fig. 3. ME in the spin-glass phase. As in Fig. 2, but all four initial prepa-rations (see text for details) are now carried out in the spin-glass phase (T < Tc). The preparation that cools faster is not the initially coldest one (blue curve), but the one with the largest initial coherence length (yellow curve). The last point in the isothermal relaxation at T = 0.7 corresponds with the same time as the configurations shown in Fig. 1. (Inset) A zoom of the second crossing point between the curves for preparations (T = 0.9, ξ = 8; red curve) and (T = 0.7, ξ = 6; blue curve). This second crossing is not the ME. Rather, the ME arises at the first crossing at t ≈ 5 × 10⁴. The second crossing disappears if one plots parametrically E(t) as a function of ξ(t). In other words, the description afforded by Eq. 2 is very accurate, but not exact.
Remembering our initial discussion of spin-glass dynamics, a natural candidate emerges: the coherence length ξ(t). Indeed, in terms of ξ, our 3 starting conditions look very different. Our hot preparation (T1= 1.3, E1= −1.6428) had ξ1= 12, while our
cold preparations (T2,3= 1.2, E2= −1.6714, E3= −1.6738) had
ξ2= 5and ξ3= 8, respectively. Therefore, upon quenching, the
initially hotter preparation is actually in a more advanced dynam-ical state. In addition, preparations 2 and 3, which have almost the same E , have very different starting ξ, which, from Eq. 1, can explain the differing relaxation times.
We arrive, then, at our working hypothesis: Out of equilib-rium, our system is not adequately labeled by the temperature T of the thermal bath alone, or even by T plus the instantaneous internal energy E . Instead, ξ emerges as the hidden parameter that will rationalize the results.
Notice that, according to this idea, crossing Tcshould not be
necessary to find an ME. The only required ingredient would be starting points A and B with TA> TB and ξA> ξB. We tested
this hypothesis in Fig. 3, where we worked solely in the low-temperature phase. Preparation 1 started at T = 0.7 until it reached ξ1= 6, while preparations 2–4 evolved at T = 0.9 until
they reached ξ = 5, 8, 15, respectively. All samples were then quenched to T = 0.7, and we started measuring (i.e., we set t = 0). In accordance with our previous discussion, the cool-ing rate was not controlled by the preparation temperature, but by the starting coherence length. Preparations starting at T = 0.9but with ξ(t = 0) greater than ξ1= 6cooled faster than
preparation 1.
The Energy-Coherence Length-Phase Diagram. To make these observations more quantitative, we need to explore the rela-tionship between E and ξ in an off-equilibrium spin glass. Fortunately, we have heuristic arguments (31) and numerical results (20, 24) suggesting that
E (t ) = E∞(T ) +
E1
ξD`(t )+ . . .. [2]
The dots stand for scaling corrections, subdominant for large ξ, and D`≈ 2.5 (32) is the lower critical dimension (the phase
tran-sition occurs only for spatial dimension D > D`). We note that
the heuristic derivation of Eq. 2—recall ref. 31—makes sense only in the spin-glass phase, T < Tc. We shall test below and in
our study of the inverse ME (IME) whether or not Eq. 2 applies in the spin-glass phase and in the paramagnetic phase.
As Fig. 4 shows, the ME in spin glasses followed from the combination of 2 simple ideas:
1) When a quick temperature change takes place, ξ (which is a slow variable; recall Eq. 1) has no time to adjust and remains basically unchanged.
2) Setting quick transients aside, the energy density follows in all cases (Eq. 2).
Both of these points are slight oversimplifications (the analysis of the deviations will be performed elsewhere), but their combi-nation results in a very simple explacombi-nation of the ME. We first note that, when temperature is fixed, the energy density is an (almost) linear function of 1/ξ2.5. Furthermore, the slope E1
varies by <4% in the range we explore. It follows that the nat-ural phase diagram to discuss the ME is the (E , 1/ξ2.5) plane.
Indeed, isothermal relaxations are represented in the (E , 1/ξ2.5)
plane as a set of (almost) parallel, (almost) straight lines. To an excellent first approximation, the effects of temperature changes can be depicted as almost instantaneous vertical moves between the parallel straight lines that correspond to the initial and final temperatures. It then follows that, in the spin-glass phase at least, the larger the starting ξ, the faster the cooling, irrespective of the initial preparation protocol, exactly as observed in Figs. 2 and 3. Inverse Mpemba Effect. In refs. 7 and 8, an inverse thermal proto-col was suggested: The bath temperature was chosen to be higher than the one of the starting condition. Under such circumstances, it was observed that the coolest of 2 initial preparations could heat faster. This effect was named IME.
As we have seen in the discussion of the energy-coherence length-phase diagram, heating and cooling protocols are quite
Fig. 4. Relationship between the energy density E and the coherence length ξ. As suggested by Eq. 2, for isothermal relaxations (in the plot
T = 0.7 and 0.9, depicted with continuous lines), E is an essentially linear
function of 1/ξ2.5(at least for the plotted range of ξ > 4.8). Furthermore, the dependence of the slope on temperature is marginal. Temperature-varying protocols are seen to be essentially vertical moves between the straight lines corresponding to isothermal relaxations at the initial and final temperatures. These vertical moves are very quick initial transients, in which (in moves to higher temperatures only), ξ slightly decreases and then increases again.
APPLIED
PHYSICAL
SCIENCES
Fig. 5. A tiny IME. Time evolution of the energy, for the 3 different prepa-rations described in the main text, compared with a quench from T = ∞ to
T = 1.4 (top curve). In the 3 cases, the initial temperature is in the spin-glass
phase, and the final temperature is T = 1.4 > Tc. A very small ME is found at the time indicated by the arrow, only when warming up samples with similar starting energy.
symmetrical, provided that both the final and initial bath tempera-tures lie below Tc. It is therefore more challenging to see whether
or not the IME survives crossing Tc. The question is nontrivial,
because Eq. 2 does not hold in the paramagnetic phase.
To verify this, we reversed our protocol, choosing starting tem-peratures T < Tc in the spin-glass phase, and warmed up the
samples to a temperature well above Tc. Specifically, we used 3
starting conditions for the warm-up experiment. In protocol 1, we chose T = 0.7 and ξ = 2.5; in protocol 2, we chose T = 0.7 and ξ = 11.7; and in protocol 3, we chose T = 0.8 and ξ = 15.8. In the 3 cases, we switched instantly the thermal bath to T = 1.4 [where the asymptotic equilibrium value was ξ = 8.95(5)] and followed the relaxation of coherence length and energy.
Fig. 5 depicts the evolution of the energy in the warm-up experiments. If one compares protocol 1 with protocol 3, the ME is clearly absent. Instead, a tiny ME is present when compar-ing protocols 2 and 3, which have a more similar startcompar-ing energy and a coherence length that manifests a better thermalization in the spin-glass phase: The curve that was initially hotter became colder after ∼ 20 iterations.
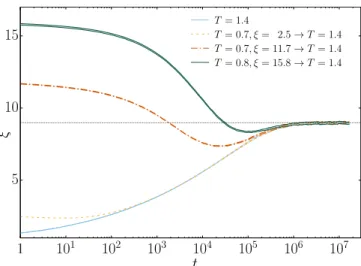
In Fig. 6, we show the evolution of ξ during the 3 warm-up protocols. Visibly, Eq. 1, valid only under Tc, does not hold.
Fur-thermore, for all of the starting conditions, the curves tend to approach a master curve represented by the instant quench from T = ∞to T = 1.4, generating an undershoot in the time evolu-tion of the observable. An analogous independence of the initial conditions has been recently observed in the paramagnetic phase of a 2D spin glass (33, 34).
By comparing Figs. 5 and 6, one can see that energy and coher-ence length converge to their equilibrium value at very different times and that an undershoot on E (t) is not corresponded with an undershoot of ξ(t) (and vice versa). This decoupling between the 2 observables is necessary for the ME to take place, since the time scale of the crossing between protocols 2 and 3 does not correspond to any significant change in coherence lengths. The nonmonotonic behavior of E (t) and ξ(t) will be the subject of further investigation.
Discussion
In summary, we have shown that the ME is present in spin glasses, where it appears as an intrinsically nonequilibrium process, ruled by the spin-glass coherence length ξ. Although
encoding the history of a complex system by a single number is an oversimplification, we have shown that the approximate description afforded by Eq. 2 is accurate enough to explain the ME.
Our results explain how the most natural experimental setup (prepare 2 identical systems at T1, T2> Tcwith an identical
pro-tocol, then quench them) can fail to see the effect (6). Indeed, for spin glasses at least, a different starting ξ is required. Above Tc,
where the growth rate of ξ does not depend on T , this means let-ting the hotter preparation evolve for a longer time at the initial temperature before the quench. On the other hand, if we pre-pare the systems at T1, T2< Tcand then bring them to an even
lower temperature, the effect is enhanced, because in the T < Tc
phase, the growth of ξ is slower for lower temperatures. There-fore, in the low-temperature phase, the ME can be found, even with identical preparation times for the hot and cold prepara-tions. Finally, we have investigated the IME. If both the initial and the final temperatures lie below Tc, the system behaves in a
symmetrical way under cooling or heating (Fig. 4). On the other hand, if we start in the spin-glass phase and end in the paramag-netic phase, the IME is strongly suppressed because Eq. 2 is not valid for T > Tc.
The ME is peculiar among the many memory effects present in spin glasses. Indeed, this phenomenon can be studied through quantities such as the energy density, which are measured at just one time scale [rather than the usual 2 times (17, 18, 23)]. How-ever, our setup poses an experimental challenge, because we are not aware of any measurement of the nonequilibrium tempera-ture associated with the magnetic degrees of freedom. Perhaps one could adapt the strategy of ref. 35, connecting dielectric sus-ceptibility and polarization noise in glycerol, to measurements of high-frequency electrical noise in spin glasses (36).
An easier experimental avenue is suggested by our study of the IME, where the preparations are heated, rather than cooled. In this case, while the response of the energy is very small, the process is accompanied by a dramatic memory effect in the coherence length. This quantity has a nonmonotonic time evo-lution upon heating from the spin glass to the paramagnetic phase, before converging to the master (isothermal) curve, and is measurable with current experimental techniques.
Our investigation of the ME offers as well a perspective into an important problem—namely, the study of the glassy coherence
Fig. 6. Coherence length: Undershooting and convergence to a master curve. Coherence lengths ξ of the experiments described in Fig. 5 are shown. The time evolution of ξ tends to converge toward the curve correspond-ing to a quench from T = ∞ to T = 1.4 (bottom curve), givcorrespond-ing rise to an undershoot of ξ when its initial value is higher than the equilibrium ξ at
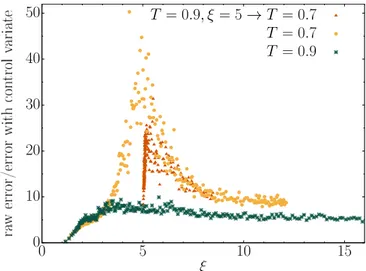
Fig. 7. Improving the accuracy with control variates. The figure shows the ratio of statistical errors, as a function of ξ(t), for the naive (Eq. 6) and improved (Eq. 8) estimates of the energy density. The data shown corre-spond to 3 different relaxations. Two of them are isothermal relaxations starting from ξ = 0 at t = 0. The third relaxation corresponds to the prepa-ration starting at (T = 0.9, ξ = 5), which is quenched to T = 0.7 at t = 0 (i.e., the green curves in Figs. 3 and 4). The error reduction is largest for the isothermal relaxation at T = 0.7 and 219
≤ t ≤ 221, of course (after all, this is the temperature and time region defining the control variate), but the error reduction is also very significant at other times and temperatures.
length in supercooled liquids and other glass formers (37). Indeed, the identification of the right correlation function to study experimentally (or numerically) is still an open problem. Spin glasses are unique in the general context of the glass tran-sition, in both senses: We know which correlation functions should be computed microscopically (38, 39), while accurate experimental determinations of the coherence length have been obtained (26). The fact that we have such a strong command over the spin-glass coherence length has allowed us to test to very high accuracy its relationship with an extremely sim-ple quantity such as the energy; Eq. 2. Furthermore, we have shown that this tight relationship between the coherence length and the energy holds only in the spin-glass phase. However, the energy is a local, single-time quantity, just as the specific volume measured in the Kovacs effect in polymers. There-fore, Eq. 2 suggests an intriguing and far-reaching alternative: Rather than considering 2-time correlation functions of ever-increasing complexity, it might be worth seeking high-accuracy experimental measurements of single-time quantities such as the specific volume. Furthermore, we find that the Mpemba effect is tiny, almost invisible, in the paramagnetic phase. Thus, finding a sizeable Mpemba-like behavior for quantities such as the specific volume may be a crucial step forward in the experimental identification of a glassy coherence length in a low-temperature phase.
Materials and Methods
Model and Observables. We considered Metropolis dynamics for the Edwards–Anderson model in a cubic lattice of linear size L = 160, with nearest-neighbor interactions and periodic boundary conditions:
H = −X hx,yi
Jx ,ysxsy. [3]
The spins sx=±1 were placed on the lattice nodes, x. The couplings Jx,y=±1,
which join nearest neighbors only, were chosen randomly with 50% prob-ability and were quenched variables. For each choice of the couplings (one “sample”), we simulated 256 independent copies of the system (clones). We denote by h· · · iJ the average over the thermal noise (i.e., average over
results for the 256 clones corresponding to a single sample); the subsequent
average over our 16 samples is indicated by square brackets [(· · ·)]. The lattice size L = 160 is large enough to effectively represent the ther-modynamic limit (for this, and other details, see ref. 25). The model described by Eq. 3 undergoes a spin-glass transition at Tc=1.102(3) (27). A single Metropolis sweep roughly corresponds to 1 ps of physical time. Therefore, the time in our simulations varies from 1 ps to a 10th of a second.
We computed the spin-glass coherence length from the decay of the microscopic correlation function
C4(r, t) = 1 L3 X x h hq(a,b)x q (a,b) x+riJ i . [4]
where the overlap field was computed as
q(a,b)x =s(a)x s(b)x . [5]
In the above expression, indices a and b label different clones (of course, we averaged over the 256 × 255/2 possible choices for the pair of clones). Technically speaking, the spin-glass coherence length ξ used in this work corresponds to the ξ1,2integral determination [we refer the reader to the literature for details (24, 25)].
The Energy Density and Its Control Variate. The naive determination of the internal energy density at time t (t is the time elapsed after the initial preparation, as measured in Metropolis full-lattice sweeps) is
Enaive(t) = 1
L3[hH(t)iJ]. [6]
This estimate, which is perfectly correct, can be made far more accurate by using a suitable control variate (30).
Before going on, it should be clear that Enaive(t) is a random variable: It is the estimate of the thermal and disorder average as obtained from our numerical data. Of course, the exact mean values, obtained by averaging over the thermal noise and the coupling realizations with infinite statistics, are not random variables.
Specifically, we improved Enaive(t) by subtracting from it another random variable, named the control variate, extremely correlated with it. The expec-tation value of the control variate vanished; hence, it did not change the (inaccessible with finite statistics) exact expectation value of Enaive(t). Fur-thermore, we chose a control variate which is independent of temperature and time. So, the overall effect of the control variate was twofold: 1) a uniform (random) vertical shift for all data in Figs. 2–5; and 2) a dramatic reduction of the error bars.
Our control variate was obtained as follows. For each of our 16 sam-ples, we took a fully random initial configuration, placed it suddenly at
T = 0.7 (this is our t = 0), simulated it at constant temperature, and, finally,
computed EJ= 1 L3NS X t∈S hH(t)iJ, [7]
where S is the set of the NStimes of the form t = (integer part of) 2n/8, with n integer and 219≤ t ≤ 221. Besides, we obtained a high-accuracy estimate of the same quantity, Eaccurate, by averaging over the results of a targeted simulation with 160,000 samples and 2 clones (i.e., the energy was averaged over 320,000 systems). The final estimates of the internal energy shown in Figs. 2–5 are
E(t) = Enaive(t) − [ EJ− Eaccurate]. [8]
The benefits of using the control variate are obvious from Fig. 7.
ACKNOWLEDGMENTS. We thank Raymond Orbach, Srikanth Sastry, and
Marija Vucelja for very interesting comments. This work was partially sup-ported by Ministerio de Econom´ıa, Industria y Competitividad, Spain, Grants FIS2013-42840-P, MTM2014-56948-C2-2-P, FIS2015-65078-C2, FIS2016-76359-P, TEC2016-78358-R, and MTM2017-84446-C2-2-R [grants were also partly funded by Fondo Europeo de Desarrollo Regional (FEDER)]; by Junta de Extremadura (Spain) Grants GRU18079 and IB16013 (partially funded by FEDER); and the Diputaci ´on General de Arag ´on–Fondo Social Europeo. This project has received support from the European Research Council under the European Union’s Horizon 2020 Research and Innovation Pro-gram Grants 694925 and 723955–GlassUniversality. D.Y. was supported by the Soft and Living Matter Program at Syracuse University. E.M. and D.Y. thank the Kavli Institute for Theoretical Physics and its “Memory Forma-tion in Matter” program, where contribuForma-tions to the present work were developed, and were supported by National Science Foundation Grant NSF-PHY-1748958.
APPLIED
PHYSICAL
SCIENCES
1. E. B. Mpemba, D. G. Osborne, Cool? Phys. Educ. 4, 172–175 (1969).
2. P. A. Greaney, G. Lani, G. Cicero, J. C. Grossman, Mpemba-like behavior in carbon nanotube resonators. Metall. Mater. Trans. A 42, 3907–3912 (2011).
3. Y. H. Ahn, H. Kang, D. Y. Koh, H. Lee, Experimental verifications of Mpemba-like behaviors of clathrate hydrates. Korean J. Chem. Eng. 33, 1903–1907 (2016). 4. Aristotle, Metaphysics (English Translation by W. D. Ross) (Clarendon, Oxford, UK,
1981).
5. M. Jeng, The Mpemba effect: When can hot water freeze faster than cold? Am. J.
Phys. 74, 514–522 (2006).
6. H. C. Burridge, P. F. Linden, Questioning the Mpemba effect: Hot water does not cool more quickly than cold. Sci. Rep. 6, 37665 (2016).
7. Z. Lu, O. Raz, Nonequilibrium thermodynamics of the Markovian Mpemba effect and its inverse. Proc. Natl. Acad. Sci. U.S.A. 114, 5083–5088 (2017).
8. A. Lasanta, F. Vega Reyes, A. Prados, A. Santos, When the hotter cools more quickly: Mpemba effect in granular fluids. Phys. Rev. Lett. 119, 148001 (2017).
9. I. Klich, O. Raz, O. Hirschberg, M. Vucelja, The Mpemba index and anomalous relaxation. arXiv:1711.05829v3 (18 December 2018).
10. A. J. Kovacs, J. J. Aklonis, J. M. Hutchinson, A. R. Ramos, Isobaric volume and enthalpy recovery of glasses. ii. A transparent multiparameter theory. J. Polym. Sci. Polym. Phys.
Ed. 17, 1097–1162 (1979).
11. Y. Lahini, O. Gottesman, A. Amir, S. M. Rubinstein, Nonmonotonic aging and memory retention in disordered mechanical systems. Phys. Rev. Lett. 118, 085501 (2017). 12. C. L. E. Struik, Physical Aging in Amorphous Polymers and Other Materials (Elsevier,
Amsterdam, The Netherlands, 1980).
13. D. Fiocco, G. Foffi, S. Sastry, Encoding of memory in sheared amorphous solids. Phys.
Rev. Lett. 112, 025702 (2014).
14. A. Prados, E. Trizac, Kovacs-like memory effect in driven granular gases. Phys. Rev.
Lett. 112, 198001 (2014).
15. R. K ¨ursten, V. Sushkov, T. Ihle, Giant Kovacs-like memory effect for active particles.
Phys. Rev. Lett. 119, 188001 (2017).
16. T. Sasaki, Y. Ukyo, P. Nov ´ak, Memory effect in a lithium-ion battery. Nat. Mater. 12, 569–575 (2013).
17. K. Jonason, E. Vincent, J. Hammann, J. P. Bouchaud, P. Nordblad, Memory and chaos effects in spin glasses. Phys. Rev. Lett. 81, 3243–3246 (1998).
18. A. P. Young, Spin Glasses and Random Fields (World Scientific, Singapore, 1998). 19. M. Baity-Jesi et al., Janus II: A new generation application-driven computer for
spin-system simulations. Comp. Phys. Commun. 185, 550–559 (2014).
20. E. Marinari, G. Parisi, J. Ruiz-Lorenzo, F. Ritort, Numerical evidence for spontaneously broken replica symmetry in 3D spin glasses. Phys. Rev. Lett. 76, 843–846 (1996).
21. L. Berthier, J. P. Bouchaud, Geometrical aspects of aging and rejuvenation in the Ising spin glass: A numerical study. Phys. Rev. B 66, 054404 (2002).
22. M. Baity-Jesi et al., A statics-dynamics equivalence through the fluctuation– dissipation ratio provides a window into the spin-glass phase from nonequilibrium measurements. Proc. Natl. Acad. Sci. U.S.A. 114, 1838–1843 (2017).
23. M. Baity-Jesi et al., Matching microscopic and macroscopic responses in glasses. Phys.
Rev. Lett. 118, 157202 (2017).
24. F. Belletti et al., An in-depth view at the microscopic dynamics of Ising spin glasses at fixed temperature. J. Stat. Phys. 135, 1121–1158 (2009).
25. M. Baity-Jesi et al., Aging rate of spin glasses from simulations matches experiments.
Phys. Rev. Lett. 120, 267203 (2018).
26. S. Guchhait, R. L. Orbach, Magnetic field dependence of spin glass free energy barriers. Phys. Rev. Lett. 118, 157203 (2017).
27. M. Baity-Jesi et al., Critical parameters of the three-dimensional Ising spin glass. Phys.
Rev. B 88, 224416 (2013).
28. Q. Zhai et al., Glassy dynamics in CuMn thin-film multilayers. Phys. Rev. B 95, 054304 (2017).
29. L. A. Fern ´andez, V. Mart´ın-Mayor, Testing statics-dynamics equivalence at the spin-glass transition in three dimensions. Phys. Rev. B 91, 174202 (2015).
30. L. A. Fernandez, V. Mart´ın-Mayor, Mean-value identities as an opportunity for Monte Carlo error reduction. Phys. Rev. E 79, 051109 (2009).
31. G. Parisi, Statistical Field Theory (Addison-Wesley, Boston, MA, 1988).
32. S. Boettcher, Stiffness of the Edwards-Anderson model in all dimensions. Phys. Rev.
Lett. 95, 197205 (2005).
33. L. A. Fern ´andez, E. Marinari, V. Mart´ın-Mayor, G. Parisi, J. Ruiz-Lorenzo, An experiment-oriented analysis of 2D spin-glass dynamics: A twelve time-decades scaling study. J. Phys. A Math. Theor. 52, 224002 (2019).
34. L. A. Fern ´andez, E. Marinari, V. Mart´ın-Mayor, G. Parisi, J. Ruiz-Lorenzo, Out-of-equilibrium 2D Ising spin glass: Almost, but not quite, a free-field theory. J. Stat.
Mech. Theor. Exp. 2018, 103301 (2018).
35. T. S. Grigera, N. E. Israeloff, Observation of fluctuation-dissipation-theorem violations in a structural glass. Phys. Rev. Lett. 83, 5038–5041 (1999).
36. N. E. Israeloff, M. B. Weissman, G. J. Nieuwenhuys, J. Kosiorowska, Electrical noise from spin fluctuations in CuMn. Phys. Rev. Lett. 63, 794–797 (1989).
37. A. Cavagna, Supercooled liquids for pedestrians. Phys. Rep. 476, 51–124 (2009). 38. S. F. Edwards, P. W. Anderson, Theory of spin glasses. J. Phys. F Met. Phys. 5, 965–974
(1975).
39. S. F. Edwards, P. W. Anderson, Theory of spin glasses. II. J. Phys. F Met. Phys. 6, 1927– 1937 (1976).