DISI - Via Sommarive, 14 - 38123 POVO, Trento - Italy http://disi.unitn.it
Unsupervised Learning of True
Ranking Estimators using the Belief
Function Framework
Andrea Argentini Enrico Blanzieri
June 2011
Technical Report # DISI-11-480
This work has been presented at 11th European Conference on Symbolic and Quantitative Approaches to Reasoning with Uncer-tainty (ECSQARU) as poster
Unsupervised Learning of True Ranking
Estimators using the Belief Function
Framework
Andrea Argentini
∗, Enrico Blanzieri
Dipartimento di Ingegneria e Scienza dell’informazione
Universit`
a di Trento
{argentini,blanzier}@disi.unitn.it
Abstract
A variant of the ranking aggregation problem is considered in this work. The goal is to find an approximation of an unknown true rank-ing given a set of rankrank-ings. We devise a solution called Belief Rankrank-ing Estimator (BRE), based on the belief function framework that permits to represent beliefs on the correctness of the rankings position as well as uncertainty on the quality of the rankings from the subjective point of view of the expert. The results of a preliminary empirical compar-ison of BRE against baseline ranking estimators and state-of-the-art methods for ranking aggregation are shown and discussed.
1
Introduction
The ranking aggregation task originates from the necessity to aggregate dif-ferent and possibly contradictory rankings of a finite set of items. Given several rankings as input, the goal is to find a new ranking that minimize the distance to each of the ranking in the input set [2]. The problem of ranking aggregation emerges when it is necessary to combine the opinion of experts with different background, such as the combination of movie preferences, or
∗Corresponding Author
the combination of web engine results of a queries. Ranking aggregation solution takes also in consideration the uncertainty associated to the data when this is available, as in the context of sensor network data or tracking moving objects [6].
In our work we consider a variant of the problem of ranking aggregation, that is when the goal is to find a satisfying approximation of an unknown true ranking given a usually-low number of rankings that are assumed to be diverse-quality estimations of the true ranking. The main difference with respect to the usual ranking aggregation problems met in case of preferences or queries results combination is that we assume that the true ranking over the set of items do exists. We claim that this is the case when the rank-ings comes from bioinformatics rankers because of the underlying physical reality of the unknown biological phenomenon at hand. Moreover and with the same motivation we assume the rankings to be permutations of a big but finite set of known items. To treat this problem we have to consider data fusion aspects where rankings from different experts are combined to produce a new ranking and also the uncertainty related to the elements of the ranking. Finally, the evaluation of the solution methods has to take into account correlation and distance with respect to the true ranking.
In this paper we devise a solution to the ranking aggregation problem based on belief function heory. The belief function theory provides a robust frame-work for reasoning with imprecise and uncertainty data, allowing the mod-eling of subjective knowledge in a non Bayesian way. Belief function has been applied on machine learning problems such as clustering, classification [7] and data fusion under uncertainty. To the best of our knowledge, ap-plication of belief function on a ranking aggregation problem has not yet been proposed. Our solution, called Belief Ranking Estimator (BRE), es-timates in an unsupervised way the true ranking given a set of estimating ranked permutations. Our approach models the uncertainty relying only on the ranking values, without using any other external information such as the confidence of the expert. We test the methods over synthetic data, com-paring our method against some baseline and competitor methods and we provide also a discussion of the related work. The paper is organized as fol-lows. In the following section we briefly present belief function framework. One section is devoted to the presentation of our method and another to the empirical results. Finally, we draw some conclusions.
2
The Belief Functions Theory
The theory of the belief functions, also known as Dempster-Shafer theory, is based on the pioneering work of Dempster [1] and Shafer [4]. More recent advances of this theory has been introduced in the Transferable Belief Model (TBM), proposed by Smets [5]. The three main ingredients of the framework are the basic belief assignment (bba), belief functions and plausibility func-tions. The basic belief assignment is the way to represent the believes held by an expert regarding the values of a variable in a finite domain. We define Θ, called the frame of discernment, as the set of propositions exclusive and exhaustive in a certain domain. Let 2Θ denote the set of the subsets of Θ. A
function m : 2Θ→ [0, 1] is called basic belief assignment (bba) if it satisfies : ∑
A⊆Θm(A) = 1 In order to combine distinct sources m1, . . . , mn on Θ, the
belief function provides several combination rules, such as conjunctive rules, disjunctive rules and caution rules [5]. One of the most used rules, is the conjunctive rules defined as: m1 ∩2(A) =
∑
B∩C=Am1(B)m2(C) A ⊆ Θ.
The conjunctive rule is justified when all the sources of belief are supposed to assert the truth and to be independent. For belief function theory is a generalization of probability in a Bayesian setting, homologous of the condi-tioning and marginalization rules are expressed in the framework. In order to make decision dealing with belief functions, in the TBM is used the pig-nistic transformation [5] which transforms a mass function into a probability function Betp defined as: Betp(ω) = ∑A⊆Θ1−m(φ)|A|m(A) ∀ω ∈ Θ.
3
Method
3.1
Notation and Definition of the Problem
Let X = {x1, . . . , xn} a set of elements to be ranked by an expert
opin-ion. We denote as τ = (τ (1), . . . , τ (n)) a ranking associated to X, where
τ (i) is the rank associated to the element xi. We suppose to have τTrank =
{τTrank(1), . . . , τTrank(n)}, the golden Truth Ranking on the element of X, and we denote as Rj the expert involved in the ranking, so for each expert
we have a corresponding ranking τRj = {τRj(1), . . . , τRj(n)}. We suppose also that the most important element for a ranker Rj receives a ranking value
near to n instead of 1. The problem in its general form is stated as follows. Given N rankings τRj of length n of the n items X = {x
1, . . . , xn}, namely
Algorithm 1 Belief Ranking Estimator
input I=τ1, . . . , τN {a vector of N Rankings} input T {Numbers of iterations}
k= 1
BE=ComputeBelief From Rankings(I)
while k != T +1 do W=ComputeWeight(I) BE=ApplyWeight(W,BE) F inalRankk=Combination(Bmod) I[pos(max(W))]=F inalRankk k++ end while output F inalRankk
permutations, that estimate with unknown quality the unknown true ranking
τTrank find a ranking that estimates the true ranking.
3.2
Belief Ranking Estimator
The Belief Ranking Estimator (BRE) method is an unsupervised algorithm that iteratively learns an estimation of an unknown Truth Ranking, given a sample of rankings that are permutations of the items of the Truth Ranking assumed to be approximations of the Truth Ranking of unknown quality. As showed in Alg. 1 the input parameters are the rankings and the number of iterations. The algorithm is structured in the following parts: the mapping of the rankings into belief functions (ComputeBelief From Ranking), the weight computation from the Truth estimator (ComputeWeight), the application of the weight to current belief model of the rankers (ApplyWeight), finally the output ranking is produced by the combination of all the bba of the rankings. After the first iteration, the method replaces the ranking with the maximum weight, with the combined ranking produced in the previous iteration. At each iteration, this replacement drives the methods to combine rankings that are supposed to be better than the original worst ranking, and to produce as output a better estimator. With a number of iterations T , please note that the number of replacements is T − 1. A not weighted version of our method BRE− NW , is also evaluated in this work. BRE − NW combines the belief distribution of the rankers given in input, without the application of the weights. We refer as weighting schema to the BRE − 1T version.
BBA from the rankings: For our problem, we consider a simple frame of
discernment Θ = {P, ¬P }, where P , ¬P are the hypothesis that a ranked element is in the right position or not respectively. Given a set of N rankings
τ1, . . . τj, . . . , τN of the same n elements, the bba of the j-th ranking on the
i-th element is assigned as:
mji(P ) = τj(i) n mji(¬P ) = 0 mji(Θ) = 1− τj(i) n (1)
The bba definition reflects the fact that the high-ranking elements should have more belief to be in the right position from the point of view of the expert who expressed the ranking. Since the lack of external information about the correctness of the ranking we are not able to assert if an element is not in the right position (¬P ), the remain belief is assigned consequently to the uncertainty about the two possible hypothesis, namely to Θ.
Weight Computation: The weight of the rankings are computed as the
nor-malized values of the Spearman footrule distance [2] between the rankings and the mean ranking as in the following formula: Wj = D(τ
j,M )
1
2n2 ∀j ∈ 1..N.
Where D(· , · ) is the Spearman distance defined over two rankings τ,σ as
D(π, σ) = Σn
i=1| π(i) − σ(i) | and M is the mean ranking. Since weight
val-ues are in the interval [0, 1], rankings are estimated to be similar or dissimilar to the estimator when the weight values go to 0 or tend to 1 respectively. According with this, the worst rankers will have the higher weight values.
Discounting of the BBA: The application of the weights to the correspondent
mass distribution of the rankings is computed in the ApplyWeight method, as following:
if Wj = minjW if Wj 6= minjW
m0ji(P ) = mji(P ) + (Wj∗ mji(Θ)) m0ji(P ) = 1− m0ji(Θ)
m0ji(¬P ) = 0 m0ji(¬P ) = 0
m0ji(Θ) = 1− m0ji(P ) m0ji(Θ) = mji(Θ) + (Wj∗ mji(P ))
where m0ji are the discounted bba of the j-th ranking on the i-th element. The idea is to reduce the uncertainty, proportionally to the correspondent weight for the best rankings (namely, the ranking with minimum weight), and to increase the uncertainty for all the other rankings.
Combination: All the masses of the rankings are combined, using the
Con-junction rule (Sec. 2) obtaining a new mass distribution that contains the belief expressed in all the rankings. The use of the conjunctive rule is jus-tified when all the sources of belief are supposed to tell the truth and to be
independent. These requirements are fully satisfied here, since we suppose that the rankings are independent and all rankings are totally reliable be-cause the unsupervised context does not allow to make other assumptions on their quality. Finally, we apply the Pignistic Transformation (Sec. 2) to the combined belief distribution in order to produce the output ranking. Fi-nal ranking O = (O(1), . . . , O(i), . . . , O(n)) is produced by ranking all the elements with respect to the BetPi(P ). Althought there is no theoretical
constraint about the number of iterations, we propose as number of iteration at least T = N2 + 1 (refered as BRE-MAXT). The rational of this rule of the thumb is that replacing more then one half of the original rankings can possibly lead to poor performance due to the replacement of some of the best rankings with information affected by the worse ones.
4
Experimental Results on Synthetic Data
In this section we describe the results of an evaluation test on synthetic data that suits perfectly the problem at hand. The aim of this series of experi-ments is to evaluate the ranking produced by our method with respect to the mean and the median of the rankings in input and the optimal aggregated list [2]. The performance are measured with Spearman correlation coefficient (re-ferred to as ρ,[3]) and with normalized Spearman footrule distance (re(re-ferred to as D) computed with respect to the Truth Ranking (Trank). For all the
synthetic data experiments, the input rankings are randomly generated un-der the constraint to exhibit fixed values of ρ with a fixed ranking Trankof 300
elements. In order to have more reliable results we performed 10 independent replicas of the procedure using the same generation parameters. We generate our data in order to combine a number of rankings N equals to 3,10,30. For each N value, we propose different cases that correspond to different values of
ρ of the ranking with respect to the Trank. With N = 3 we define 4 different
cases: (case 1 ) 1 ranker extremely good (ρ=.80) with respect to the other (ρ=.06,ρ=.01), (case 2 ) two good rankers (ρ = .60, .40) and a very poor one (ρ=.01), (case 3 ) 3 rankers with high correlation (ρ=.80,.60,.10), (case 4 ) 3 rankers with poor correlation (ρ=.01, .06, .03). With N = 10 and N = 30, three cases good, equal and poor are defined. In the case good the 80% of the rankers are highly informative (ρ ∈ [0.95, 0.70]) and the remaining 20% are low informative (ρ ∈ [0.30, 0.1]). In the case equal the rankers are equally distributed among the three types: highly, medium (ρ ∈ [0.70, 0.30]) and
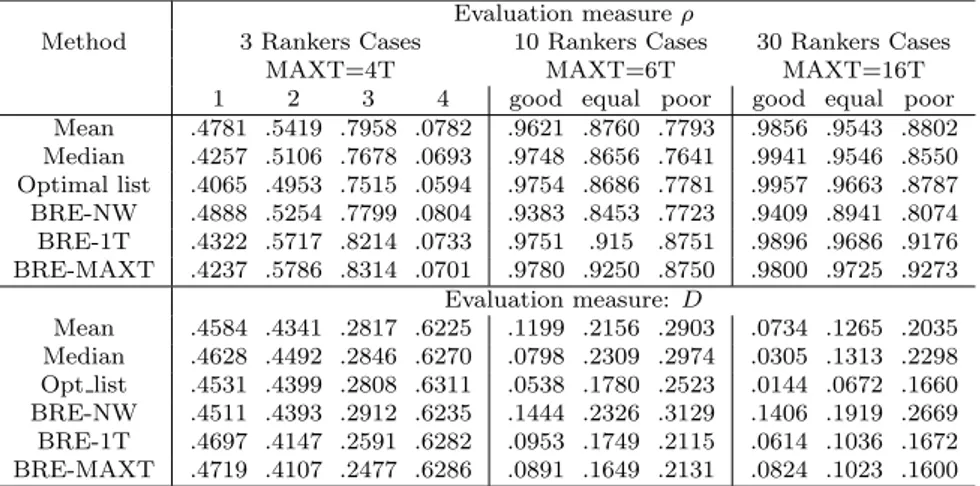
Table 1: The result of BRE and the other competitors w.r.t. the Truth Ranking for all cases of combination of 3, 10 and 30 rankers.
Evaluation measure ρ
Method 3 Rankers Cases 10 Rankers Cases 30 Rankers Cases MAXT=4T MAXT=6T MAXT=16T 1 2 3 4 good equal poor good equal poor Mean .4781 .5419 .7958 .0782 .9621 .8760 .7793 .9856 .9543 .8802 Median .4257 .5106 .7678 .0693 .9748 .8656 .7641 .9941 .9546 .8550 Optimal list .4065 .4953 .7515 .0594 .9754 .8686 .7781 .9957 .9663 .8787 BRE-NW .4888 .5254 .7799 .0804 .9383 .8453 .7723 .9409 .8941 .8074 BRE-1T .4322 .5717 .8214 .0733 .9751 .915 .8751 .9896 .9686 .9176 BRE-MAXT .4237 .5786 .8314 .0701 .9780 .9250 .8750 .9800 .9725 .9273 Evaluation measure: D Mean .4584 .4341 .2817 .6225 .1199 .2156 .2903 .0734 .1265 .2035 Median .4628 .4492 .2846 .6270 .0798 .2309 .2974 .0305 .1313 .2298 Opt list .4531 .4399 .2808 .6311 .0538 .1780 .2523 .0144 .0672 .1660 BRE-NW .4511 .4393 .2912 .6235 .1444 .2326 .3129 .1406 .1919 .2669 BRE-1T .4697 .4147 .2591 .6282 .0953 .1749 .2115 .0614 .1036 .1672 BRE-MAXT .4719 .4107 .2477 .6286 .0891 .1649 .2131 .0824 .1023 .1600
low informative. Finally, the case poor is similar to the good one, but with inverted percentages of highly and low informative rankers. For N = 10, 30 ρ of the generated rankings with respect to Trank are randomly chosen within
the defined intervals. Taking into account ρ in Tab 1, BRE with weight-ing schema outperforms all the three competitors in the case 2,3 (N=3) and in all the three cases for N=10. For N=30 (good case) BRE outperforms the mean but not the median and the optimal list that show slightly better values. With regard to the iterative process, BRE-MAXT outperforms all the competitors with a notable difference in most of the cases, exept in the good case (N=30) and cases 1,2 (N=3). Taking into account D, BRE-1T and BRE-MAXT shows the same performance for N=3 as with ρ. For N=30 (all cases) BRE-1T outperforms only the median and the mean but not the optimal list that shows always low D values. These preliminary results show the significant performance of BRE w.r.t the competitors using both evalua-tion measures. We point out that BRE-MAXT in the poor cases is the best estimator of the Truth Ranking.
5
Conclusion
In this work we have presented preliminary results on the Belief Ranking Es-timator, an unsupervised method that estimates a true ranking given a set of estimating ranked permutations. BRE, through the use of the belief
tion framework, models the uncertainty of each ranking and combine them according to weights computed as distances from the mean of the rankings. From results on synthetic data, with low-quality input a variant of BRE has provided better estimation of the true ranking with respect to the mean the median and optimal aggregated lists used as competitor method. As future work, we plan to extend BRE to the aggregation of top-k lists.
References
[1] A. P. Dempster. Upper and lower probabilities generated by a random closed intervals. The Annals of Mathematical Statistics, 39:957–966, 1968. [2] C. Dwork, R. Kumar, M. Naor, and D. Sivakumar. Rank aggregation methods for the web. In Proceedings of the 10 th WWW conference, pages 613–622, 2001.
[3] M.G. Kendall and J.D. Gibbons. Rank correlation methods. Oxford Uni-versity Press, 1990.
[4] G. Shafer. A Mathematical Theory of Evidence. 1976.
[5] P. Smets and R. Kennes. The Transferable Belief Model. Artificial
Intel-ligence, 66(2):191–234, 1994.
[6] M.A. Soliman, I.F. Ilyas, and S. Ben-David. Supporting ranking queries on uncertain and incomplete data. The VLDB Journal, 19(4):477–501, 2010.
[7] Z. Younes, F. Abdallah, and T. Denœux. An evidence-theoretic k-nearest neighbor rule for multi-label classification. Scalable Uncertainty