UNIVERSITY
OF TRENTO
DEPARTMENT OF INFORMATION AND COMMUNICATION TECHNOLOGY
38050 Povo – Trento (Italy), Via Sommarive 14
http://www.dit.unitn.it
A LOCATION-DEPENDENT RECOMMENDER SYSTEM
FOR THE WEB
Mauro Brunato, Roberto Battiti,
Alessandro Villani and Andrea Delai
November 2002
1
A Location-Dependent Recommender System for
the Web
Mauro Brunato
Roberto Battiti
Alessandro Villani
Andrea Delai
DIT — Dipartimento di Informatica e Telecomunicazioni Universit`a di Trento — via Sommarive 14, I-38050 Povo (TN) — ITALY
brunato|battiti|avillani|[email protected]
Abstract— A relevant piece of information in many
context-aware applications for wireless and mobile users is the user’s cur-rent location. Knowledge of the position, when combined with the user preferences, permits efficient service (or product) location, location-dependent alerting, and location-aware recommendation systems.
We propose a recommendation system that is based on a stan-dard web browser and where models determining the relevance of a given URL in a given region are derived in an automated and adaptive way through the collaboration of users of the sys-tem. With respect to existing location-dependent recommendation systems, the advantage of our proposal lies in the reduced effort re-quired for system development and in the increased independence of the recommendation from the services (or products) owners. Af-ter an initial tuning phase, a specific URL will be recommended to a user in a given location in a way that considers where and how often it was accessed by the previous users.
In detail, a new middleware layer, the location broker, collects a historic database where user positions and links used in the past are analyzed to develop models relating resources to their spatial usage pattern and to calculate a preference metric when the cur-rent user is asking for recommendations.
The focus of this work is on scalability issues. When the sys-tem is used in a wide area (possibly covering a sizable fraction of the entire web), the size of the database and the complexity of the models increase very rapidly. In an ubiquitous computing scenario where a multitude of wirelessly interconnected system surround a mobile user, the number of resources in an explored region may easily grow to contain thousands or millions of items. We describe a suitable data structure that permits scalability and analyze the empirical computational complexity both on a simulated scenario and in a real-world context in our province1.
Index Terms—Mobile devices, Context-aware computing,
Rec-ommender systems, Collaborative filtering, Spatial databases
I. INTRODUCTION
There is a growing consensus that the new tools for supporting mobile and wireless applications have to be developed in a user-centric way. Unless the cognitive burden required to receive the information that is appropriate in a given context is substantially reduced, the average user is not willing to spend time in tuning the system, selecting information from a small output device and entering large amounts of data through cumbersome interfaces. Adaptive context-aware system need to develop models of the rel-evance of different resources (e.g. URLs) for a specific user, and to filter the information so that only a small selection of relevant and limited resources is presented.
The location is of course a critical component of the context for mobile users. The introduction of small pocket- and tablet-sized 1This research is partially supported by the Province of Trento (Italy) in the framework of the WILMA (Wireless Internet and Location Management) project (http://www.wilmaproject.org/).
computers, and the contemporary blossoming of wireless network-ing solutions, from IEEE802.11b (a.k.a. Wi-Fi) to 3G cellular sys-tems, is forcing a rapid change of paradigm in the area of service provisioning. In particular, the traditional notions that the user’s location is fixed and relatively unimportant, and that the user can afford a lot of key-typing in order to access useful information, is not true anymore. A recommendation system, taking into account location and other data, and providing a few links that are con-sidered most interesting to the user in a particular context, would provide an agile and flexible environment for a mobile user. This system can be an ideal complement to methods providing dynamic customization of content for wireless clients [1], once the relevant links are selected.
Location-aware mobile commerce systems are considered for example in [2], location-aware shopping assistance is described in [3]. A mapping of physical locations to Internet URIs is proposed in HP’s CoolTown project2. Relevant locations are equipped with short-range infrared emitters that periodically broadcast their re-lated URI to listening mobile devices. The virtual extension of this project, Websigns [4], works by interfacing to a number of posi-tioning systems without actually installing the beacons: the user’s position, detected via GPS, is sent to a central server, which ex-tracts all items whose direction and distance fall within some item-dependent intervals. The server sends the links to a client pro-gram on the user’s PDA; a graphical front-end allows the user to choose a link and open a browser window. The context of perva-sive computing in a wireless Internet framework is also explored by our WILMA Project3(Wireless Internet and Location
Manage-ment) at the University of Trento, where thePILGRIM location-broker and mobility-aware recommendation system has been re-cently proposed. This papers deals with scalability issues to make the system available for a global use in the Internet, where the number of resources in the system database may easily grow to reach millions of items.
The rest of the paper is organized as follows. In Section II, a short survey of currently available recommender systems is pre-sented. In Section III a model for describing the preferences of mobile users is presented, together with an overview of the archi-tecture of thePILGRIM(Personal Item Locator and General Rec-ommendation Index Manager) system. In Section IV the ER-tree, a spatial indexing structure tailored for the requirements of the PILGRIMsystem, is introduced and motivated. Section V is de-voted to experimental evaluation of the ER-tree structure in simu-lated random environments. Finally, in Section VI conclusions are drawn.
II. RECOMMENDATION SYSTEMS
A typical recommendation system [5] answers the question: “What are thek more interesting items for the current user?”
2http://cooltown.hp.com/ 3http://www.wilmaproject.org/
For this purpose, user and item profiles are scanned and similarity techniques are employed to determine the most relevant items.
Techniques of collaborative filtering can be introduced where user profiles and evaluations are stored and used to automati-cally build a list of links specifiautomati-cally tailored for a particular user. Many recommendation systems, such as Tapestry [6] or Fab [7], require users to express their evaluation of the visited item, while others can gather implicit information. For example, the Grou-pLens [8] USENET news recommendation system uses reading times as a user interest measure. PHOAKS [9] uses data min-ing techniques to extract URLs or other information pointers from USENET postings or from bookmark collections.
A recommendation system maintains a finite list of users, iden-tified by unique IDs. Each user is associated to some profile infor-mation. A list of items, for instance web links, is also maintained along with relevant properties. The term current user will identify the user whom the recommendation list is being built for.
Item ranking techniques are often based on comparison of user profiles (user-based filtering), which may include information pro-vided by the user (his/her work, hobbies, last readings, and so on), or just a list of recently selected items. The current user profile is compared with all others, and the closest matches are used to build a plausible “top-k” item list. User profile comparison is a
time-consuming procedure, and smart data structures need to be implemented in order to manage a large population.
A different class of recommendation systems is based on item comparison (item-based filtering) [10], [11], [12]: items are scanned, and each of them is evaluated via the question: “How rel-evant is this item for the user?”. The question is answered through similarity with other items that were selected by the same user, and similarity between two items is in turn evaluated by consider-ing how many users have selected both. Item profiles, takconsider-ing into account explicit user evaluation, overall number of selections or the time of permanence of the user in the related web page, can also be considered in ranking. Many variants and combinations are possible between these two classes of algorithms.
III. ALOCATION-AWARE MODEL OF USER PREFERENCES
FOR WEB SITES
ThePILGRIMrecommendation system [13] generates recom-mendation lists based on the user location and on web site infor-mation gathered from previous usages of the same sites by other people. For completeness we briefly summarize thePILGRIM ap-proach in the current section.
A location-aware recommendation system should be able to produce a top-k items list for a given user whose location is known
with a precision ranging from a few meters to some hundreds of meters. Position estimates can be obtained by means of many sys-tems, such as GPS (outdoor only, with a precision of about 10m), active badges [14], [15] (precisions ranging from few centimeters to room size), or by exploiting the radio propagation properties of the wireless networking medium [16], [17], [18] (with precisions of few meters in the Wi-Fi case). The latter solution is of particu-lar interest because it does not need additional infrastructure, and the normal networking equipment is used both for communication and for location detection.
A mobile user is likely to handle the PDA only for the time that is strictly needed to find an interesting link and follow it and may not be willing to fumble with the device in order to give an explicit evaluation of the chosen item. So, only implicit information about the choice can be gathered:
• Was the presented item clicked or not? • How long has the page remained on screen?
• What was the subsequent action of the user (she abandoned the site, or she visited also linked pages)?
In a mobile environment, however, another crucial piece of in-formation is the following:
• What was the user position when she clicked the link?
Location DB Browser Discovery User Tracker Recommendation Engine
Internet
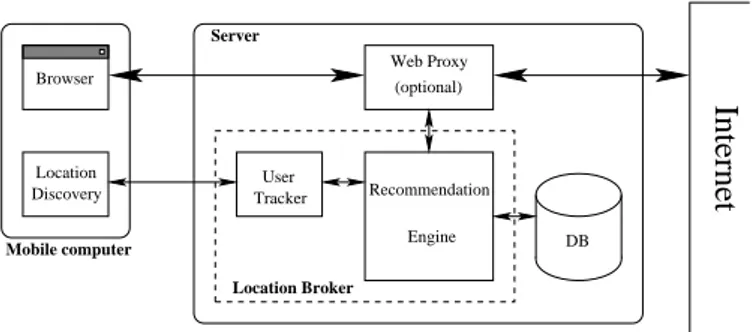
Location Broker Mobile computer Server Web Proxy (optional)Fig. 1. Architecture of thePILGRIMsystem.
The purpose of thePILGRIMsystem is to integrate information about the current user location into traditional recommendation systems in an adaptive way.
A. Architecture of the system
ThePILGRIMsystem is structured as an automated learning component to develop models relating resources to their spatial usage pattern by mining the historic database that records past accesses to sites.
The basic building blocks of the system are shown in Figure 1. On the client side, possibly a PDA with low computing speed, two components are active. The first is the normal off-the-shelf Inter-net browser, and it is the only component that the user sees on the screen during normal operation. The second component, the
loca-tion discovery applicaloca-tion, is a small process that enables the PDA
to obtain positioning data and to send them to the server; for in-stance, radio signal strength from surrounding Wi-Fi access points or raw GPS data. This module is mostly transparent to the user; it will only display a startup dialog for initialization purposes, for example to change privacy settings. The two components are in-dependent: the system could take advantage from an integrated solution, but this may not be applicable to all systems. For in-stance, many lightweight browsers in use on PDAs do not allow component technologies such as Java or ActiveX, and even script-ing languages may not be supported.
The location discovery application running on the client sends position updates to the server-side location broker. This is in turn composed of two components. The first, the user tracker, is in charge of computing the location data transmitted by the client in order to obtain a good estimate of the user position and to track the user’s movement (due to power and CPU limitations, it may be impractical for the PDA to compute the precise location, and only raw data are transmitted to the server). The second component, the recommendation engine, is the core of the system: it maintains the access database, containing data about what links have been followed, and from what physical position. These data, together with the user’s location provided by the user tracker module, are employed to generate a list of possibly interesting links.
B. Collaborative filtering and ranking procedure
Once the database is populated with past user accesses to items, its data can be used to build a model of user preference. Thus, the chosen approach considerably differs from other systems such as Websigns, where the database is updated and maintained by hand, and is more similar to the collaborative filtering paradigm, where the quality of recommendations shapes up as long as users interact with the system.
The models relating resources (URLs) and usage patterns in physical space are expressed in terms of a metric based on
iner-tial ellipsoids. The basic motivation is that of obtaining a smooth
metric, where the spatial distribution of interest for a specific URL may have a preferred orientation in space.
3
The recommendation engine works on a set ofs links, each
iden-tified by a unique idl = 1, . . . , s. Suppose that site l has been
vis-itedNltimes (possibly by different users), and let the set of points
Pl i = (x
l i, y
l
i), 1 ≤ i ≤ Nl, represent theNlphysical locations where linkl was clicked. A locality measure of link l can be
ob-tained by calculating the inertial ellipsoid of its points. Points can be associated to a “mass” that is related to the level of trust of the received feedback or to the length of time that a user spent on a web page. In the current version, for simplicity, all points are modeled as unit masses. The inertial ellipsoid has the following quadratic equation: `x − ¯xl y − ¯yl´ Ml−1 „x − ¯xl y − ¯yl « = 1,
wherex¯landy¯lare the coordinates of the center of mass, while matrixMlis the second-order moment matrix (the covariance ma-trix): ¯ xl= 1 Nl Nl X i=1 xli, y¯l= 1 Nl Nl X i=1 yil, Ml= 1 Nl 0 B B B B @ Nl X i=1 (xl i− ¯xl)2 Nl X i=1 (xl i− ¯xl)(yil− ¯yl) Nl X i=1 (xli− ¯xl)(yil− ¯yl) Nl X i=1 (yli− ¯yl) 2 1 C C C C A .
Because the matrix is positive definite, the matrixM−1 l defines a distance between pointsP = (xP, yP) and Q = (xQ, yQ):
dl(P, Q) =`xP − xQ yP − yQ´ Ml−1
„xP− xQ
yP− yQ
« .
Let ¯Pl= ( ¯xl, ¯yl) be the center of mass for site l. The distance dl can be used as a measure of interest of sitel for a user located at
positionP = (x, y). The preference for a site l at point P is defined
as:
rl(P ) =
1 dl(P, ¯Pl)
,
so that sitel is preferable to site l0
at pointP if rl(P ) > rl0(P ) (preference isrl(P ) = +∞ on the center of mass).
The set of preference functions(rl)1≤l≤sinduces at every point
P a permutation πP = (πP
1, . . . , πsP) of the site IDs having the property
∀i ∈ {1, . . . , s} rπP
i (P ) ≥ rπ P i+1(P ).
The permutation is uniquely defined modulo equalities of the pref-erence function; in this case, any tie-breaking rule, such as ID or-der, properly defines a unique permutation:
∀i ∈ {1, . . . , s} rπP i (P ) = rπ P i+1(P ) ⇒ π P i < π P i+1. The advantages of the ellipsoid metric with respect to simpler techniques can be understood by referring to Figure 2. Consider two candidate links. The first contains information about the sta-tus of a highway, and is mostly used by people driving along that road. Almost all accesses to the site have been performed along the highway. Because of the uni-dimensionality of the road, there is a strong correlation between the x and y coordinates of the
points (the small black squares in the figure), and the resulting ellipse, with the solid outline, has high eccentricity. Its preference function,rhighway(P ) decreases slowly when moving from the aver-age access position along the highway, while it drops very rapidly when moving outside the road. On the other hand, a restaurant placed near the highway, but not directly accessible, has a less ec-centric region of interest (the small black circles). The resulting
Access to highway server Access to restaurant site Highway ellipsoid Restaurant ellipsoid Restaurant
Highway
Fig. 2. Two sample sites with different access metrics, see text for explanation.
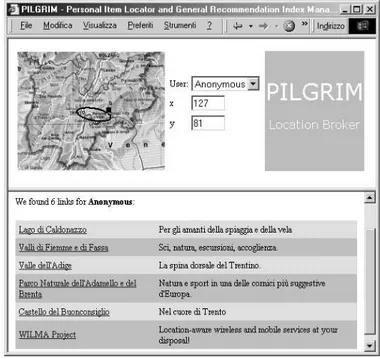
Fig. 3. Screenshot of the experimentalPILGRIMsystem. User identity, lo-cation and map are shown on the top frame; the bottom frame contains an item recommendation list; the ellipse in the map represents the inertial ellipsoid of the link under the mouse pointer.
ellipse, with a dashed outline, is less eccentric, even though it still shows a preferential direction, due to the physical visibility of the building, or to the terrain morphology. The preference function,
rrestaurant(P ), decays more regularly with distance from the center. Note that the center of the ellipse does not coincide with the restau-rant. In fact, no a priori information is built in the system, and the geographical relevance of a link is gradually inferred through the ellipsoid metric: every time a user clicks a link, the recommenda-tion engine updates the database; inertial ellipsoids are periodi-cally updated on the basis of the database records.
For a small number of database entries, a simple Euclidean dis-tance model is appropriate, while the ellipsoid model, being char-acterized by more parameters, achieves a better representation when the number of samples increases to reach about one hun-dred points [13]. For the above reasons, the ellipsoid metric is chosen in the current work. Different metrics can be considered with appropriate modifications. In particular, complex shapes can be modeled by associating to a resource a set of ellipsoids.
The system is being currently tested as a one-page web appli-cation. The different building blocks shown in Figure 1 are im-plemented as separate C++ classes (the location broker and the recommendation index generator) and collected into one ActiveX component working also as position display (the top left map in Figure 3). The component, written in C++ with the Microsoft Foundation Classes library, interacts with the standard HTML
0 500 1000 1500 2000 2500 -500 0 500 1000 1500 2000 2500 3000 3500 y (meters) x (meters) Ellipsoid User access coordinates
Fig. 4. Evolution in time of the compensated inertial ellipsoid representing the spatial distribution of users entering a site. Note that the initial estimate, the fixed-radius circle, is only based on the first access, and it can be off-center with respect to the overall distribution. Subsequent ellipses are shown every 10 steps.
form in the top frame of the browser to generate the recommenda-tion page in the bottom frame.
In order to have the system work with a small number of actual users, to avoid statistical fluctuations, the actual inertial ellipsoid is compensated by averaging with a fixed-radius circle having the same center. Letr be a default radius, for instance 1 kilometer;
then
Nr =„r
−2 0
0 r−2
«
is the matrix of the quadratic form associated to the circle of radius
r. The actual matrix used for the evaluation of the ellipsoid metric
of linkl is the weighted average
Ml0= wNlNr+ (1 − wNl)M −1 l ,
where the weight of the circlewNl∈ [0, 1] tends to 0 as the number of accesses to linkl increases. In the current implementation,
wn= e− n2
k ,
withk depending on the problem scale and on the desired
conver-gence rate.
Figure 4 shows the behavior of the compensated inertial ellip-soid for a site being accessed by 100 users, one at a time. The graph shows the evolution of the ellipsoid whenr = 1000m and k = 500: at the beginning, when the site is not yet very popular,
the circular default prevails (though the aspect ratio of the graph shows it as an ellipse); later, the actual inertial ellipsoid outweighs the default circle and the correct shape is reached. Note that the very first estimate, only depending on the first access, can be off center with respect to the rest of the distribution.
IV. THEER-TREE: A SCALABLE IMPLEMENTATION
ThePILGRIMrecommendation system relies on a site database recording the site name, URL, access statistics and preference el-lipsoid. To execute queries about site location, some spatial in-dexes must be implemented. The number of sites is bound to grow rapidly as the system develops and learns, and the basic algorithm based on a sequential scans of all items in order to find the nearest neighbors rapidly becomes impractical. Smarter data structures, specifically tailored for speeding up spatial queries need to be im-plemented.
Fig. 5. Determining a lower-bound ellipsoid metric
A wide range of spatial data structures has been proposed in the literature [19]. The data structure proposed in this paper is the ER-tree (Elliptic R-tree), an extension of the R-tree for the specific case ofk-nearest-neighbor queries with different elliptic metrics.
Th proposed structure is based on the R-tree structure [20]. Let
d be the number of spatial dimensions. The d-dimensional R-tree
is a hierarchy of nestedd-dimensional intervals. At each node,
the corresponding interval is the bounding box of intervals in its subtree. Leaves are the objects (or pointers to the objects) in the database. Every node is required to have more thanm and less
thanM sons, where m and M (m ≥ M/2) are parameters to be
adjusted; only the root is allowed to have as few as two sons. Algo-rithms to build the R-tree structure try to keep the tree in a good condition for queries by minimizing interval overlapping (which is in principle unavoidable). Point queries can be answered by re-stricting search only to branches whose bounding box actually en-close the point; nearest-neighbor queries can take advantage from branch-and-bound techniques. In fact, distance from a bounding box is a lower bound for distances from all enclosed objects.
The ER-tree data structure has been implemented in this work ford = 2. The indexed objects in the database are the centroids
of the ellipses, having pointwise extension. In the considered case, however, Euclidean distance from a bounding box is not a lower bound for the actual distances of the enclosed objects. In fact, in the aforementioned site model every site has a different elliptical metric. To make the lower bound work, every time a bounding box is calculated from the enclosed objects, a corresponding elliptical metric must be devised and applied.
Figure 5 shows how the overall metric for a bounding box is calculated. All ellipses for the enclosed objects are translated to the origin, and a “bounding ellipse” is built such that its major axis corresponds with the largest major axis of the ellipses, while the minor axis is calibrated in order to contain all ellipses. Since every ellipse represents the unit-distance locus for the correspond-ing metric, it is straightforward that the overall metric is a lower bound for all enclosed metrics. Every node in the tree contains, as an additional information, the overall metric corresponding to its bounding box.
Figure 6 shows part of an ER-tree, both by its actual spatial structure and by its tree representation. Node a is shown with its corresponding bounding box (the dashed rectangle) and its subn-odes (b to h). All subnsubn-odes, with the exception of d and g, contain objects, i.e. leaves of the ER-tree; nodes d and g contain lower-level nodes, which will be further decomposed. The thick line
surround-5 a c g e f b h d
a
b
c
h
d
e
f
g
Fig. 6. An ER-tree node (top) and corresponding ER-tree representation (bot-tom).
ing the bounding box of a is the locus of points having unit distance from the rectangle, and is determined by the overall metric of the node.
V. EXPERIMENTAL EVALUATION
To evaluate the performance of the data structure with respect tok-nearest-neighbor queries, some tests have been performed on
randomly-generated sites. On a square one-kilometer area a cer-tain numberN (100 to 100000) of sites are uniformly spread.
Ev-ery site is assigned an ellipse. The major axes of the ellipses fol-low a Gaussian distribution with given averageµ and standard
deviationσ. The inclination of the major axis and the eccentricity
are uniformly distributed, the first in the interval[−π/2, π/2), the
second in[emin, 1], where eminis the smallest admitted eccentric-ity. We used a distribution ofN = 100 sites with emin = 0.1 and
µ = σ = 100m.
The ER-tree depends on one parameterM , the node maximum
degree or “node size”, while the corresponding minimum for non-root nodes has been set tom = bM/2c. The nearest neighbors
search algorithm depends on the numberk of neighbors to be
re-turned.
Figure 7 shows the performance comparison between a linear search in an array of sites and the branch-and-bound search on the ER-tree for different distributions. Along thex axis the
num-ber of sites is reported; they axis represents the average
perfor-mance improvement obtained by the ER-tree search. Perforperfor-mance is tested by counting the number of distance evaluations. In fact, from preliminary experiments such as that shown in Table I we see that counting the number of evaluations gives a good measure of the actual time improvement, while time itself, when tested on a time-shared machine, can suffer from many external influences. Parameters of the test arek = 10, µ = 100m, emin = 1 (metrics
TABLE I
COMPARISON BETWEEN LINEAR ARRAY ANDER-TREE SEARCH FOR A 100000-SITE SAMPLE
R-tree Array Ratio % Differ.
Time (ms) 5.00 42.00 0.119 88.1% Distance evals 9672.8 100000 0.097 90.3% Memory (bytes) 22073344 21600000 1.022 2.2% 0 0.1 0.2 0.3 0.4 0.5 0.6 0.7 0.8 0.9 1 1.1 100 1000 10000 100000
Ratio vs. array search
Number of sites
sigma=100 sigma=10 sigma=1 sigma=0
Fig. 7. Comparison between linear array and ER-tree search for different item populations and different radius distributions.
are isotropic),M = 100. The different lines in the graph show the
behavior for different values ofσ. In particular for σ = 0 all sites
have exactly the same radius. In this case, all metrics are equiva-lent and the lower bound estimation on distances is more effective. Every point in the graph shows the average of 100 tests, and error bars indicate the 95% confidence interval. If radii are allowed to differ, up to aσ = 100m standard deviation, then performance
slightly degrades. Note that forN = 100 sites no improvements
are obtained, because ifN ≤ M only the root is filled and a
se-quential search over all sites is therefore performed. However, im-provements up to90% are obtained as the number of items grows
tN = 100000.
Figure 8 shows the same type of comparisons, where the stan-dard deviation of the major axis isσ = 100m, eccentricity varies
from a minimum ofemin= .1 and the different lines show how the performance changes if the ER-tree node size varies fromM = 10
toM = 200. Note that for small node sizes the advantage over
sequential search is almost negligible (ifN ≤ M all nodes must be
visited anyway). Small node sizes become unpractical for a large number of nodes, probably because the depth of the tree grows considerably, and a long downwards exploration must be under-taken before arriving to the leaves.
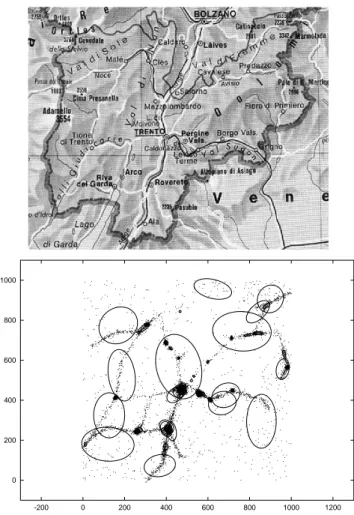
A second set of experiments has been performed in order to evaluate the performance of the system in a more realistic con-text. The population structure of the Trentino region, shown in the upper part of Figure 9, has bee used in order to generate a more structured pattern of web sites. Trentino is a mountain region with most people living within short distance from the bottom of the val-leys and concentrated near the main towns. The system is likely to be used also by people moving along roads, or by tourists spread along the whole territory. A simulated usage test withN = 100
web sites resulted in the pattern shown in the bottom part of Fig-ure 9. Most ellipsoids are concentrated in towns, but a few are of
0 0.1 0.2 0.3 0.4 0.5 0.6 0.7 0.8 0.9 1 1.1 100 1000 10000 100000
Ratio vs. array search
Number of sites
size=10 size=20 size=100 size=200
Fig. 8. Comparison between linear array and ER-tree search for different item populations and different node sizes.
wide interest: they may correspond to a famous resource or to a mountain visible from a large distance.
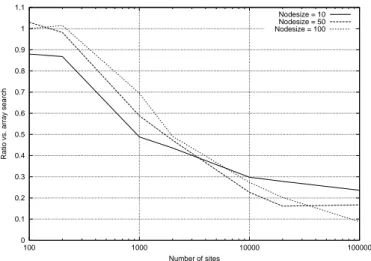
Figure 10 shows some preliminary comparisons between linear scans and ER-Trees for the simulated environment. Every point represents the average of 100 ten-nearest-neighbor searches, and the error bars show the 95% confidence interval for the mean. Note that the improvement with respect to linear scan is compa-rable to that obtained on the random distribution in Figures 7 and Figure 8.
VI. DISCUSSION AND CONCLUSIONS
We proposed a location-aware recommender system that is inte-grated with a basic browser and that filters resources (URLs) for a specific user. The filter is adaptive and takes into account both the
current user location and models relating resources to geographic
locations built by mining the previous history of usage. The main advantage with respect to existing systems lies in the automated creation of models (without an explicit design to couple locations and URLs), the flexibility and the independence from ad-hoc sys-tems realized by resource owners (that naturally tend to be biased, especially for mobile commerce related sites).
To allow a large degree of scalability demanded by a large scale implementation, a hierarchical data structure has been proposed and analyzed. The results on a model that considers the popula-tion and building distribupopula-tion of our region (Trentino) show that performance of the ER-tree structure does not degrade when im-plemented on a more structured pattern of usage.
Techniques to select the appropriate privacy level can be easily implemented. For example, if the user feels uneasy about commu-nicating her own precise location, the location discovery procedure on the mobile client can be set in order to add noise to the data that shall be transmitted to the location broker. In this case, the server may respond with a wider range of choices, to be refined by the client by using the exact position. This option requires a larger amount of communication and more CPU utilization by the client, so that a tradeoff among user privacy, response accuracy and bat-tery consumption must be sought.
A future issue on the agenda is the implementation as a dis-tributed system where local databases contain information about items close to the server location, and a peer-to-peer content dis-tribution scheme enables synchronization among all local servers. In addition, the integration of the location-broker with traditional recommendation system will permit specialized implementations (like for example a system dedicated to gourmet restaurants, to tourists interested in art and monuments, to mobile shopping, etc.). 0 200 400 600 800 1000 -200 0 200 400 600 800 1000 1200
Fig. 9. The Trentino region (above) and ellipsoids of interest for localized web sites (below: small dots represent distribution of single users; while many are concentrated in towns and valleys, some are spread throughout the territory).
VII. ACKNOWLEDGMENTS
REFERENCES
[1] J. Steinberg and J. Pasquale, “A web middleware architecture for dynamic customization of content for wireless clients,” in Proceedings of Eleventh International World Wide Web Conference - WWW2002, (Honolulu, Hawaii, uSA), May 2002.
[2] S. Duri, A. Cole, J. Munson, and J. Christensen, “An approach to providing a seamless end-user experience for location-aware appli-cations,” in Proceedings of the first international workshop on Mobile commerce, (Rome), pp. 20–25, July 2001.
[3] T. Bohnenberger, A. Jameson, A. Kr ¨uger, and A. Butz,
“User acceptance of a decision-theoretic, location-aware
shopping guide,” in IUI 2002: International Conference on
Intelligent User Interfaces (Y. Gil and D. B. Leake, eds.),
pp. 178–179, New York: ACM, 2002. Available from
http://dfki.de/∼jameson/abs/BohnenbergerJK+02.html.
[4] S. Pradhan, C. Brignone, J.-H. Cui, A. McReynolds, and M. T. Smith, “Websigns: Hyperlinking physical locations to the web,” IEEE Com-puter, pp. 42–48, Aug. 2001.
[5] P. Resnik and H. R. Varian, “Recommender systems,” Communica-tions of the ACM, special issue, vol. 40, pp. 56–58, Mar. 1997. [6] D. Goldberg, D. Nichols, B. M. Oki, and D. Terry, “Using
collabora-tive filtering to weave an information tapestry,” Communications of the ACM, Dec. 1992.
[7] M. Balabanoviˇc and Y. Shoham, “Fab: Content-based, collaborative recommendation,” Communications of the ACM, vol. 40, pp. 66–72, Mar. 1997.
[8] J. A. Konstan, B. N. Miller, D. Maltz, J. L. Herlocker, L. R. Gor-don, and J. Riedl, “GroupLens: Applying collaborative filtering to USENET news,” Communications of the ACM, vol. 40, pp. 77–87, Mar. 1997.
7 0 0.1 0.2 0.3 0.4 0.5 0.6 0.7 0.8 0.9 1 1.1 100 1000 10000 100000
Ratio vs. array search
Number of sites
Nodesize = 10 Nodesize = 50 Nodesize = 100
Fig. 10. Performance ratio of the R-tree data structure versus linear scan for different node sizes and different numbers of indexed sites.
[9] L. Terveen, W. Hill, B. Amento, D. McDonald, and J. Creter, “PHOAKS: a system for sharing recommendations,” Communica-tions of the ACM, vol. 40, pp. 59–62, Mar. 1997.
[10] B. Sarwar, G. Karypis, J. Konstan, and J. Riedl, “Item-based col-laborative filtering recommendation algorithms,” in Proceedings of WWW10, May 2001.
[11] M. O’Connor and J. Herlocker, “Clustering items for collaborative filtering,” tech. rep., University of Minnesota, department of Com-puter Science, Minneapolis, USA, 2000.
[12] G. Karypis, “Evaluation of item-based top-n recommendation algo-rithms,” tech. rep., University of Minnesota, Department of Com-puter Science / Army HPC Research Center, Minneapolis, USA, 2000. [13] M. Brunato and R. Battiti, “PILGRIM: A location broker and
mobility-aware recommendation system,” Tech. Rep. DIT-02-0092, Dipartimento di Informatica e Telecomunicazioni, Universit `a di Trento, Oct. 2002. submitted.
[14] R. Want, A. Hopper, V. Falcao, and J. Gibbons, “The active badge location system,” ACM Transaction on Information Systems, vol. 10, pp. 91–102, Jan. 1992.
[15] A. Harter, A. Hopper, P. Steggles, A. Ward, and P. Webster, “The anatomy of a context-aware application,” in Proceedings of MOBI-COM 1999, pp. 59–68, Aug. 1999.
[16] P. Bahl and V. N. Padmanabhan, “RADAR: An in-building RF-based user location and tracking system,” in Proceedings of IEEE INFO-COM 2000, pp. 775–784, Mar. 2000.
[17] T. Roos, P. Myllym ¨aki, H. Tirri, P. Misikangas, and J. Siev ¨anen, “A probabilistic approach to WLAN user location estimation,” Interna-tional Journal of Wireless Information Networks, vol. 9, July 2002. [18] R. Battiti, M. Brunato, and A. Villani, “Statistical learning theory
for location fingerprinting in wireless LANs,” Tech. Rep. DIT-02-0086, Dipartimento di Informatica e Telecomunicazioni, Universit `a di Trento, Oct. 2002.
[19] V. Gaede and O. G ¨unther, “Multidimensional access methods,” tech. rep., Institut f ¨ur Wirtschaftsinformatik, Humboldt-Universit ¨at zu Berlin, 1996.
[20] A. Guttman, “R-tree: A dynamic index structure for spatial search-ing,” in Proceedings of ACM SIGMOD, 1984.