R E S E A R C H A R T I C L E
Open Access
A colorectal cancer genome-wide association
study in a Spanish cohort identifies two variants
associated with colorectal cancer risk at 1p33 and
8p12
Ceres Fernandez-Rozadilla
1, Jean-Baptiste Cazier
2, Ian P Tomlinson
2,3, Luis G Carvajal-Carmona
4, Claire Palles
2,
María J Lamas
5, Montserrat Baiget
6, Luis A López-Fernández
7, Alejandro Brea-Fernández
1, Anna Abulí
8,9,
Luis Bujanda
10, Juan Clofent
11,12, Dolors Gonzalez
13, Rosa Xicola
14, Montserrat Andreu
8, Xavier Bessa
8,
Rodrigo Jover
15, Xavier Llor
14, The EPICOLON Consortium, Víctor Moreno
16, Antoni Castells
9, Ángel Carracedo
1,
Sergi Castellvi-Bel
9and Clara Ruiz-Ponte
1*Abstract
Background: Colorectal cancer (CRC) is a disease of complex aetiology, with much of the expected inherited risk being due to several common low risk variants. Genome-Wide Association Studies (GWAS) have identified 20 CRC risk variants. Nevertheless, these have only been able to explain part of the missing heritability. Moreover, these signals have only been inspected in populations of Northern European origin.
Results: Thus, we followed the same approach in a Spanish cohort of 881 cases and 667 controls. Sixty-four variants at 24 loci were found to be associated with CRC at p-values <10-5. We therefore evaluated the 24 loci in another Spanish replication cohort (1481 cases and 1850 controls). Two of these SNPs, rs12080929 at 1p33 (Preplication=0.042; Ppooled=5.523x10-03; OR (CI95%)=0.866(0.782-0.959)) and rs11987193 at 8p12 (Preplication=0.039; Ppooled=6.985x10⁻⁵; OR (CI95%)=0.786(0.705-0.878)) were replicated in the second Phase, although they did not reach genome-wide statistical significance.
Conclusions: We have performed the first CRC GWAS in a Southern European population and by these means we were able to identify two new susceptibility variants at 1p33 and 8p12 loci. These two SNPs are located near the SLC5A9 and DUSP4 loci, respectively, which could be good functional candidates for the association signals. We therefore believe that these two markers constitute good candidates for CRC susceptibility loci and should be further evaluated in other larger datasets. Moreover, we highlight that were these two SNPs true susceptibility variants, they would constitute a decrease in the CRC missing heritability fraction.
Keywords: GWAS, SNPs, Colorectal cancer, Spanish cohort, 1p33, 8p12
* Correspondence:[email protected]
1Galician Public Fundation of Genomic Medicine (FPGMX)-Grupo de
Medicina Xenómica-Centro de Investigación Biomédica en Red de Enfermedades Raras (CIBERer)-IDIS, Santiago de Compostela 15706, Spain Full list of author information is available at the end of the article
© 2013 Fernández-Rozadilla et al.; licensee BioMed Central Ltd. This is an Open Access article distributed under the terms of the Creative Commons Attribution License (http://creativecommons.org/licenses/by/2.0), which permits unrestricted use, distribution, and reproduction in any medium, provided the original work is properly cited.
Background
Even though genetic susceptibility is thought to be re-sponsible for almost 35% of the variation in colorectal cancer (CRC) risk [1], high penetrance mutations in Mendelian predisposition genes, such as APC, the mis-match repair (MMR) genes, or MUTYH are only able to explain <5% of cases [2]. The recent advances in the field of genetic epidemiology have validated the hypothesis that at least part of that remaining missing susceptibility lies in the form of multiple common low-risk variants, each conferring a modest effect on disease risk.
Genome-wide association studies (GWAS) are one of the most widespread methodologies for the detection of such susceptibility loci. The procedure (in distinction to candidate-gene association studies) offers an untargeted strategy for the detection of new low-penetrance var-iants, for it does not assume any a priori hypothesis on the location of these loci. This advantage has been proved important, since so far this kind of survey has successfully identified 20 variants at 8q24.21, 8q23.3, 10p14, 11q23, 15q13.3, 18q21.1, 14q22.2, 16q22.1, 19q13.1, 20p12.3, 1q41, 3q26.2, 12q13.3, 20q13.33, 6p21, 11q13.3 and Xp22.2 [3-6]. The combined effect of these variants altogether is thought to explain ~7% of the familial cancer risk [7]. Still, there is a high proportion of genetic contribution to CRC risk that has not been identified.
In this study we have undertaken a new screen for CRC susceptibility variants using a GWAS approach on our cohort of 881 CRC cases and 667 controls from the Spanish population. The use of a Southern-European dataset is a novelty that could lead to the identification of new candidate loci, since all of the populations where GWAS analyses have been conducted so far have been of Northern European origin. Although this may provide additional confirmation of the relationship of the 20 described variants to CRC risk in Southern Europe, we must also consider the possibility that there may be dif-ferences, at these or other particular loci in the genome, between these populations.
Materials and methods Study populations
Subjects in Phase I were 882 cases and 473 controls ascer-tained through the EPICOLON II Project and 194 ad-ditional controls from the Spanish National DNA bank. The EPICOLON Consortium comprises a prospective, multicentre and population-based epidemiology survey of the incidence and features of CRC in the Spanish popula-tion [8,9]. Cases were selected as patients with de novo histologically confirmed diagnosis of colorectal adenocar-cinoma. Patients with familial adenomatous polyposis, Lynch syndrome or inflammatory bowel disease-related CRC, and cases where patients or family refused to par-ticipate in the study were excluded.
Mean age for cases in Phase I was 71.20 years (SD±0.70). Hospital-based controls were recruited through the blood collection unit of each hospital, together with cases. All of the controls were confirmed to have no history of cancer or other neoplasm and no reported family history of CRC. Controls were randomly selected and matched with cases for hospital, sex and age (± 5 years). Population controls from the National DNA bank were also genotyped, to lessen the deficit of controls. They were matched for sex, age (± 10 years) and geographical origin of the sample with the remaining cases. Both cases and controls were of European ancestry and from Spain (stated, when possible, as all four grandparents being Spanish).
Samples in Phase II consisted of 1436 CRC patients and 1780 controls: samples from Hospital Sant Pau were 125 CRC patients from a previously described cohort [10]; the Hospital Gregorio Marañón dataset consisted of 104 CRC patients participating in a pharmagogenetic survey; Catalan Institute of Oncology (ICO) samples were 439 patients who belonged to the Bellvitge Colo-rectal Cancer Study; the CHUS hospital in Santiago de Compostela was a subsample of 153 participants included in a pharmacogenetic study; 105 CRC cases and 1330 controls came from the Spanish National DNA bank; and 510 CRC cases and 450 DNA controls belonged to the EPICOLON I Project [8]. Of the cases, 60.4% were male and 39.6% female. Controls were matched for gender. Age mean was 69.61 (SD±0.59) for cases and 52.00 (SD±0.58) for controls. Gender and hos-pital distribution of samples for case and control groups on both Phases is shown on (Additional file 1: Table S1).
DNA was obtained from frozen peripheral blood by standard extraction procedures for all samples. Cases and controls were extracted in mixed batches to avoid bias.
Ethical standards
The study was approved by the“Comité Ético de Investi-gación Clínica de Galicia”, and each of the institutional review boards of the participating hospitals. All samples were obtained with written informed consent reviewed by the ethical board of the corresponding hospital, in ac-cordance with the tenets of the Declaration of Helsinki.
SNP genotyping and QC
Affymetrix array 6.0 (Affymetrix, CA, USA), which includes probes for almost 1M SNP markers, was chosen to obtain genome-wide coverage for Phase I genotyping. Genotype calling for Affymetrix 6.0 was performed with the Birdseed algorithm, included within Birdsuite v1.4 [11]. Samples were organized in 23 batches of 16<n<99 according to hospital of origin for computational pur-poses. We obtained valid genotypes for 909 622 SNPs by these means. Quality control of the data, performed
mainly with PLINK v1.07 [12], included the removal of both SNPs and samples with genotyping success rates <99% (N=5984 for SNPs and N=0 for samples) and sam-ples with discordant gender between clinical recorded data and Affymetrix-asigned sex (N=7). Hardy-Weinberg equilibrium (HWE) was evaluated and markers with PHWE<1x10⁻⁴ in controls were removed from further
analyses (N=6984). SNPs with MAFs below 0.05 (N=221 799) were also eliminated due to low power to detect true signals and to avoid unnecessary noise. Finally, dif-ferential missingness between cases and controls was also accounted for by excluding markers with p-values below 1x10⁻⁴ (N=137). This test compares genotyping error rates for the affected vs. unaffected groups in order to avoid an increase in false positive findings due to this bias. Finally, SNPs with poor clustering were also excluded after visualisation with Evoker (briefly, asso-ciated SNPs at a selected threshold were selected for comparison of the two intensity channels against each other to manually check the proper assignment of the genotype-calling algorithm) [13]. A total of 674 718 SNPs remained after this filtering.
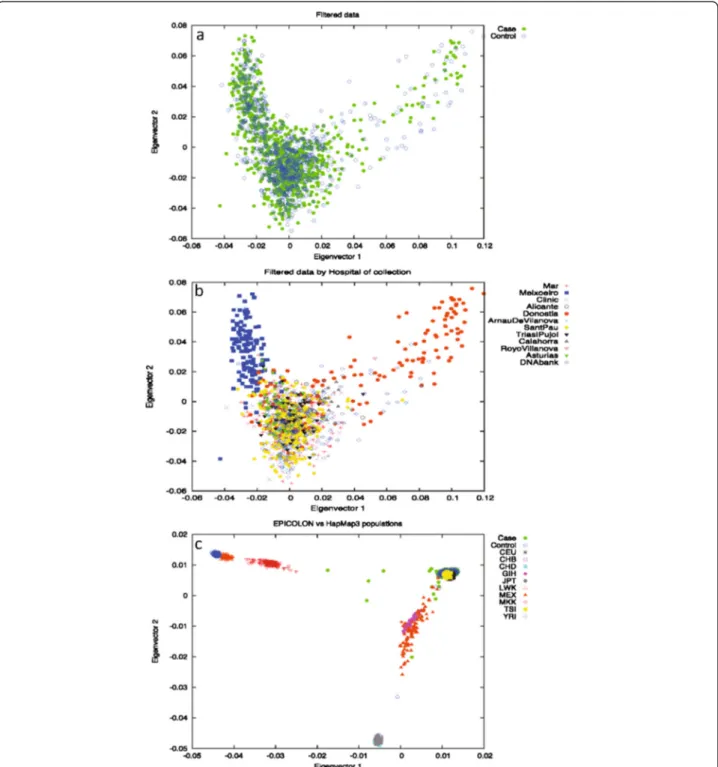
To address the possibility of underlying population strati-fication, Principal Component Analysis (PCA) on a subset of 98 986 randomly chosen independent SNPs (pairwise r2<0.1) was also performed on the full Phase I cohort using the EIGENSOFT smartpca software [14]. Long-range LD regions, as described by Price et al. [15], were also removed from this analysis. Outliers, taken as samples spread on principal components 1 and 2 were removed from subse-quent analyses, since they deviated from the main cloud. No evidence was found of population differences between cases and controls for the first 10 components of the PCA analysis, as stated in the Tracy-Widsom test (Figure 1a). Other potentially confounding variables, such as markers typed using the Nsp or Sty restriction endonucleases, hos-pital of collection, genotyping plate, or geographical origin of the samples were also checked for as sources for stratifi-cation (data not shown). All results were concordant with the original assumption of a single originating population except for hospital of origin. When considered as a con-founding variable, the EPICOLON cohort clustered into three separate subgroups: samples from the Donostia hos-pital (VAS dataset), the only collection centre for the Basque Country region (North of Spain), samples from the Meixoeiro hospital (GAL dataset), the single collection point in Galicia (NW Spain), and all others (REST dataset) (Figure 1b). An additional PCA comprising the full Phase I cohort and the HapMap3 populations (all ancestries) was also performed to illustrate the clustering of these popu-lations (Figure 1c) [16]. EPICOLON II samples that clus-tered away from the European end of the plot (showing evidence of non-European ancestry) were excluded from further analyses.
The final case dataset comprised 1477 samples (848 cases and 629 controls). The total count per subgroup was 167 for VAS, 366 for GAL and 944 for REST.
Genotyping in Phase II was conducted by Sequenom MassARRAY technology (Sequenom Inc. San Diego, CA, USA). rs7087402 at 10q23.31 could not be included in the analyses for genotyping design reasons. Quality control was performed with PLINK similarly to Phase I. Genoty-ping for both Phases was performed at the Santiago de Compostela node of the Spanish Genotyping Centre.
Statistical analysis
Association analysis was assessed as a 1°-of-freedomχ2 al-lelic test for each of the three subgroups independently for Phase I, and for second Phase replication, with PLINK [12]. The adequacy of the distribution of p-values was evaluated using quantile-quantile (Q-Q) plots of test statistics. Meta-analysis was also conducted using PLINK in Phase I. The method is based on a Mantel-Haenszel approach for data pooling. Cochran´s Q statistic and the I2heterogeneity index were also estimated to account for inter-population heterogeneity between groups, which was defined as I2>75% [17,18]. For markers above this threshold, a random-effects model was considered, whereas fixed-effect results were otherwise reported. Risks (odds ratios, ORs) with 95% confidence intervals (CIs) associated with each marker were then estimated assuming the appro-priate model. Phase II analyses were adjusted by age, given the mean differences between the case and control popula-tions for these cohorts. Pooled analysis was performed by logistic regression, considering genotyping Phase and population subgroup as covariates. Associations by pheno-type (age at diagnosis, MSI status, tumour location, pres-ence of previous adenomas, family history of CRC and sex) were examined by logistic regression in case-only analyses for the two associated SNPs (Additional file 1: Table S2). Additional statistical calculations and plots were performed using R [19].
Imputation
Imputation between the two recombination hotspots encompassing each of the 24 loci that showed evidence of association in Phase I was accomplished with Impute v2 using two reference panels: 1000 Genomes Project (b36) for wide coverage, and HapMap3 (r2 b36) for deep coverage [16,20,21]. Results from the imputation were later tested for association with SNPTEST [20]. Imput-ation results were filtered by minor allele frequency (MAF) of the markers (SNPs with MAFs<5% were excluded, since the procedure generates genotypes for a high number of rare variants that could give spurious as-sociation results), by missing data proportion (set to a 5% max), and the frequentist-add-proper-info column of the output. This latter statistic is the ratio of the
empirically observed variance of the allele dosage to the expected binomial variance p(1-p) at HWE, where p is the observed allele frequency from HapMap [22]. Opti-mal values should be within the (0.4-1) range and provide a measure for quality and accuracy of the imput-ation. Since the proportion of cases and controls devi-ates significantly from the standard 1:1, we also
considered the possibility that the imputed genotype probabilities for each marker were different in both sub-sets. Since IMPUTE gives back the imputation results as a probability for each genotype, we decided to filter out SNPs for which the probability of two out of the three genotypes was ≥25% (i.e. the genotype in this sample was not clear) in at least 5% of the cases or the controls.
Figure 1 PCA analysis on the EPICOLON cohort. (a) filtered data by case/control; (b) filtered data by hospital of origin; (c) EPICOLON and HapMap3 populations. Significant differences may be seen in section b with Meixoeiro and Donosti hospitals deviating from the main cloud.
This way we can eliminate samples for which genotype imputation has been inaccurate. Imputation results were plotted with the SNAP on-line tool [23].
Results
Stratification within the EPICOLON cohort
We observed using PCA that there was a batch effect due to differences by hospital at which sample had been collected, thereby dividing the EPICOLON cohort into three separate subgroups. We thus proceeded on the basis that each cluster - the GAL, VAS and REST case-control groups - was a separate sample set. Association results were then obtained for each of the subpopula-tions separately and then meta-analysed. Q-Q plots for the subgroups (after QC) showed an improvement in the systematic inflation for the distribution of the associ-ation p-values for the GAL, REST and VAS subgroups (Additional file 2: Figures S1A, 1B and 1C. respectively). Lambda genomic factor calculations (1.04192, 1.02323
and 1.02292 for GAL, VAS and REST, respectively) were consistent with no evidences of an increased false dis-covery rate. Additional file 2: Figure S1D represents the Q-Q plot distribution after meta-analysis of the three subpopulations. Some SNPs still seem to deviate from the expected distribution. These were later discovered to be artefacts of the calling procedure and were further removed with Evoker.
Association analyses
We found 64 SNPs at 24 genomic loci SNPs associated with CRC risk at P≤10-4
(lowest p-value=9,7x10⁻⁸ for rs11996339 at 8p12) (Table 1). Notably, I2heterogeneity values for the three subgroups (GAL, VAS, REST) were all 0 for these markers, thereby reflecting homogeneity in these associated SNPs.
Using imputation, we examined the LD blocks defined by recombination hotspots (as obtained from Haploview in the CEU+TSI HapMap3-r2 populations) around the
Table 1 Association results for phase I
LOCUS SNP BP Allele MAF cases MAF controls OR (95% CI) P value
1p33 rs12080929 48.208.735 C 0.249 0.312 0.731 (0.621-0.860) 9.447E-05 2p25.2 rs4669394 5.541.078 C 0.049 0.087 0.731 (0.622-0.860) 3.113E-05 2p24.1 rs1554267 22.284.451 A 0.457 0.371 1.429 (1.231-1.658) 3.139E-06 3p21.31 rs8180040 47.363.951 A 0.366 0.454 0.695 (0.599-0.806) 1.595E-06 3q12-q13 rs6438550 121.019.507 G 0.038 0.072 0.511 (0.369-0.709) 6.789E-05 5q35.1 rs11740081 172.707.280 A 0.123 0.188 0.604 (0.494-0.741) 6.789E-05 6q16.1 rs12213685 99.288.865 G 0.163 0.106 1.643 (1.313-2.042) 1.136E-05 6q23.1 rs12199765 131.192.418 A 0.268 0.202 1.434 (1.217-1.726) 5.428E-05 8p12 rs11996339 29.386.099 C 0.351 0.448 0.667 (0.574-0.774) 9.697E-08 8p12 rs11987193 29.391.927 A 0.237 0.309 0.691 (0.589-0.818) 9.752E-06 8p12 rs12548021 29.400.381 G 0.378 0.289 1.478 (1.279-1.749) 1.073E-06 8q13.3 rs17788534 72.697.475 C 0.198 0.141 1.509 (1.237-1.841) 7.903E-05 8q22.1 rs3104964 96.664.912 C 0.452 0.367 1.422 (1.225-1.652) 5.201E-06 10p15.1 rs7074607 5.623.371 A 0.151 0.1025 1.556 (1.242-1.949) 8.901E-05 10q23.31 rs7087402 92.760.125 A 0.527 0.4436 1.398 (1.208-1.619) 5.202E-06 12q24.31 rs568489 119.578.624 G 0.478 0.397 1.391 (1.200-1.612) 1.650E-05 13q32.3 rs17196583 99.624.356 A 0.201 0.145 1.488 (1.222-1.812) 7.307E-05 14q31.3 rs7148493 85.094.169 G 0.431 0.362 1.332 (1.147-1.548) 9.823E-05 14q32.12 rs8177528 92.247.404 A 0.407 0.335 1.367 (1.174-1.591) 5.471E-05 15q21.3 rs4644804 52.164.106 A 0.387 0.316 1.368 (1.173-1.596) 5.403E-05 15q25.3 rs16941001 86.249.170 A 0.101 0.059 1.806 (1.361-2.396) 3.704E-05 17p13.2 rs16954697 5.297.637 A 0.150 0.098 1.625 (1.293-2.044) 2.522E-05 17p12 rs9898623 13.255.126 A 0.045 0.085 0.512 (0.378-0.692) 1.625E-05 18p11.22 rs10502376 8.579.765 A 0.426 0.496 0.753 (0.651-0.872) 9.819E-05 18q21.2 rs2958182 51.300.019 A 0.330 0.261 1.392 (1.184-1.636) 9.792E-05 22q12.3 rs956119 34.582.213 G 0.064 0.104 0.591 (0.453-0.770) 9.193E-05
Main features of the SNPs associated in Phase I. Only the top associated SNPs at each of the 24 independent loci is shown. All genomic positions correspond to NCBI36/hg18.
64 SNPs for evidence of stronger signals of association. Additional file 1: Table S3 provides a summary of the loci and extent of the imputed regions. This analysis improved the association at 4 of the 24 loci: 1p33 (best SNP rs12060081); 14q31.3 (rs2057115); 15q21.3 (rs7176932); and 22q12.3 (rs17725348) (Additional file 3: Figure S2).
Replication
The ±1Mb regions flanking all 24 loci with evidence of as-sociation in Phase I were examined in the United Kingdom CORGI GWAS cohort through proxy SNP assessment [24]. Only 5 of these locations showed to have some CORGI associated SNP at an established p value threshold of P≤10-4
. However, LD analysis (in HapMap3-r2 CEU +TSI available data) showed them all to be independent signals (data not shown). Therefore, our attempt to repli-cate the association signals in silico was not successful for any of the variants.
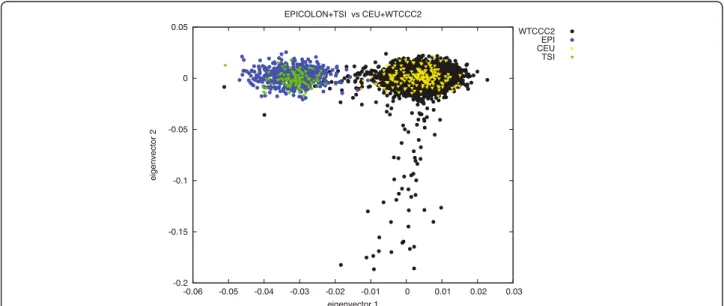
Since there has been extensive literature on the diffe-rences amongst Northern and Southern European popu-lations [25-28], we decided to perform a further PCA on 15,000 independent markers in order to compare allelic frequencies among the EPICOLON controls, the Hap-Map3 CEU and TSI populations, and the Wellcome Trust Case Control Consortium (WTCCC2) control cohorts [29]. This analysis effectively separated the Northern and Southern-European populations (Figure 2). Given this evidence, we decided to attempt replication of the best-associated markers (whether directly geno-typed or imputed) at these 24 loci in an independent Spanish cohort (Phase II). Thirty-two SNPs were finally selected to be genotyped at this Phase II according to LD measures at the 24 loci and experimental design.
The markers genotyped at each locus and their association values in the replication phase are described in Table 2.
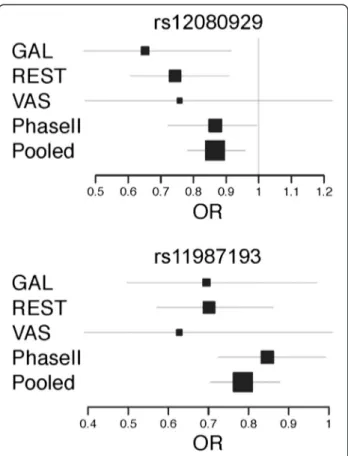
Two out of the replicated 32 SNPs, rs12080929 (chromosome 1p33) and rs11987193 (chromosome 8p12) were successfully replicated at a nominal level of p<0.05 in this second Phase (P=0.044, OR=0.867 (0.722-0.994) and P=0.039, OR=0.847 (0.724-0.992), respectively). Although the association signals were very modest, pooled analysis of the data from both phases was consistent with the pres-ence of a potential CRC susceptibility variant in these locations (pooled p values P=5.523x10⁻³and P=6.985x10⁻⁵, respectively), and the signals remained significant across population subgroups (with the exception of the smallest VAS dataset) (Figure 3). Another two variants at locus 14q31.3 were significant in Phase II, but their OR were in different directions for each of the Phases, thereby reflect-ing a potential false positive event in Phase I. Given the marker sizes, this finding is entirely compatible with a ran-dom positive finding at a significance level of 0.05. With regards to phenotype analysis, rs12080929 seemed to be slightly overrepresented in males vs. females (P=0.042, OR=0.771 (0.600-0.991)), whereas rs11987193 was more prevalent in rectal cancers (P=0.028, OR=1.327 (1.031-1.707)). None of the other variables used in the subgroup analyses provided statistically significant results (Addi-tional file 1: Table S2). It is also remarkable that none of the remaining three SNPs genotyped at these two loci (rs12080061 at 1p33, and rs11996339 and rs12548021 at 8p12) appeared to be replicated in this second phase, al-though rs12080061 showed a borderline p value in Phase II (P=0.087); in the case of rs11996339 and rs12548021 at 8p12 r-squared LD values among the three SNPs seem to show that the three markers are independent.
Figure 2 PCA analysis on the WTCCC (Affymetrix 6.0 data), HapMap3 CEU and TSI and EPICOLON populations. A set of 15 000 independent markers was used to perform the analysis. The first eigenvector separates the Northern and Southern European populations.
Previous susceptibility loci
In addition to the search of new susceptibility variants, we also investigated the association signals for 19 of the known CRC susceptibility variants [3-5]. rs5934683 on Xp22.2 could not be evaluated due to the fact that sexual chromosome data need to be processed differently. Con-sidering these markers were described from Illumina array tagSNP panels, most of them were not directly genotyped in our chip; therefore we proceeded with the evaluation of the association signals by considering the closest related proxy SNP (Table 3). Direct evidence of replication (taken as the presence of an associated SNP
with one-tailed P<0.05 in the same LD block as the described tagSNP) was found for 2 of the SNPs (Table 3). The remaining loci, although not significant, showed ORs in the same directions as those described in the lit-erature. We must however highlight that some of these SNPs (rs4444235 and rs1957636 at 14q22 and rs961253 andrs4813802 at 20p12) have already been found to present differences in Northern and Southern European populations, a fact that is consistent with our study not being able to replicate the association signals at these loci [28]. Imputation of the LD regions around these asso-ciated loci was conducted to search for an enhancing of
Table 2 Association results for phase II and pooled analysis
LOCUS SNP P PHASE II OR (95% CI) POOLED P POOLED OR (95% CI)
1p33 rs12080929 0.042 0.867 (0.722-0.994) 5.523E-03 0.866 (0.782-0.959) 1p33 rs12080061* 0.087 0.870 (0.743-1.020) 6.418E-05 0.793 (0.623-0.874) 2p25.2 rs4669394 0.736 1.038 (0.837-1.286) 6.693E-03 0.763 (0.627-0.928) 2p24.1 rs1554267 0.175 0.906 (0.785-1.045) 0.021 1.123 (1.018-1.240) 3p21.31 rs8180040 0.106 0.887 (0.767-1.026) 2.163E-06 0-784 (0-709-0-867) 3q12-q13 rs6438550 0.944 1.012 (0.731-1.400) 4.843E-03 0.723 (0.576-0.906) 5q35.1 rs11740081 0.508 0.935 (0.764-1.142) 4.772E-04 0.783 (0.683-0.898) 6q16.1 rs12213685 0.875 0.987 (0.842-1.157) 6.627E-03 1.220 (1.058-1.407) 6q16.1 rs4538713* 0.939 0.992 (0.804-1.224) 6.282E-04 0.702 (0.627-0.837) 6q23.1 rs12199765 0.231 1.108 (0.93-1.309) 2.693E-05 1.281 (1.141-1.438) 8p12 rs11996339 0.690 0.971 (0.842-1.120) 6.985E-05 0.817 (02739-0.903) 8p12 rs11987193 0.039 0.847 (0.724-0.992) 6.985E-05 0.786 (0.705-0.878) 8p12 rs12548021 0.234 1.095 (0.943-1.271) 2.587E-06 1.28 (1.155-1.418) 8q13.3 rs17788534 0.471 1.073 (0.885-1.301) 8.040E-04 1.249 (1.097-1.422) 8q22.1 rs3104964 0.081 1.139 (0.984-1.317) 4.239E-06 1.265 (1.144-1.398) 10p15.1 rs7074607 0.174 0.867 (0.705-1.065) 0.090 1.131 (0.981-1.305) 10q23.31 rs7087402 NA NA NA NA 12q24.31 rs568489 0.701 1.022 (0.916-1.139) 1.197E-03 1.178 (1.067-1.300) 12q24.31 rs2686555 0.913 1.006 (0.903-1.121) 3.619E-03 1.158 (1.049-1.278) 13q32.3 rs17196583 0.270 0.903 (0.752-1.083) 0.0455 1.136 (1.003-1.288) 14q31.3 rs2057115 0.030 0.791 (0.639-0.977) 0.395 1.065 (0.921-1.231) 14q31.3 rs7148493 0.024 0.843 (0.727-0.977) 0.308 1.054 (0.923-1.165) 14q32.12 rs8177528 0.423 1.056 (0.910-1.225) 1.163E-03 1.183 (1.069-1.309) 15q21.3 rs4644804 0.528 1.037 (0.927-1.159) 0.011 1.139 (1.030-1.259) 15q25.3 rs16941001 0.484 1.067 (0.891-1.277) 5.457E-04 1.351 (1.139-1.603) 15q25.3 rs16941002* 0.560 1.055 (0.880-1.265) 0.127 1.143 (0.952-1.345) 17p13.2 rs16954697 0.280 1.119 (0.913-1.372) 3.168E-04 1.301 (1.127-1.501) 17p12 rs9898623 0.449 0.926 (0.757-1.131) 1.526E-03 0.734 (0.607-0.889) 18p11.22 rs10502376 0.986 0.973 (0.842-1.125) 0.011 0.880 (0.797-0.971) 18q21.2 rs2958182 0.714 1.001 (0.861-1.164) 1.831E-03 1.181 (1.064-1.311) 22q12.3 rs956119 0.369 0.897 (0.708-1.137) 5.911E-03 0.785 (0.660-0.933) 22q12.3 rs17725348* 0.273 0.875 (0.690-1.110) 3.976E-04 0.702 (0.629-0.895)
*Denotes imputed SNPs; NA: not available.
the signals. No significant improvements were found, except for locus 15q13, for which an imputed SNP, rs16970016, 15kb upstream the GREM1 gene, scored the best p value in our dataset (P=9.847x10⁻⁵). This SNP has a good pairwise relationship with the formerly described rs4779584 (r2=0.882) (data not shown).
Discussion
Genome-wide association studies have so far successfully identified 20 CRC susceptibility SNPs [3-6]. Although this has been a significant improvement in the unrave-lling of the genetic basis of the disease, these variants alone do not completely explain all the inherited varia-tion that has been attributed to CRC.
Following the lead of the previous studies, we addressed the issue of trying to detect new colorectal cancer susceptibility variants through the performance of a GWAS in a Spanish cohort. This was the first at-tempt to perform a CRC GWAS in a Southern European population. By these means, we were able to positively identify two new candidate variants that have shown good evidence of association with CRC risk: rs12080929 at 1p33 and rs11987193, at 8p12.
Previous susceptibility loci
During the analysis, we were faced with the fact that, al-though there were no differences between case and con-trol populations, there was a significant stratification issue determined by the hospital of origin of the sam-ples. Because of this, the analyses had to be modified to match our case scenario without losing significant power. Nevertheless, the substructure in our cohort did not seem to greatly affect outcome quality. The evalu-ation on the 19 out of 20 already-described signals achieved direct replication for 2 of the loci (11q23 and 18q21). The other 17 markers did not show evidence of association, probably due to the lack of power in our co-hort to detect such moderate effects. Nevertheless, OR directions were consistent with those previously pub-lished. We must highlight at this point that the best-associated markers for these regions did not always match with the best proxy for the already described SNPs. This would make sense if we consider that any given GWAS relies on an indirect approach, and we would expect the associated SNPs to only be tagging the real causative variant. Results for allele frequencies and ORs seem consistent with the bibliography [3-5]. We con-sider the replication of these loci an important achieve-ment, since the majority of these association signals had not been previously evaluated in Southern European cohorts (with the notable exception of rs16892766 at 8q23.3, rs10795668 at 10p14, rs3802842 at 11q23, rs4779584 at 15q13, rs4444235 and rs1957636 at 14q22, and rs961253 and rs4813802 at 20p12 [5,28,30,31].
Spanish GWAS results
The association analysis in itself provided with positive results for 24 different genomic loci at a p-value <0.0001. A first attempt at replication was aimed by inspection of these association signals on the British CORGI cohort [24]. However, none of the signals seemed to be shared between datasets. This lack of replication could be due to both false positive findings and artefacts from the calling algorithm, or to real differences between both populations leading to dissimilar abilities to tag the real causative vari-ant [32]. The latter option has been recently proven to be possible, since differences in MAFs between Northern and Southern European populations have been described for SNPs rs4444235, rs1957636, rs961253 and rs4813802 [28]. A PCA analysis on the EPICOLON samples compared to the WTCCC control cohorts and the data from the HapMap3 CEU and TSI populations showed clear diffe-rentiation between the Northern and Southern European populations. Although not significant, SNP loadings also evidenced principal component 3 to be exclusively driven by a region of chromosome 8 (7.2-12Mb) where a common inversion is known to occur [33,34], whereas Eigenvectors 4-7 were driven by the HLA-A locus in the
Figure 3 Forest Plots for rs12080929 and rs11987193. The figure represents the odds ratios and 95% confidence intervals for the two markers in all 3 populations subgroups from Phase I, the Phase II replication dataset and the pooled analysis of both Phases.
6q21.2-21.3 region of chromosome 6, which has been also described as highly variable between populations [35]. Given this evidence, we proceeded on to replicate these 24 loci in an independent Spanish cohort.
SNPs rs12080929 and rs11987193 were successfully repli-cated in Phase II analyses. The former SNP, rs12080929 is located on an intronic position within hypothetical locus LOC388630 on 1p33. This predicted gene is believed to code for a single-pass type I membrane protein. Moreover, it lies 252kb upstream the SLC5A9 gene, a member of the solute carrier family, which could be a feasible regulation target. SLC proteins constitute good candidates to harbour CRC susceptibility loci, since some family mem-bers have been proven to act as tumour suppressors. In fact, the SLC5A8 gene is properly expressed in normal colon, but silenced in aberrant crypt foci through gene methylation [36].
The rs11987193 SNP is located in the 8p12 locus, 128kb downstream DUSP4. This gene is a member of the dual kinase phosphatase family, which are well-known tumour suppressors too [37]. They act through the downregula-tion of MAP kinases, thus preventing cellular proliferadownregula-tion and differentiation. Deletions in this gene have already been described to happen in other types of cancers, such as those of the breast and lung. In the case of CRC, DUSP4 expression appears to be modulated by KRAS
mutations [38-40]. Moreover, it has recently been described that DUSP4 expression is associated with microsatellite instability in CRC and causes increased cell proliferation [41].
The fact that these two SNPs were not replicated during the initial assessment of the association signals in the CORGI cohort, together with the North-South discrepan-cies seen in the PCA analysis, could be a sign of differences in the tagging of the real causative variant amongst popula-tions. Even when Europeans are presumed to be genetically homogeneous, it is not unrealistic to believe that punctual LD variations may be actually happening within popula-tions, and that these may constitute a certain impediment in our ability to replicate association signals [25,26].
Although none of the markers reached a final genome-wide significant p value, two of the SNPs in our study (rs12080929 and rs11987193) were favourably replicated in the second Phase and pooled analysis. However the limitations of this study (namely the modest sample sizes, further power restrictions also derived from the case-control age bias in Phase II and the potential differences between northern and southern European populations), we believe these two regions are good candidates for CRC susceptibility loci. The peculiarities of these loci, parti-cularly those relating to potential Northern-Southern European differences, may have important repercussions
Table 3 Replication results for the already-described loci
SNP REF LOCUS REPORTED ALLELE REPORTED MAF ALLELIC OR (95% CI) BEST PROXY AFFY 6.0 R2 OR (95% CI) EPICOLON P value rs6687758 1q41 G 0.2 1.09 (1.06-1.12) rs6691195 1 1.10 (0.92-1.33) 0.291 rs6691170 1q41 T 0.34 1.06 (1.03-1.09) rs11579490 0.902 1.00 (0.86-1.17) 0.974 rs10936599 3q26 T 0.24 0.93 (0.91-0.96) rs7621631 1 0.99 (0.83-1.19) 0.970 rs16892766 8q23 C 0.07 1.32 (1.21-1.44) rs2437844 0.925 1.13 (0.87-1.46) 0.360 rs6983267 8q24 T 0.48 0.83 (0.79-0.87) rs6983267 - 0.87 (0.75-1.01) 0.065 rs10795668 10p14 A 0.33 0.91 (0.86-0.96) rs706771 0.896 0.89 (0.76-1.04) 0.15 rs3802842 11q23 C 0.29 1.21 (1.15-1.27) rs3802840 1 1.19 (1.01-1.40) 0.037 rs11169552 12q13 T 0.26 0.92 (0.90-0.95) rs11169544 1 0.99 (0.83-1.18) 0.891 rs7136702 12q13 T 0.35 1.06 (1.03-1.09) rs7136702 - 1.14 (0.98-1.33) 0.0806 rs4444235 14q22 C 0.46 1.12 (1.07-1.18) rs11623717 0.838 1.01 (0.88-1.17) 0.859 rs1957636 14q22 A 0.39 1.08 (1.06-1.11) rs4901475 0.932 1.16 (0.99-1.34) 0.153 rs16969681 15q13 T 0.09 1.18 (1.11-1.25) rs16969344 1 1.21 (0.96-1.53) 0.103 rs11632715 15q13 A 0.46 1.12 (1.08-1.16) rs12592288 0.524 1.04 (0.81-1.12) 0.589 rs9929218 16q22 A 0.29 0.88 (0.83-0.92) rs7186084 1 0.94 (0.80-1.10) 0.439 rs4939827 18q21 C 0.47 0.85 (0.81-0.89) rs7226855 1 0.82 (0.71-0.95) 8.204E-03 rs10411210 19q13 T 0.10 0.79 (0.72-0.86) rs7252505 0.831 0.90 (0.72-1.13) 0.363 rs961253 20p12 A 0.36 1.13 (1.08-1.19) rs5005940 1 1.11 (0.92-1.26) 0.349 rs4813802 20p12 G 0.36 1.09 (1.06-1.12) rs4813802 - 1.07 (0.91-1.25) 0.433 rs4925386 20q13 T 0.32 0.93 (0.91-0.95) rs4925386 - 0.96 (0.82-1.12) 0.61
Association data for the 19 CRC risk variants (rs5934683 at Xp22.2 is not included). In bold two of the SNPs that showed direct evidences of association at a nominal p value<0.05.
on subsequent analysis. For this reason, the eventual iden-tification of the functional variant is of uttermost impor-tance. Finer mapping of the locus, coupled with additional replication efforts in larger cohorts will be needed to fully ascertain the relationship between these variants and dis-ease. Moreover, it is important to highlight that, were these two SNPs true susceptibility variants, they would constitute a decrease in the CRC missing heritability fraction. This is an essential point in our road towards the identification of high-risk individuals within populations [7].
Conclusions
The novelty of this study was the use of a Southern-European dataset to perform a CRC GWAS study that led to the identification of two new candidate variants: rs12080929 at 1p33 and rs11987193 at 8p12. These two SNPs are located near the SLC5A9 and DUSP4 loci, re-spectively. Some family members of the SLC proteins, as well as the DUSP gene, have been proven to act as tumour suppressors. Therefore, both of them could be good func-tional candidates for the association signals. Finer mapping and further replication in larger cohorts will be needed to ascertain their relationship with CRC susceptibility. The pe-culiarities of these loci, particularly those relating to poten-tial Northern-Southern European differences, may have important repercussions on subsequent analyses.
Additional files
Additional file 1: Table S1. Phase I and Phase II cohorts. Main features and sample distribution of the phases. Gender count, hospital of origin and age statistics for cases and controls are shown for each phase.Table S2. Associations by phenotype. Phenotype counts and association values for SNPs rs12080929 and rs11987193 and each of the clinical variables studied.Table S3. Associated loci and imputation regions. Location of the 24 associated loci and description of the regions that were imputed for finer mapping.
Additional file 2: Figure S1. Q-Q plots of p-value distribution. A: GAL , B: REST; C: VAS; D:meta-analysis.
Additional file 3: Figure S2. Imputation plots for the 24 loci associated with CRC in EPICOLON. P-value plots for the imputed markers in the associated regions. Diamonds represents typed SNPs, squares depict imputed markers, the biggest diamond is the best-associated SNP in the region, irrespective of typed/imputed status; red grading represents LD relationships . X axis: Chromosome location , Y axis: observed (-logP); Z axis: Recombination rate (cM/Mb).
Additional file 4: Supplementary note. Members of the EPICOLON Consortium (Gastrointestinal Oncology Group of the Spanish Gastroenterological Association).
Competing interest
The authors declare that there are no conflicts of interest. Authors’ contributions
Conceived and designed the experiments: ACar, CR-P, SCB, ACas. Performed the experiments: CF-R, CP, AB-F, AA. Analyzed the data: CF-R, JB-C, IPMT, LC-C, CR-P. Contributed samples/analytical tools: JB-LC-C, MJL, MB, LAL-F, LB, JLC-C, DG, RX, MA, XB, RJ, XL, The EPICOLON Consortium, VM. Drafting the MS: CR-P, JBC, IPMT, SCB, ACar, ACas. Wrote the paper: CF-R. All authors read and approved the final manuscript.
Acknowledgements
We are sincerely grateful to all patients participating in this study who were recruited as part of the EPICOLON project (Additional file 4). We
acknowledge the Spanish National DNA Bank (BNADN) for the availability of the samples. This study makes use of data generated by the Wellcome Trust Case-Control Consortium. A full list of the investigators who contributed to the generation of the data is available from www.wtccc.org.uk. Funding for the project was provided by the Wellcome Trust under award 076113 and 085475. SNP genotyping services were provided by the Spanish 'Centro Nacional de Genotipado' (CEGEN-ISCIII).
This work was supported by grants from Fondo de Investigación Sanitaria/ FEDER (08/1276, 08/0024, PS09/02368), Instituto de Salud Carlos III (Acción Transversal de Cáncer), Xunta de Galicia (PGIDIT07PXIB9101209PR), Ministerio de Ciencia e Innovación (SAF 07-64873 and SAF 2010-19273), Fundación Privada Olga Torres (CRP), Asociación Española contra el Cáncer (Fundación Científica y Junta de Barcelona), and FP7 CHIBCHA Consortium (ACar, SCB and LCC). SCB and CFR are supported by contracts from the Fondo de Investigación Sanitaria (CP 03-0070 to SCB and PS09/02368 to CFR). LALF was supported by Miguel Servet contract from Fondo de Investigación Sanitaria (CP06/0267 and PI12/00056) and grants from Fundación Mutua Madrileña and Fundación Ramón Areces. J-BC was funded by the Wellcome Trust Core Award 075491/Z/04. CIBERehd is funded by the Instituto de Salud Carlos III. Author details
1Galician Public Fundation of Genomic Medicine (FPGMX)-Grupo de
Medicina Xenómica-Centro de Investigación Biomédica en Red de Enfermedades Raras (CIBERer)-IDIS, Santiago de Compostela 15706, Spain.
2
Wellcome Trust Centre for Human Genetics, University of Oxford, Oxford OX3 7BN, UK.3NIHR Comprehensive Biomedical Research Centre, University
of Oxford, Oxford OX3 7BN, UK.4Department of Biochemistry and Molecular Medicine School of Medicine University of California, Davis, California, USA.
5
Oncology Pharmacy Unit, Complejo Hospitalario Universitario of Santiago (CHUS), Santiago de Compostela 15706, Spain.6Genetics Department,
Hospital de Santa Creu I Sant Pau, Barcelona 08025, Spain.
7Pharmacogenetics & Pharmacogenomics Laboratory, Servicio de Farmacia,
Hospital General Universitario Gregorio Marañón, Instituto de Investigación Sanitaria Gregorio Marañón,, Madrid 28007, Spain.8Gastroenterology
Department, Hospital del Mar, Barcelona 08003, Spain.9Department of Gastroenterology, Hospital Clínic, CIBERehd, IDIBAPS, University of Barcelona, Barcelona 08036, Spain.10Gastroenterology Department, Donostia Hospital, CIBERehd, University of the Basque Country, San Sebastián 20014, Spain.
11
Gastroenterology Department, Hospital do Meixoeiro, Vigo 36214, Spain.
12Section of Digestive Diseases, Internal Medicine Department, Hospital
Sagunto, Valencia 46520, Spain.13Servicio de Patologia Digestiva, Hospital Sant PAu, Barcelona 08003, Spain.14Section of Digestive Diseases and
Nutrition, University of Illinois at Chicago, Chicago, IL 60607, USA.
15Gastroenterology Department, Hospital General Universitario de Alicante,
Alicante 03010, Spain.16Cancer Prevention and Control Program, Catalan Institute of Oncology (ICO), Bellvitge Biomedical Research Centre (IDIBELL), CIBERESP, Barcelona 08907, Spain.
Received: 31 October 2012 Accepted: 23 January 2013 Published: 26 January 2013
References
1. Lichtenstein P, Holm NV, Verkasalo PK, Iliadou A, Kaprio J, Koskenvuo M, et al: Environmental and heritable factors in the causation of cancer–analyses of cohorts of twins from Sweden, Denmark, and Finland. N Engl J Med 2000, 343:78–85.
2. de la Chapelle A: Genetic predisposition to colorectal cancer. Nat Rev Cancer 2004, 4:769–780.
3. Houlston RS, Webb E, Broderick P, Pittman AM, Di Bernardo MC, Lubbe S, et al: Meta-analysis of genome-wide association data identifies four new susceptibility loci for colorectal cancer. Nat Genet 2008, 40:1426–1435. 4. Houlston RS, Cheadle J, Dobbins SE, Tenesa A, Jones AM, Howarth K, et al:
Meta-analysis of three genome-wide association studies identifies susceptibility loci for colorectal cancer at 1q41, 3q26.2, 12q13.13 and 20q13.33. Nat Genet 2010, 42:973–977.
5. Tomlinson IP, Carvajal-Carmona LG, Dobbins SE, Tenesa A, Jones AM, Howarth K, et al: Multiple common susceptibility variants near BMP
pathway loci GREM1, BMP4, and BMP2 explain part of the missing heritability of colorectal cancer. PLoS Genet 2011, 7:e1002105.
6. Dunlop MG, Dobbins SE, Farrington SM, Jones AM, Palles C, Whiffin N, et al: Common variation near CDKN1A, POLD3 and SHROOM2 influences colorectal cancer risk. Nat Genet 2012, 44:770–776.
7. Dunlop MG, Tenesa A, Farrington SM, Ballereau S, Brewster DH, Koessler T, et al: Cumulative impact of common genetic variants and other risk factors on colorectal cancer risk in 42 103 individuals. Gut 2012, Gut gutjnl-2011-300537Published Online First: 5 April 2012 doi:10.1136/gutjnl-2011-300537. 8. Pinol V, Castells A, Andreu M, Castellvi-Bel S, Alenda C, Llor X, et al:
Accuracy of revised Bethesda guidelines, microsatellite instability, and immunohistochemistry for the identification of patients with hereditary nonpolyposis colorectal cancer. JAMA 2005, 293:1986–1994.
9. Fernandez-Rozadilla C, De CL, Clofent J, Brea-Fernandez A, Bessa X, Abuli A, et al: Single nucleotide polymorphisms in the Wnt and BMP pathways and colorectal cancer risk in a Spanish cohort. PLoS One 2010, 5(9): e12673.
10. Pare L, Marcuello E, Altes A, Del RE, Sedano L, Salazar J, et al:
Pharmacogenetic prediction of clinical outcome in advanced colorectal cancer patients receiving oxaliplatin/5-fluorouracil as first-line chemotherapy. Br J Cancer 2008, 99:1050–1055.
11. Korn JM, Kuruvilla FG, McCarroll SA, Wysoker A, Nemesh J, Cawley S, et al: Integrated genotype calling and association analysis of SNPs, common copy number polymorphisms and rare CNVs. Nat Genet 2008, 40:1253–1260.
12. Purcell S, Neale B, Todd-Brown K, Thomas L, Ferreira MA, Bender D, et al: PLINK: a tool set for whole-genome association and population-based linkage analyses. Am J Hum Genet 2007, 81:559–575.
13. Morris JA, Randall JC, Maller JB, Barrett JC: Evoker: a visualization tool for genotype intensity data. Bioinformatics 2010, 26:1786–1787.
14. Patterson N, Price AL, Reich D: Population structure and eigenanalysis. PLoS Genet 2006, 2:e190.
15. Price AL, Weale ME, Patterson N, Myers SR, Need AC, Shianna KV, et al: Long-range LD can confound genome scans in admixed populations. Am J Hum Genet 2008, 83:132–135.
16. The International HapMap Consortium, Frazer KA, Ballinger DG, Cox DR, Hinds DA, Stuve LL, et al: A second generation human haplotype map of over 3.1 million SNPs. Nature 2007, 449:851–861.
17. Petitti D: Meta-analysis, decision analysis, and cost-effectiveness analysis: methods for quantitative synthesis in medicine. New York, NY: Oxford University Press; 2000. ISBN-13: 978-0195133646 | Edition: 2. Oxford University Press, 14/10/199.
18. Higgins JP, Thompson SG: Quantifying heterogeneity in a meta-analysis. Stat Med 2002, 21:1539–1558.
19. Ihaka R, Gentleman R: R: A language for data analysis and graphics. J Comput Graph Stat 1996, 5:299–314.
20. Marchini J, Howie B: Genotype imputation for genome-wide association studies. Nat Rev Genet 2010, 11:499–511.
21. The 1000 Genomes Project Consortium: A map of human genome variation from population-scale sequencing. Nature 2010, 467:1061–1073. 22. de Bakker PI, Ferreira MA, Jia X, Neale BM, Raychaudhuri S, Voight BF:
Practical aspects of imputation-driven meta-analysis of genome-wide association studies. Hum Mol Genet 2008, 17:R122–R128.
23. Johnson AD, Handsaker RE, Pulit SL, Nizzari MM, O'Donnell CJ, de Bakker PI: SNAP: a web-based tool for identification and annotation of proxy SNPs using HapMap. Bioinformatics 2008, 24:2938–2939.
24. Tomlinson I, Webb E, Carvajal-Carmona L, Broderick P, Kemp Z, Spain S, et al: A genome-wide association scan of tag SNPs identifies a susceptibility variant for colorectal cancer at 8q24.21. Nat Genet 2007, 39:984–988.
25. Novembre J, Johnson T, Bryc K, Kutalik Z, Boyko AR, Auton A, et al: Genes mirror geography within Europe. Nature 2008, 456:98–101.
26. Lao O, Lu TT, Nothnagel M, Junge O, Freitag-Wolf S, Caliebe A, et al: Correlation between genetic and geographic structure in Europe. Curr Biol 2008, 18:1241–1248.
27. Heath SC, Gut IG, Brennan P, McKay JD, Bencko V, Fabianova E, et al: Investigation of the fine structure of European populations with applications to disease association studies. Eur J Hum Genet 2008, 16:1413–1429. 28. Fernandez-Rozadilla C, Palles C, Carvajal-Carmona L, Peterlongo P, Nici C,
Veneroni S, et al: BMP2/BMP4 colorectal cancer susceptibility loci in Northern and Southern European populations. Carcinogenesis 2013, In Press.
29. The Wellcome Trust Case Control Consortium: Genome-wide association study of 14,000 cases of seven common diseases and 3,000 shared controls. Nature 2007, 447:661–678.
30. Tomlinson IP, Webb E, Carvajal-Carmona L, Broderick P, Howarth K, Pittman AM, et al: A genome-wide association study identifies colorectal cancer susceptibility loci on chromosomes 10p14 and 8q23.3. Nat Genet 2008, 40:623–630.
31. Pittman AM, Webb E, Carvajal-Carmona L, Howarth K, Di Bernardo MC, Broderick P, et al: Refinement of the basis and impact of common 11q23.1 variation to the risk of developing colorectal cancer. Hum Mol Genet 2008, 17:3720–3727.
32. Miclaus K, Chierici M, Lambert C, Zhang L, Vega S, Hong H, et al: Variability in GWAS analysis: the impact of genotype calling algorithm inconsistencies. Pharmacogenomics J 2010, 10:324–335.
33. Iafrate AJ, Feuk L, Rivera MN, Listewnik ML, Donahoe PK, Qi Y, et al: Detection of large-scale variation in the human genome. Nat Genet 2004, 36:949–951.
34. Kidd JM, Cooper GM, Donahue WF, Hayden HS, Sampas N, Graves T, et al: Mapping and sequencing of structural variation from eight human genomes. Nature 2008, 453:56–64.
35. Sachidanandam R, Weissman D, Schmidt SC, Kakol JM, Stein LD, Marth G, et al: A map of human genome sequence variation containing 1.42 million single nucleotide polymorphisms. Nature 2001, 409:928–933.
36. Li H, Myeroff L, Smiraglia D, Romero MF, Pretlow TP, Kasturi L, et al: SLC5A8, a sodium transporter, is a tumor suppressor gene silenced by
methylation in human colon aberrant crypt foci and cancers. Proc Natl Acad Sci USA 2003, 100:8412–8417.
37. Keyse SM: Dual-specificity MAP kinase phosphatases (MKPs) and cancer. Cancer Metastasis Rev 2008, 27:253–261.
38. Armes JE, Hammet F, De SM, Ciciulla J, Ramus SJ, Soo WK, et al: Candidate tumor-suppressor genes on chromosome arm 8p in early-onset and high-grade breast cancers. Oncogene 2004, 23:5697–5702.
39. Chitale D, Gong Y, Taylor BS, Broderick S, Brennan C, Somwar R, et al: An integrated genomic analysis of lung cancer reveals loss of DUSP4 in EGFR-mutant tumors. Oncogene 2009, 28:2773–2783.
40. Gaedcke J, Grade M, Jung K, Camps J, Jo P, Emons G, et al: Mutated KRAS results in overexpression of DUSP4, a MAP-kinase phosphatase, and SMYD3, a histone methyltransferase, in rectal carcinomas. Genes Chromosomes Cancer 2010, 49:1024–1034.
41. Gröschl B, Bettstetter M, Giedl C, Woenckhaus M, Edmonston T, Hofstadter F, et al: Expression of the MAP kinase phosphatase DUSP4 is associated with microsatellite instability in colorectal cancer (CRC) and causes increased cell proliferation. Int J Cancer 2012, 2012 Sep 11. doi:10.1002/ijc.27834. [Epub ahead of print].
doi:10.1186/1471-2164-14-55
Cite this article as: Fernandez-Rozadilla et al.: A colorectal cancer genome-wide association study in a Spanish cohort identifies two variants associated with colorectal cancer risk at 1p33 and 8p12. BMC Genomics 2013 14:55.
Submit your next manuscript to BioMed Central and take full advantage of:
• Convenient online submission
• Thorough peer review
• No space constraints or color figure charges
• Immediate publication on acceptance
• Inclusion in PubMed, CAS, Scopus and Google Scholar
• Research which is freely available for redistribution
Submit your manuscript at www.biomedcentral.com/submit