FORECASTING TV AUDIENCE: A CONSULTING PROJECT WITH THE ITALIAN PUBLIC TELEVISION
M. Gasparini, D. Imparato1
1. INTRODUCTION
Predicting future television audience based on past data is a statistical marketing exercise of great relevance to producers, advertisers, consumers and society at large. From a scientific point of view, it is an opportunity to compare two differ-ent modern approaches to the treatmdiffer-ent of huge databases: a statistical modelling approach and a data mining one. Generally speaking, the two strategies more and more happen to appear as possible - sometimes complementary, sometimes alter-native – solutions to many diverse applied research problems in modern science and technology. It is therefore interesting to give an example of their interaction with reference to the problem of forecasting TV audience.
This paper deals with a simplified version of the traditional (analogic) Italian television market in 2005. Its simplicity allows us to focus more on the statistical concepts and less on the specific details, which are not so important from a methodological point of view.
2. TV SHARE AND ITS PREDICTORS
This work is the result of a consulting project with the ICT division of RAI, the Italian public television service.
The largest part of the Italian television market is divided between two main players: the RAI public service, with three networks (RAI1, RAI2, RAI3), and a private competitor named MEDIASET, with three more networks (CANALE5, ITALIA1 and RETE4). There are other national networks, but their contribution is negligible from the point of view taken here. The fact that the main share-holder of MEDIASET is the businessman and politician Silvio Berlusconi, who has also been head of the Italian government, adds a bit of colour to the scenario,
1 The authors wish to thank RAI-ICT and ICTeam for their support and an anonymous referee for the useful remarks given.
but is also irrelevant to the problem considered in this paper, and will not be mentioned further.
The current growth of satellite, pay-per-view and digital TV technologies is be-coming increasingly important and will certainly foster a change in the way share data are collected and elaborated. Due to a higher degree of interactivity, it is likely that future TV audience analysis will become more and more like the analy-sis of web audience data. At the time this research was conducted though, i.e. in 2004, non-traditional TV was not yet as important as to attract the interest of RAI and it is excluded from the present discussion.
All these simplifications allow us to illustrate the prediction techniques in a set-ting which is modern enough to feature all properties of a mature industry, but simple enough not to worry about hundreds of channels and specialized (i.e., not generalist, as the TV jargon goes) programs.
The goal of the consulting project is to construct a statistical model to forecast the shares of RAI1, say (similar models apply to RAI2 and RAI3), during the two high-season periods going from October to November and from March to May of a given year.
The share of a single network at a given moment is defined as the ratio /
share = viewership audience (1)
where viewership is the number of people tuned to the network and audience is the total number of people watching TV at a given moment. Focus is on the whole 24-hour television scheduling, rather than on prime time (evening) only, since it is expected that some market improvements over the competitors are more likely to arise as a result of this exercise at non-prime times.
The share is the variable to be predicted, i.e. the response variable. Future share is to be forecast based on predictors, such as type of program, time of the day, day of the week and so on. Some of the predictors are under the control of RAI, other predictors are not.
The project is intended as a strategic marketing exercise, rather than a specific
con-tent exercise. This means that type of program, the predictor devoted to the
de-scription of a specific TV program, is not a detailed analysis of its content, but rather a generic classification. More precisely, each program is boxed into one of the following 17 different types, chosen on the basis of marketing considerations: movies, fiction, advertising, telefilm and soaps, gossip, politics, popular shows (such as realities, talk-shows and quiz-shows), music shows, art shows (like ballet, classical music and opera), cultural programs, documentaries, sport, public ser-vices, popular services (that is public services with strong popular impact, like mass celebration, drawing of the lottery and weather-forecast), news, programs for kids, other.
Due to the structure of the Italian TV competition, the parallel programming of CANALE5, the main Mediaset network, is considered as another relevant pre-dictor for the share of RAI1, whereas the programming of ITALIA1 and RETE4 are taken as predictors for RAI2 and RAI3, respectively. Of course, it can not be excluded a priori that there are other relevant nonzero correlations between all
possible pairs of network shares, but matching the shares of the three main pairs was a simplifying requirement given by the client RAI, since it reflected their way of thinking about programming alternatives. In other words, other non-direct in-teractions such as, for example, the competition between RAI1 and ITALIA1, were assumed to be negligible.
Other important predictors for the share are the day and the time within the day, since TV audience changes dramatically in size and preferences over time. 3. AUDITEL
Past data on share are the main basis to forecast future share. In Italy there ex-ists a fairly sophisticated system of recording TV shares, named Auditel (http// www.auditel.it/), which is financed and managed by TV networks, advertisers and a representative of the government in a way meant to balance the powers of the different stakeholders.
Official Auditel data have been used as building blocks for the forecasting ex-ercise. There exists a longstanding discussion on the quality of the Auditel data and on the ways to improve them, see for example (De Cristofaro, 2004) and ref-erences therein. For the sake of this project, such discussion is largely ignored, and we operate under the assumption that the same biases affect our data in a matter which is uniform over time and it allows in any case for the analysis of trends and for pattern comparisons.
Auditel databases come in a very complex format. After several rounds of data filtering, subsetting and merging, the final data to be analysed can be thought to come in the following format, with variables RAI1 and CANALE5 representing the type of programs of RAI1 and CANALE5 respectively. Notice that the data have been altered for confidentiality reasons.
TABLE 1
Data format after several steps of data processing
date Time Viewership Audience Day RAI1 CANALE5
2004-03-01 02:16:00 am 8.00E+004 2.04E+006 Mon goss telsop
2004-03-02 09:51:00 am 1.01E+006 3.19E+006 Tue other news
4. THE STATISTICAL MODELLING APPROACH TO FORECASTING
When using a statistical modelling approach to TV share forecasting, regres-sion techniques are used to estimate a mathematical formula that ties together ob-served past values of the response variable share, expressed in terms of the vari-ables viewership and audience as already defined, and observed past values of the fol-lowing predictors, whose relevance has been commented in section 2:
• prog: type of program given by RAI, a factor with 17 possible levels;
• countprog: type of program of the direct competitor (RAI1 vs. CANALE5,
• hour: time of the day, in hours, a factor of 24 levels; • day: day of the week, a factor with seven levels.
The choice of coding hour as a factor, rather than a quantitative (periodical) variable, is driven by the empirical observation that the resulting fit was better than other choices considered, such as polynomial regression. Other discretized versions of predictor hour, such as the ones considering parts of the day such as evening or late night, would give similar results.
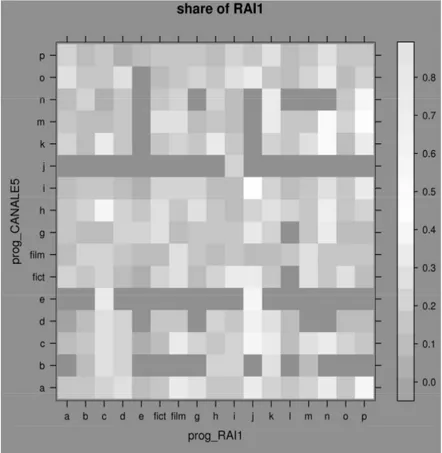
Descriptive tools have been used first to identify the relevant predictors and to explore their complex relationships with share. For instance, figure 1 is a grey scale intensity plot of the observed mean share of RAI1 according to day-of-the-week and time-of-the-day during a relevant subset of the share data during the period 2000-2004 (see later for details). Similarly, figure 2 is an intensity plot of the past observed mean share of RAI1 according to the programming of RAI1 itself and the programming of its direct competitor CANALE5. The grey scale on the right indicates how high is the mean share for the different combinations of predictors. Holes for some predictor combinations indicate that no past share data were observed for those particular levels. Even at a first glance, the plots confirm the dependence of the share on such predictors.
As a point of curiosity, note that time-of-the-day goes from 2:00 to 26:00 since for TV schedulers the “TV day” ends (and starts) at 2:00 a.m. Note also that the exact program type has been coded, except for the two levels film and fiction, due to confidentiality reasons imposed by the consulting agreement.
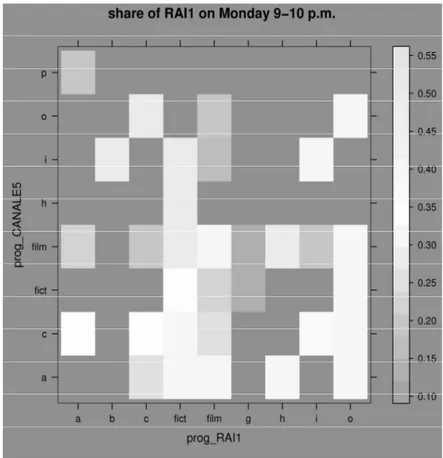
Figure 2 – Mean past share of RAI1 according to different scheduling.
In practice, we started by considering a subset of the predictors above and step by step we added new factors to the model, validating these by testing and reject-ing the null hypothesis that the coefficient of the new independent variable is null.
At a preliminary exploratory level, the possible presence of interactions among predictors has also been tested. The raw data suggest that the share depends on the predictors in a manner that transcends additivity. In figure 3 the levels of the factors prog and countprog are fixed: the trend of the mean share on the past data is plotted when both RAI1 and its direct competitor CANALE5 programmed a film. It seems that the share depends on the hour in a different way according to the day selected. Similarly, when observing the past mean share on Monday at prime time – from 9:00 to 10:00 p.m. – figure 4 shows different trends of the
Figure 3 – Mean past share of RAI1 according to different time combinations, fixing prog and countprog.
share according to different type programs of RAI1 and CANALE5. Note also that, due to the sparsity of the past data, not all possible combinations of the pre-dictors appear in the previous figures. For instance, traditionally both RAI1 and CANALE5 usually program a film or a fiction on Monday evening. In the up-coming future, however, the two competitors might consider different scheduling according to the changeable taste of the audience, such as the programming of reality shows. Statistical modelling allows for the attempt to predict any future scenario, although never observed before.
Whether interactions should be included or not is tested via formal statistical significance. The only significant interactions turn out to be the ones between day of the week and hour of the day, day:hour from now on, and between type of RAI program and type of program of the direct competitor, prog:countprog from now on.
In order to make the regression model more realistic, the response variable has to be a variable which may, in theory, take on values on the whole real line when varying the predictors over all of their possible values. In our case, the choice is made to separate the two components of share in such a way that viewership, or more precisely its logarithm, becomes the response variable, whereas audience, or
Figure 4 – Mean past share of RAI1 according to different scheduling, fixing day and hour.
better the logarithm of audience, is added to the set of predictors. For the sake of simplicity, the resulting model can be called a log-log model.
The final regression model implemented for each RAI network is therefore the following:
log(viewership = Fi) (log(audiencei),[day] ,[j hour] ,[k prog] ,l
[countprog] ,[m day : hour] ,[jk prog : countprog] ,lm error (2) ) where F indicates a linear function typical of regression models. For each
combi-nation of j,k,l and m, i ranges over all njklm observations corresponding to the j-th
day, the k-th hour, the l-th type of program and the m-th counter-program ob-served in the database and, finally, [day:hour]jk is the interaction between the j-th
day of the week and the k-th hour of the day, [prog:countprog]lm is the interaction
between the l-th type of RAI program and the m-th type of program of the direct competitor, j=1,..,6, k=1,...,23 and l,m=1,...,16.
In order to justify the choice of the logarithmic transformations in the regres-sion given in formula (2), consider the alternative model
( ,[ ] ,[ ] ,[ ] ,
i i j k l
viewership = F audience day hour prog
[countprog] ,[m day : hour] ,[jk prog : countprog] ,lm error , (3) ) where viewership and audience are left untransformed. Figures 5 and 6 are the plots
of the residuals versus the fitted values for the models described by equations (2) and (3), respectively. In general, residual plots give information about the error distribution of each single model. In our case, not only does the absence of the logarithm lead to negative predictions of viewership, but the variance of the error seems to increase with a fan-like effect the more the fitted values increase - see figure 6. On the other hand, the absence of a trend in figure 5 suggests that taking the logarithm for the response variable stabilizes the variance of the error.
A regression model may be called parametric, since emphasis is on the interpre-tation of the regression parameters as coefficients modulating the linear relation-ships between predictors and response variable.
Figura 5 – Residuals vs fitted valued for the
log-log model. Figura 6 – Residuals vs fitted value for the model without the logarithm.
Given an estimated regression equation based on the data, one can use it to predict new values of the response variable given certain values of the predictors. The prediction can be done in the form of a point value or in the form of a pre-diction interval. Intuitively, the width of a prepre-diction interval is smaller the greater the number of available observations is. In our forecasting exercise, point predic-tions and prediction intervals are constructed first on the apparent response vari-able log(viewership), then converted to the scale of the true response share by the inverse transformation.
5. THE DATA MINING APPROACH TO FORECASTING
When njklm is very large, i.e. many observations are available, linear regression
may turn out to be too simplistic a model. The complex relationships existing be-tween variables can be explored directly from the observed data, without con-straining them into artificial linear forms. The hope is that, due to the large num-ber of observed cases, the law of large numnum-bers kicks in and the true relationships between variables become apparent. This is a basic data mining approach, where one tries to take into account the whole information structure of the database. The resulting model can also be called a nonparametric one, to distinguish it from the parametric regression model, since the relationship between variables is not described through parametric functions.
Once exploratory queries to the database have identified the relevant predic-tors of the model - which actually turn out to be the same ones as for the para-metric tool, except for the interactions - multidimensional cubes of such predictors are created. Roughly speaking, a multidimensional cube is a database structure containing a subset of past data corresponding to a fixed combination of levels of the relevant predictors. The prediction value of the response variable correspond-ing to that combination is then obtained by a simple averagcorrespond-ing operation over the share values of the cube; such operation is called projection in information theory jargon.
In practice, the share value shârejklm which is predicted for the j-th day, the k-th
hour, the l-th program and the m-th counter program can be expressed as a mean of the similar past share values:
1 ˆ jklm i i jklm share = share n
∑
, (4)where the sum is over all the njklm occurrences of that specific combination of the
predictors found in the database. Prediction intervals can also be computed from the cube by calculating appropriate empirical quantiles, or more simply by adding and subtracting a multiple (typically one, but sometimes also two is used) of the standard deviation of the share calculated on the cube. We insist that the non-parametric model can be used only when there is a large number of similar past observations and the variability of the share over those observations is small enough. Otherwise, the nonparametric model turns out to be too adaptive, i.e. a simple after-the-fact readjustment of the observed data.
6. A COMPROMISE: THE HYBRID APPROACH
Due to the characteristics of the specific applied project with RAI, a unique hybrid model was implemented in practice, by joining together both the tools previously considered: either the parametric or the nonparametric model is switched on, based on the value of the statistic njklm and on an estimate of the
lo-cal standard deviation of the share. In other words, when there are enough similar past data points, the nonparametric model is used, otherwise the parametric model is used to make up for the sparsity of the observations.
7. COMPARISON WITH PREVIOUS WORK
Giudici (2003) is a text on the interface between Statistics and Data Mining which also contains an excellent chapter on Italian TV share forecasting and some additional references on previous work on the same subject. Those results are for some aspects similar to ours, the main differences being as follows.
1. In Giudici (2003) a multivariate logit transformation is used instead of the transformations leading to the log-log model of equation (2). The point of view is multivariate in the sense that the shares of all networks are modeled simul-taneously. Such overly technical point of view was discouraged in our re-search, where the interaction with non-technical personnel was essential. 2. In Giudici (2003) focus is on prime time, whereas we were requested for a
more comprehensive consulting work on non-prime time, in order to work on the competitive edge of less important times of the day.
3. In Giudici (2003) more modern regression techniques, such as CART and neural networks, are used. Due to the huge size of the data which were avail-able to us, we believe that the same forecasting power is achieved by our com-promise between a traditional linear regression model and an overly-adaptive simple-minded nonparametric one, as illustrated in the next section.
8. BUILDING AND VALIDATING THE PREDICTION MODEL
Auditel data from the years 2000-2004 have been used to fit the model. To analyze them, several interfaces between RAI databases and the statistical soft-ware have been created through the package RODBC of the statistical softsoft-ware
R.
For the parametric regression model, in order to obtain the observable data, a subset of the data has been randomly selected. Television viewership is a dynamic phenomenon, which changes its characteristics year by year, and one way to ac-count for such dynamism is by disac-counting the past. Therefore, data from previ-ous years have been discounted by progressive thinning selection. Sensitivity tests confirm the robustness of the predictions with respect to such thinning.
The main goal of the project is to predict the share of possible combinations of types of programs in the near to mid future, in a what-if approach. This means that, by simply choosing different values for the predictors, the user can predict which TV scheduling is more likely to obtain the highest share values among dif-ferent possible choices.
Prediction intervals of level 0.68 have been considered, roughly corresponding to the taste of the user for intervals with width equal to two standard deviations.
To predict future data, one should consider that the audience of a given time in the future – an important predictor in the log-log model – is unknown, but can be reliably estimated. Our choice is to use as a predictor a weighted mean of the audiences of the last four years:
1
0.3 0.25
i i, j i, j
audience = audience + audience − +
2 3
0.25+ audiencei, j− +0.2audiencei, j− (5)
where j denotes the year before the current one.
In order to validate the resulting model, a simple cross-validation method has been used: share values from October 2004 have been predicted and then com-pared with the observed ones. Exploratory work on this cross-validation exercise has shown that a good choice of the threshold value for the parameter n*jklm guid-ing the choice between the parametric and the nonparametric model seemed to
be n*jklm =50. It is therefore decided (and programmed) that, when fewer than 50
observations are present in the whole database for a specific combination of pre-dictors, the regression model has to be used to predict future shares, otherwise a nonparametric model is used. Similarly, the nonparametric model is not used for those combinations of predictors which provide an exceptionally high standard deviation.
To compare the efficiency of the different forecasting methods, the variable
| |
absolute error = share observed share predicted−
for RAI1 can be analysed for the month of October 2004, since the predicted values of the share and the observed real ones are both available for this valida-tion month. Some features of its distribuvalida-tion are shown in table 2. The hybrid method seems to provide an error of the predicted share almost half a percentile point less than each of the two single models, the simply parametric one (based on regression) and the simply nonparametric one (obtained from data mining). The absolute error distribution in table 2 compares favourably with the MSE, which is used as an alternative to absolute error in Giudici (2003).
Regarding 68% prediction intervals instead, which are constructed for the same validation month of October 2004 and compared to the observed values, it is observed that the actual values fall within prediction intervals in 69% of cases, showing a good fit of the statistical model and the appropriateness of the level of the prediction intervals. A similar percentage is obtained for prediction intervals constructed by a data mining approach.
TABLE 2
Absolute error distribution of the share of RAI1 for each of the three models
quantile parametric model non parametric model hybrid model
first quartile 0.01331 0.01288 0.01283
median 0.02953 0.02844 0.02531 mean 0.03805 0.03822 0.03383
9. USING THE PREDICTION MODEL WHEN IT WORKS
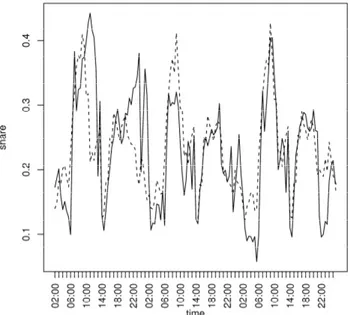
As a demonstration of the usefulness of the model for the actual prediction of future share values, a real time prediction exercise has been performed on fore-casting the share of RAI1 for the days from March 7th to March 9th, 2005. Fig-ure 7 shows the results: the observed share (solid line) agrees fairly well with the predicted share (dotted line) over the three 24-hour cycles. For the sake of sim-plicity, prediction intervals are not shown.
Figure 7 – Real (–) and predicted (- -) share of RAI1 for March 7th to March 9th, 2005.
10. USING THE PREDICTION MODEL WHEN IT DOES NOT WORK
It may be interesting to see a counterexample, that is, a share prediction exer-cise which fails, and to explain why. The hybrid model has been used also to pre-dict the share for the days from March 4th to March 6th, 2005. The results are shown in figure 8 in the same format as for the previous figure: the model fails to predict the share peaks relative to prime time and second time (late evening), while it seems to fit well the real trend of the remaining time.
There is actually a good explanation for this phenomenon: March 4th to March 6th were the final days of the Sanremo festival, the most important Italian pop music show, which has been broadcasted by RAI1 at prime and second time. The model “knows” that a music show is on, but it does not know that the most popular music show in Italy over the whole year is on, therefore equating, from a practical point of view, the Sanremo festival to any other music show. Having been de-signed mainly for strategic purposes, as specified above in this paper, the model
Figure 8 – Real (–) and predicted (- -) share of RAI1 for March 4th to March 6th, 2005.
we build cannot be used to forecast television events in which content is particu-larly relevant for the prediction of the share.
In order to insert content in the list of the predictors, a different model has to be used and possibly a much more complicated one. To account for the presence of movie stars, say, or for exceptional events such as terrorist acts, expert opinions should be used together with objective methods based on past data. The literature on the use of expert opinions in business decision making is very large ... but that is a different project.
Dipartimento di Matematica MAUROGASPARINI
Politecnico di Torino DANIELEIMPARATO
REFERENCES
R. DE CRISTOFARO, (2004), La rilevazione campionaria del pubblico televisivo in Italia, “Statistica e Società”, II, 2, 9-14.
SUMMARY
Forecasting TV audience: a consulting project with the Italian public television
A statistical marketing consulting project financed by RAI, the public Italian television, is illustrated. Two alternative models have first been used, a statistical regression model and a data mining one, of a more empirical nature. Then the two models are hybridised in a third model, a compromise useful for applications. Finally, some real forecasting exam-ples are illustrated.