ARTICLE
A practical guide for mutational signature analysis
in hematological malignancies
Francesco Maura
1,2,3, Andrea Degasperi
3,4,5, Ferran Nadeu
6,7, Daniel Leongamornlert
3, Helen Davies
3,4,5,
Luiza Moore
3, Romina Royo
8, Bachisio Ziccheddu
9, Xose S. Puente
10,11, Herve Avet-Loiseau
12,
Peter J. Campbell
3, Serena Nik-Zainal
3,4,5, Elias Campo
6,7,8, Nikhil Munshi
13,14& Niccolò Bolli
2,9Analysis of mutational signatures is becoming routine in cancer genomics, with implications for pathogenesis, classification, prognosis, and even treatment decisions. However, the field lacks a consensus on analysis and result interpretation. Using whole-genome sequencing of multiple myeloma (MM), chronic lymphocytic leukemia (CLL) and acute myeloid leukemia, we compare the performance of public signature analysis tools. We describe caveats and
pitfalls of de novo signature extraction andfitting approaches, reporting on common
inac-curacies: erroneous signature assignment, identification of localized hyper-mutational
pro-cesses, overcalling of signatures. We provide reproducible solutions to solve these issues and use orthogonal approaches to validate our results. We show how a comprehensive muta-tional signature analysis may provide relevant biological insights, reporting evidence of c-AID activity among unmutated CLL cases or the absence of BRCA1/BRCA2-mediated homologous
recombination deficiency in a MM cohort. Finally, we propose a general analysis framework
to ensure production of accurate and reproducible mutational signature data.
https://doi.org/10.1038/s41467-019-11037-8 OPEN
1Myeloma Service, Department of Medicine, Memorial Sloan Kettering Cancer Center, New York 10065 NY, USA.2Department of Oncology and
Hemato-Oncology, University of Milan, Via Festa del Perdono 7, Milan 20122, Italy.3Cancer, Ageing, and Somatic Mutation Programme, Wellcome Sanger Institute, Hinxton, Cambridgeshire CB10 1SA, UK.4Department of Medical Genetics, Cambridge University Hospitals NHS Foundation Trust, Cambridge CB2 0QQ,
UK.5MRC Cancer Unit, University of Cambridge, Hutchison/MRC Research Centre, Cambridge Biomedical Campus, Cambridge CB2 0XZ, UK.6Patologia
Molecular de Neoplàsies Limfoides, Institut d’Investigacions Biomèdiques August Pi i Sunyer (IDIBAPS), 08036 Barcelona, Spain.7Centro de Investigación
Biomédica en Red de Cáncer (CIBERONC), 28029 Madrid, Spain.8Barcelona Supercomputing Center (BSC), Joint BSC-CRG-IRB Research Program in
Computational Biology, 08036 Barcelona, Spain.9Department of Clinical Oncology and Hematology, Fondazione IRCCS Istituto Nazionale dei Tumori, Milan 20133, Italy.10Unitat Hematopatologia, Hospital Clínic of Barcelona, Universitat de Barcelona, 08036 Barcelona, Spain.11Departamento de Bioquimica y Biologia Molecular, Instituto Universitario de Oncologia (IUOPA), Universidad de Oviedo, Oviedo 33003, Spain.12IUC-Oncopole, and CRCT INSERM U1037,
31100 Toulouse, France.13Jerome Lipper Multiple Myeloma Center, Dana–Farber Cancer Institute, Harvard Medical School, Boston 02215 MA, USA. 14Veterans Administration Boston Healthcare System, West Roxbury 02130 MA, USA. Correspondence and requests for materials should be addressed to F.
M. (email:[email protected]) or to N.B. (email:[email protected])
123456789
T
he advent of next generation sequencing has profoundly changed both the research and clinical approach to cancerin the last 10 years1. While the cancer genome landscape
may be composed of thousands of events, only a minimal fraction
of them can be considered as drivers2–5. Despite the majority of
tumor mutations do not have a functional role, the entire coding and non-coding mutational catalog can be extremely informative for the identification of the mutational processes operative in
different cancer types during initiation and progression4,6–10.
Historically, a simple analysis of single-nucleotide variants (SNVs) as a six-class mutational spectrum (C∙G → A∙T, C∙G → G∙C, C∙G → T∙A, T∙A → A∙T, T∙A → C∙G, and T∙A → G∙C) has highlighted how different cancer types are characterized by dif-ferent contributions from each class, some of which strongly
associated with distinct exogenous carcinogens exposure11,12. For
example, the C∙G → A∙T transversion is related to smoking in
lung cancer samples13, and the C∙G → T∙A transition is
sig-nificantly over-represented in skin cancers related to UV light
exposure11,12,14. Following on from these preliminary
observa-tions, different approaches have been suggested to gain resolution in the analysis of these so called mutational signatures. Com-bining the six possible SNV classes together with their trinu-cleotide contexts (i.e., the bases 5ʹ and 3ʹ of the mutated nucleotide) all SNVs have been classified into 96 possible
combinations6,7,15. This classification has then been used to
extract >30 different mutational signatures with a non-negative matrix factorization (NNMF) approach from a large series of
whole-genome (WGS) and exome (WES) sequencing data6,16,17.
Some of these signatures are specifically associated with defects of DNA repair mechanisms, exposure to exogenous carcinogens, or different patterns of structural variants (SVs), suggesting they truly reflect known and unknown mutational processes shaping
the genome of each cancer type10,15,17–20. Further to
corrobor-ating their biological relevance, some mutational signatures are also associated with a distinct clinical outcome and emerged as
potential biomarkers for novel target therapies18,19,21,22.
Since this initial effort, several alternative approaches to NNMF have been proposed to improve the mathematical efficacy and biological accuracy of mutational signatures extraction from the
96-class profile of each cancer6,7,10,23–29. However, the field of
mutational signature extraction still lacks a unanimous consensus and standardization of analysis, often resulting in discrepancies between results from similar datasets obtained using different
methodological approaches4,9,10,21,22,30–33. As WGS and WES are
becoming common practice, with implications for both basic and translational research, we believe that more should be done to improve the performance and the reproducibility of mutational signature analysis.
In this study, we use different publicly available bioinformatics tools to analyze public datasets from multiple myeloma (MM) and chronic lymphocytic leukemia (CLL) samples, and validate
ourfindings in additional published and unpublished sequencing
data from acute myeloid leukemia (AML) samples, to summarize the main factors that should be considered in a high-confidence mutational signature analysis. We discuss sources of bias and pitfalls, and provide a rational and practical approach that could be validated in other independent studies.
Results
Common issues of mutational signature analysis. All different mutational signature analysis algorithms produce a
decomposi-tion matrix C≈ SE, where C is the catalog matrix, with mutation
types as rows and samples as columns, S is the signature matrix, with mutation types as rows and signatures as columns, and E is the exposure matrix, with signatures as rows and samples as
columns (Supplementary Fig. 1). Nevertheless, different approa-ches can be divided in two main groups: (i) the ones that allow de novo signature extraction (e.g., the NNMF framework from
Alexandrov et al.)6, where given a matrix C the algorithmfinds
matrices S and E such that C≈ SE, and (ii) the ones that fit the
96-mutational catalog to a pre-selected list of signatures (e.g., the 30
COSMIC signatures), where given C and S the algorithmfinds E
such that C≈ SE. An example of algorithm of the second group is
deconstructSigs24. Both approaches can be extremely informative
in different settings, though it is not always easy to determine when and how to use one or the other. Working with mutational signatures analysis with either group of algorithms, we identified
three main issues. The first is the ambiguous signature
assign-ment that occurs when different combinations of signatures can explain equally well the same mutational catalog. This issue may
arise when multiple so called flat mutational signatures are
potentially present in the same data set (e.g., COSMIC signatures
3, 5, and 8) (Supplementary Fig. 2)6,31,34. The second usually
occurrs when localized mutational processes are not investigated. In fact, when a signature extraction is performed using all the mutations found in a genome (or exome), only mutational sig-natures induced by mutational processes that act across the entire genome are usually identified. Localized mutational processes are often responsible for a small proportion of the total number of
genome-wide mutations, and thus are generally missed9,10,35,36.
The third common issue is the bleeding of signatures. It is bio-logically sound to assume that each cancer sample presents the activity of a limited number of mutational processes. If an extraction is performed on a heterogeneous set of samples, it is possible that signatures present in only part of the set are also erroneously assigned to the entire set. This is mostly due to the algorithms’ assumption that all analyzed samples share a similar mutational signature landscape and to the fact that some sig-natures are similar to each other.
Mutational signature extraction vs.fitting. As mentioned above,
a signature analysis can be performed using either a de novo
extraction or afitting approach based on a pre-selected reference
list of known signatures (e.g., the 30 COSMIC signatures).
The first approach extracts recurrent patterns of variants in
their trinucleotide context from the input data allowing the unbiased identification of both known and novel mutational processes. However, the weakness of this approach is that extracted signatures often do not appear identical to the reference ones. Common problems are: (i) union of co-occurrent multiple signatures into one; (ii) over splitting of one mutational signature into two or more. All these factors can significantly impact the
assignment of extracted signatures to the reference ones6,31, and
this may introduce bias in the estimation of each signature’s activity in the samples.
The second approachfits the input data to a suitable reference
list of mutational signatures, allowing a better estimation of each signature’s relative and absolute contribution for each sample.
However, a fitting approach is not able to discover any novel
signature and thus needs a priori knowledge of which mutational processes may be operative in that sample cohort. Furthermore, these approaches may be prone to overfitting leading to signature bleeding, i.e., they may assign all signatures from the reference list
to all samples. Therefore, before running anyfitting algorithm, it
is crucial to have at least some knowledge about which mutational processes are operative in the samples to avoid both false positives (overfitting of signatures) and false negatives (missing novel mutational process).
To provide an example of the problems that afitting algorithm
priori knowledge, we used a cohort of 30 MM cases (Supple-mentary Table 1), which have been extensively characterized from
a genomic point of view. Here, wefirst applied NNMF-based, de
novo extraction algorithms, i.e., the framework from Alexandrov
et al.6,7. (Fig. 1a, b) and the NNMF approach of the
mutationalPatterns R package37(Supplementary Sofware 1). Both
NNMF approaches extracted five signatures: the clock-like
signatures (Signature 1 and 5 merged together), APOBEC (Signature 2), Signature 8, Signature 9, and a new signature named MM1, again highlighting the impact that NNMF approaches can have in new signature discovery (Supplementary
Data 1)6,9,16,23. Then, using the same input data we then ran two
fitting approaches (deconstructSigs and the fitting approach of mutationalPatterns) without a priori knowledge of the active mutational processes in MM and therefore including all 30 COSMIC signatures. DeconstructSigs forced the extraction of a large number of signatures, including ones not previously extracted by NNMF, and some of which clearly representing
false positives (Fig. 1c and Supplementary Sofware 1). For
example, the contribution of tobacco-smoking (COSMIC Signa-ture 4) to MM development can most likely be ruled out, as can
the contribution of the liver-specific Signature 16 (Fig.1c)17,31,38.
Furthermore, the new signature MM1 was not identified, simply because it was not included in the COSMIC catalog. To reduce
false positives, some corrections can be applied to the fitting
approach. For example, deconstructSigs uses forward selection to estimate a minimal number of signatures, and removes a signature’s contribution to a sample if it accounts for <6% of the sample’s mutations. In contrast, mutationalPatterns fitting approach does not introduce any correction while attempting to fit all 30 COSMIC signatures. In this case, a false-positive
minimal contribution of unlikely signatures was detected in all patients (mismatch repair, UV light, tobacco-smoking etc.)
(Supplementary Sofware 1). Altogether, this shows that fitting
approaches may crucially alter the inferred mutational signature landscape in MM. Conversely, when we ran deconstructSigs and mutationalPatterns imputing the shortlist of COSMIC signatures previously identified by the extraction approaches (i.e., NNMF), this led to a more biologically sound assignment and quantifica-tion of the absolute and relative contribuquantifica-tion of each process (including the new signature MM1) for each sample, significantly
reducing the false-positive signatures (Fig.1d and Supplementary
Sofware 1).
Absence of BRCA-mediated Homologous Recombination
Deficiency in MM. The genomic profile of MM is characterized
by several recurrent and private cytogenetic aberrations, making it one of the most complex hematological malignancies from this
point of view3,21,39–44. Recently, using a fitting approach like
deconstructSigs with default parameters24, a potential activity
from Signature 3 has been proposed in a significant fraction of
MMs32. This mutational signature is well-known to correlate with
BRCA1 and BRCA2 bi-allelic loss and homologous repair
defi-ciency (HRD) in different solid cancers6,18,20,45. Signature 3 was
indeed observed in our MMs when either mutationalPatterns or
deconstructSigfitting approaches were run using all 30 COMISC
signatures (Fig. 1c and Supplementary Sofware 1), but not
observed in our signature extraction.
To positively confirm whether or not signature 3 is present in our samples, we used two validation strategies: (1) determine whether the pattern of Signature 3 is necessary to explain the
PD26400a PD26401a PD26402a PD26403a PD26404a PD26405a PD26406a PD26407a PD26408a PD26409a PD26410d PD26411c PD26412a PD26414a PD26415c PD26416d PD26418a PD26419a PD26420a PD26422e PD26423e PD26424a PD26425e PD26426e PD26427a PD26428a PD26429a PD26432c PD26434c PD26435c 0.0 0.2 0.4 0.6 0.8 1.0 Sig. 1 Sig. 2 Sig. 5 Sig. 8 Sig. 9 Sig. 13 MM1 Not assigned
Relative signature contribution
Relative signature contribution Relative signature contribution
Number of mutations
a
c
b
PD26400a PD26401a PD26402a PD26403a PD26404a PD26405a PD26406a PD26407a PD26408a PD26409a PD26410d PD26411c PD26412a PD26414a PD26415c PD26416d PD26418a PD26419a PD26420a PD26422e PD26423e PD26424a PD26425e PD26426e PD26427a PD26428a PD26429a PD26432c PD26434c PD26435c 0.0 0.2 0.4 0.6 0.8 1.0 Sig. 1 + Sig. 5 APOBEC Sig. 8 Sig. 9 (nc AID) MM1
PD26400a PD26401a PD26402a PD26403a PD26404a PD26405a PD26406a PD26407a PD26408a PD26409a PD26410d PD26411c PD26412a PD26414a PD26415c PD26416d PD26418a PD26419a PD26420a PD26422e PD26423e PD26424a PD26425e PD26426e PD26427a PD26428a PD26429a PD26432c PD26434c PD26435c 0
2000 4000 6000
8000 Sig. 1 + Sig. 5APOBEC
Sig. 8 Sig. 9 (nc AID) MM1 Sig. 1 + Sig. 5 APOBEC Sig. 8 Sig. 9 (ncAID) MM1
Signatures de novo extraction Signatures de novo extraction
Fitting extracted COSMIC signatures Fitting All COSMIC signatures
Sig. 1 + Sig. 5 Sig. 2 + Sig. 13 Sig. 8 Sig. 9 MM1 Sig. 2 + Sig. 13 Sig. 1 + Sig. 5 Sig. 8 Sig. 9 MM1
PD26400a PD26401a PD26402a PD26403a PD26404a PD26405a PD26406a PD26407a PD26408a PD26409a PD26410d PD26411c PD26412a PD26414a PD26415c PD26416d PD26418a PD26419a PD26420a PD26422e PD26423e PD26424a PD26425e PD26426e PD26427a PD26428a PD26429a PD26432c PD26434c PD26435c 0.0 0.2 0.4 0.6 0.8 1.0 Sig. 1 Sig. 2 Sig. 3 Sig. 4 Sig. 5 Sig. 6 Sig. 8 Sig. 9 Sig. 13 Sig. 16 Sig. 18 Sig. 19 Sig. 25 Sig. 30 Not assigned d
Fig. 1 Mutational signature de novo extraction vs.fitting. a, b The Alexandrov et al. NNMF framework6,7. From the 96-mutational classes, NNMF extracted
the signatures’ relative (a) and absolute (b) contribution among 30 MMs. c Running deconstructSig including all 30 COSMIC signatures several mutational processes were forced to be extracted (i.e., Signature 4). Furthermore, the new mutational process MM1 was not detected, being not included in the 30 COSMIC signatures.d Conversely, running the samefitting approach based on the mutational signature catalog extracted by NNMF, each signature contribution was better estimated for each patient. Sig.= signature
mutational patterns observed in the samples; (2) analyze additional genomic features to determine the presence of HRD.
First, to establish whether Signature 3 is required to explain the catalog of mutational signatures in our samples, we determined whether including or not Signature 3 in our analysis would affect the reconstruction error, i.e., the difference between the original
catalogs and thefitted linear combination of signatures for each
sample (see Methods). The inclusion of Signature 3 produced a statistically significant lower reconstruction error (measured as KL divergence, root mean squared error (RMSE) or cosine similarities), which can be attributed to the inclusion of an additional signature in the linear combination. However, the reconstruction error is not qualitatively different in the absence of Signature 3 (Supplementary Fig. 3a–c, g–i). In contrast, when Signature 3 is used in place of either Signature 8 or Signature 5, we have a qualitative increase in the reconstruction error (Supplementary Fig. 3d–f, j–l). Interestingly, when Signature 3 is excluded, the mutations that were assigned to Signature 3 seem
to be reassigned mostly to the other flat Signatures 8 and 5
(Supplementary Fig. 4). This evidence indicates that Signature 3 is not necessary to explain the patterns of SNV mutations in the samples. Conversely, Signature 8 and Signature 5 emerged as the most significant processes, and the ones that are likely active.
Next, we used an orthogonal approach to detect the presence of
BRCA1/BRCA2-like HRD in our MM samples (Fig.2): to this end,
we applied the recently published HRDetect tool18, a highly
accurate classifier that estimates the presence of BRCA1/BRCA2-like HRD in solid cancers, trained on multiple mutational patterns,
including COSMIC Signature 3, COSMIC Signature 8,
microhomology-mediated deletions, Rearrangement Signatures 3 and 5 (unclustered short tandem duplications and deletions,
respectively)20 and the HRD index46. If we exclude Signature 3
from our analysis, none of the 30 MM samples would be classified as HRD, as they do not appear to be enriched with the patterns that are typical of the BRCA1/BRCA2-type of HRD: there is a low proportion of microhomology-mediated type of small deletions, the
HRD-LOH index46is low, and there is a limited number of 1–100
Kb deletions (Rearrangement Signature 5) and 1–100 Kb tandem
duplications (Rearrangement Signature 3) (Fig.2a, Supplementary
Figs. 5 and 6). After including both Signature 3 and Signature 8, only one sample (PD26419a) would show an elevated HRDetect
score (Fig. 2b). This sample, characterized by multiple complex
events and chromothripsis47, is likely to be a false positive generated
by the erroneous inclusion of Signature 3 in our analysis. In fact, it lacked the characteristic unclustered genome-wide rearrangements and predominance of microhomology-mediated type of small
deletions (Fig.3a, b and Supplementary Figs. 5 and 6). Finally, if we
included Signature 3, we would expect some correlation between the HRDetect score and the assignment of Signature 3, since they both correlate with HRD. However, such correlation is absent in
our analysis (Fig.2b, c).
In conclusion, fitting approaches like deconstructSigs (or
mutational pattern) tend to force the assignment of flat
signatures, such as Signature 3, to samples when all 30 COSMIC
signatures are used as input (Fig.1c, Fig.3a, and Supplementary
Sofware 1). However, we demonstrated that Signature 3 is not necessary to explain the mutational patterns of MM samples, which furthermore do not show a genomic landscape consistent with BRCA1/BRCA2 loss and its related HRD in terms of 96-class profiles, number of microhomology-mediated deletions and internal tandem duplications as compared to breast cancer
(Fig. 3b, c and Supplementary Figs. 5 and 6). We therefore
suggest that Signature 3 (and consequently BRCA1/2-mediated HRD) is not biologically active in our MM samples, and it likely represents a false-positive call. Rather, we believe that the right signatures to be annotated in these samples are Signature 8,
widely involved in solid and hematological cancers with an
unknown etiology6, and Signature 5, a flat clock-like process
present in normal and cancer tissues16. This of course does not
exclude the possibility that a larger cohort of MM samples may show cases of BRCA1/2-like HRD, though again, we have no evidence that this is the case in our cohort.
Localized hypermutation. When a naive B-cell passes through the germinal center (GC), it is usually exposed to the activity of activation-induced cytidine deaminase (AID), which is respon-sible for a very unique genetic process called somatic hyper-mutation (SHM) of the B-cell receptor (BCR) variable region
(VDJ)48. This mutational process plays a critical role in the
antibody diversification promoting mutations and aminoacidic changes on immunoglobulin heavy and light chain (IGH/IGK/ IGL) genes in order to increase the B-cell receptor (BCR) affinity
to distinct antigens48. Chronic lymphocytic leukemia (CLL) is
well-known to be characterized by two main biological sub-groups: one dependent on GC exposure and one independent (Supplementary Data 2). These are differentially diagnosed by recognizing patterns of AID-driven somatic hypermutation in one group (mutated CLL, M-CLL) and not in the other
(unmu-tated CLL, U-CLL)5,49–53. MM and M-CLL are post-GC
lym-phoproliferative malignancies, and their (pre)malignant cells are
exposed to AID activity9,32. This mutational process, named
canonical-AID (c-AID), has been known for years and is
speci-fically active on IGH/IGK/IGL loci48,54,55; however, thanks to
mutational signatures analysis, an alternative AID-driven muta-tional process has been recently observed genome-wide in all
post-GC lymphoproliferative disorders6,10,52,53. This process was
named non-canonical AID (nc-AID; COSMIC Signature 9) and differs from the above-mentioned c-AID in terms of preferential trinucleotide context, genomic distribution and associated cell
cycle phase (Supplementary Fig. 7)55. In contrast to nc-AID, the
c-AID signature is generally not identified by de novo signature extraction algorithms because it is localized and its limited activity is diluted below the threshold of detection by the larger number of genome-wide mutations generated by other processes
(see the lack of its detection in all MM and CLL samples in Fig.1,
Supplementary Data 1, and Supplementary Sofware 1 and 2)
9,10,52. However, identification of the mutational burden of c-AID
and its aberrant targets (e.g., BCL654) can be extremely
infor-mative to compare the genomic landscape of different lympho-proliferative disorders and their different biological origins. The characterization of this localized mutational process can be
per-formed in two ways, with either extraction or fitting algorithms
after inclusion of the c-AID 96-class profile (Supplementary Fig. 7), currently not part of the COSMIC panel: (1) Considering only hypermutated regions, i.e., those with >5 mutations with a
median inter-mutational distance of < 1 Kb;6,9,15,47 (2)
Con-sidering only mutations that occur within known c-AID targets,
in particular the IGH/IGK/IGL loci52. Both approaches can
identify c-AID in both MMs and CLLs (Fig. 4), i.e., two
neo-plasms where activity of this enzyme is expected. Interestingly,
and confirming other previous preliminary data10, c-AID activity
was also detected in a fraction of U-CLL patients despite the GC-independent pathogenesis. Specifically, in MM and to a greater extent in M-CLL, >10% of these mutations were observed within coding genes, in particular across the VDJ region of the IGH locus; conversely, among U-CLL this activity involved mostly the non-coding part of the IGH locus, in particular within the class switch recombination loci (Supplementary Fig. 8a–d). These data are in line with the ability of WES to identify c-AID signature
within the IG loci only among M-CLL cases52, and strengthen
1.0
Classification threshold
Classification threshold
Classification threshold
Classification threshold BRCA1/BRCA2 deficiency score - Sig 8 only
BRCA1/BRCA2 deficiency score - Sig 3 only
Breast cancers BRCA null Breast cancers BRCA wt
BRCA1/BRCA2 deficiency score - Sig 3 and Sig 8
0.8 0.6 0.4
BRCA1/BRCA2
def. score
BRCA1/BRCA2 def. contribution 0.2 0.0 6 4 2 0 –2
Deletion with MH Substitution Sig. 3 Rearrangement Sig. 3 Rearrangement Sig. 5 HRD-LOH score Substitution Sig. 8
PD26419a PD26405a PD26422e PD26410d PD26414a PD26407a PD26416d PD26423e PD26418a PD26420a PD26404a PD26426e PD26401a PD26429a PD26408a PD26435c PD26403a PD26409a PD26411c PD26406a PD26400a PD26427a PD26425e PD26412a PD26424a PD26434c PD26415c PD26428a PD26432c PD26402a
1.0 0.8 0.6 0.4 BRCA1/BRCA2 def. score
BRCA1/BRCA2 def. contribution 0.2 0.0 6 4 2 0 –2
Deletion with MH Substitution Sig. 3 Rearrangement Sig. 3 Rearrangement Sig. 5 HRD-LOH score Substitution Sig. 8
PD26419a PD26405a PD26422e PD26410d PD26414a PD26407a PD26416d PD26423e PD26418a PD26420a PD26404a PD26426e PD26401a PD26429a PD26408a PD26435c PD26403a PD26409a PD26411c PD26406a PD26400a PD26427a PD26425e PD26412a PD26424a PD26434c PD26415c PD26428a PD26432c PD26402a
a
b
c
d
Fig. 2 HRDetect BRCA1/BRCA2 deficiency scores in MM. HRDetect was used to analyze the BRCA1/BRCA2 deficiency scores in MM samples a including
only signature 8,b including both signatures 3 and 8, and c including only signature 3. In d, the same analysis was performed in 15 BRCA null and 15 BRCA wt breast cancers18. Scores are ordered from highest to lowest and a classification threshold of 0.7 is used to classify samples as HRD-positive (see Davies
et al.18). Below each score, the contribution of the six features that are used by HRDetect is shown. Each contribution is given by the amount of a feature in
a sample, log-transformed and standardized according to mean and standard deviation of the features in Davies et al.18andfinally multiplied by the
corresponding HRDetect logistic regression coefficient. Thus, a positive contribution indicates a feature value higher than the average of the HRDetect original training set, and feature contributions are directly comparable. Sig.= signature
Furthermore, in contrast to MM and M-CLL cases, nc-AID was
not active in IGH regions from U-CLL cases (Fig.4). Confirming
previous reports on a potential ongoing AID activity in U-CLLs10,
a significant higher fraction of subclonal c-AID mutations (i.e., late mutations) was observed among this group of CLLs (Sup-plementary Fig. 8e). Conversely, c-AID mutations were mostly detected at clonal level (i.e., early mutations) in M-CLL and MM, confirming the recently reported decreased AID activity in late
stages of these diseases9,10. Overall, these data suggest a possible
non-VDJ and GC-independent role of c-AID among U-CLLs
(Fig.4)10,56.
To better characterize the c-AID activity on known loci, we usually prefer to focus on mutations within known c-AID targets rather than to identify hypermutated regions. In fact, most of c-AID mutations occurred close to different VDJ breakpoints, where distant genomic regions are joined by the RAG/AID complex
during early stage of B-cell development before the GC exposure48.
This means that inter-mutational genomic distance does not reflect the true position of these mutations and should be corrected for the VDJ structure to identify mutations caused by c-AID activity (Supplementary Fig. 9). This also applies to localized hypermuta-tion events (i.e., kataegis) around complex structural variants (i.e., chromothripsis), where the cancer chromosomal structure
sig-nificantly differs from the reference15,47.
As mentioned above, this kind of analysis can be also directed on known c-AID aberrant targets, such as BCL6, allowing the characterization of clustered mutational processes active around these critical oncogenes and key GC regulators (Supplementary
Fig. 10)54. In our series, BCL6 was involved in localized
mutational processes in M-CLL and MM reflecting their GC exposure, as expected; conversely, U-CLLs did not show any evidence of this process, confirming the GC-independent pathogenesis and suggesting the existence of a GC-unrelated AID activity in this group of patients.
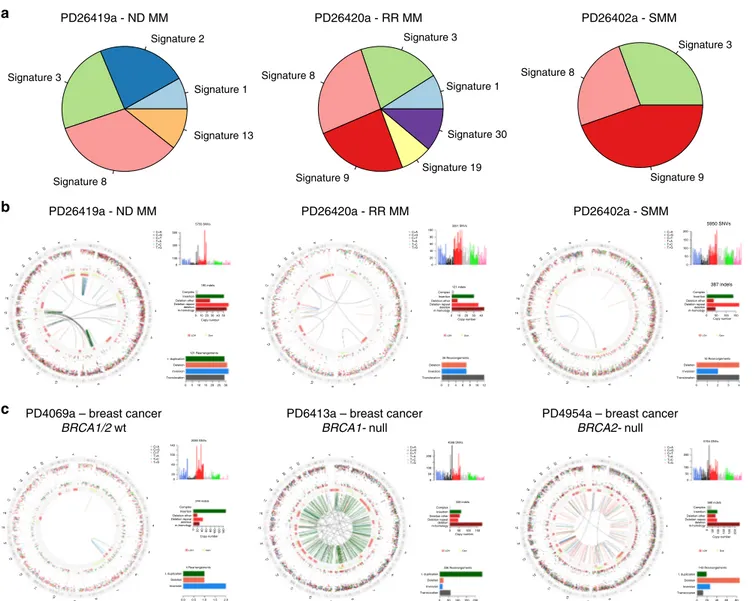
PD26402a - SMM PD26420a - RR MM PD26419a - ND MM PD26419a - ND MM b a c PD26420a - RR MM PD26402a - SMM Signature 3 Signature 1 Signature 30 Signature 19 Signature 9 Signature 8 Signature 1 Signature 13 Signature 8 Signature 2 Signature 3 Signature 3 Signature 9 Signature 8
PD4069a – breast cancer
BRCA1/2 wt
PD6413a – breast cancer
BRCA1- null
PD4954a – breast cancer
BRCA2- null 5950 SNVs 3251 SNVs 4 Rearrangements 2085 SNVs 244 indels 336 Rearrangements 339 indels Copy number Copy number 143 Rearrangements 5764 SNVs 580 indels Copy number 4588 SNVs 121 Rearrangements 5755 SNVs 500 100 200 200 100 50 0 150 100 50 0 80 60 40 20 0 C>A C>G C>T T>A T>C T>G C>A C>G C>T T>A T>C T>G C>A C>G C>T T>A T>C T>G C>A C>G C>T T>A T>C T>G C>A C>G C>T T>A T>C T>G C>A C>G C>T T>A T>C T>G Y X 22 21 20 19 18 17 16 15 14 13 12 11 10 9 8 7 6 5 4 3 2 1 Y X 22 21 20 19 18 17 16 15 14 13 12 11 10 9 8 7 6 5 4 3 2 1 Y X 22 21 20 19 18 17 16 15 14 13 12 11 10 9 8 7 6 5 4 3 2 1 Y X 22 21 20 19 18 17 16 15 14 13 12 11 10 9 8 7 6 5 4 3 2 1 Y X 22 21 20 19 18 17 16 15 14 13 12 11 10 9 8 7 6 5 4 3 2 1 Y X 22 21 20 19 18 17 16 15 14 13 12 11 10 9 8 7 6 5 4 3 2 1 300 100 140 100 60 20 0 020406080100120140 0 010 20
LOH Gain LOH Gain LOH Gain
LOH Gain LOH Gain LOH Gain
30 40 50 0 0 200 100 50 0 246810 0 50 0 50100150200 100150 12 1020 0 0 1 2 0 0 20 40 60 80 50 100150 120250 3 4 50 100150 3040 0 0.0 0.5 1.0 1.5 2.0 51015202530 Complex t. duplication Deletion Inversion Translocation Deletion Inversion Translocation Deletion Inversion Translocation t. duplication Deletion Inversion t. duplication Deletion Inversion Translocation t. duplication Deletion Inversion Translocation Insertion Deletion other Deletion repeat deletion m-homology Complex Insertion Deletion other Deletion repeat deletion m-homology Complex Insertion Deletion other Deletion repeat deletion m-homology Complex Insertion Deletion other Deletion repeat deletion m-homology Complex Insertion Deletion other Deletion repeat deletion m-homology Complex Insertion Deletion other Deletion repeat deletion m-homology 195 indels Copy number 121 indels Copy number 26 Rearrangements 10 Rearrangements Copy number 387 indels
Fig. 3 Absence of BRCA-driven HRD in MM. a Pie charts showing the relative signature composition according to DeconstructSig in three MM cases, without a prior knowledge of which signatures are involved or detected by NNMF. Testing all 30 COSMIC mutational signatures, Signature 3 is extracted is
all samples.b Circos plot of three MMs (ND= newly diagnosed; RR = relapsed/refractory; SMM = smoldering MM) where deconstructSig extracted a
significant Signature 3 contribution. From the external ring to the internal: mutations, (vertically plotted according to their inter-mutational distance and where the color of each dot represents the mutation class), indels (dark green= insertion; and brown = deletion); copy number variants (red = deletions, green= gain), rearrangements (blue = inversion, red = deletions, green = ITD, black = translocations). PD26419a is the only patient with a slightly high HRDetect score when analyzed including Signature 3.c Circos plots of a breast cancer sample without BRCA deficiency (PD4069a), one with BRCA1
deficiency (PD6413a) and one with BRCA2 deficiency (PD4954a). The MM genomic landscape shows significant differences to the two BRCA-deficient
SHM is only present in post-GC B-cells, however it is not the only example of localized hypermutation in cancer. An instance of localized hypermutation termed kataegis has been found across many cancer types and is often promoted by aberrant activity of
the APOBEC family of DNA deaminases47,57. We have previously
reported widespread and localized activity of APOBEC in MM
(Fig. 5a–c)9 where it is recurrently associated with complex
rearrangements such as chromothripsis, similarly to what has
been reported in several other solid cancers47. Furthermore, here
we report the first case of APOBEC-mediated kataegis in a
therapy-related AML case, again associated with a complex
rearrangement (Fig. 5d–f). Previously, APOBEC was never
reported as active in AML6,31. Overall, our findings stress the
importance of performing ad-hoc signature analysis in localized mutational events, since this can highlight specific pathogenetic mechanisms across different cancer types.
Inter-sample bleeding. Both WGS and WES data have clearly shown that M-CLL samples are characterized by a very distinct mutational process (COSMIC Signature 9), reflective of the
genome-wide nc-AID activity within the GC6,10,52. Conversely,
we would expect the absence of nc-AID signature in U-CLL, as these cases do not develop through the GC. To validate this assumption, we performed a de novo signature extraction on all
CLLs, using either the Alexandrov et al.6 framework or the
mutationalPatterns37NNMF function (Supplementary Data 1). A
nc-AID signature was assigned to all samples, with high activity in M-CLL samples and a much lower contribution in U-CLLs
(Fig.6and Supplementary Sofware 2). This represents a typical
example of inter-sample bleeding effect caused by the assumption that all these samples shared a similar mutational landscape. This incorrect assignment would not be readily highlighted if the biology underlying CLL pathogenesis was not thoroughly known.
To obviate this problem, we propose two approaches. In thefirst,
we re-fit the extracted signatures. Here, signatures are first
extracted with a de novo approach. Then, afitting algorithm such
as deconstructSigs is applied using only the signatures extracted by NNMF to clean up low-contribution signatures, mostly
representing false positives (Fig. 6b, c). The second approach
involves performing separate extractions. NNMF is run inde-pendently on two sets of samples, split using prior knowledge of the IGHV mutational status evaluated, for example, by Sanger
sequencing (Fig. 6d, e and Supplementary Data 2). Either
approach successfully removed the nc-AID signature from U-CLL samples, in accordance with the pathogenesis of this U-CLL
subgroup known not to be exposed to GC activity (Fig.6d, e)58.
This kind of a priori biological and clinical knowledge is not available for all cancer types. However, a simple clustering analysis based on the relative contribution of NNMF-extracted mutational signatures may also highlight the heterogeneity in signature activity and therefore help in the identification of distinct groups of patients, based on exposure to different mutational processes (Supplementary Fig. 11). Next, either a
second NNMF run or a fitting approach using the NNMF
shortlist can be performed on each single subgroup, as explained
above21.
This inter-sample bleeding of signatures is of course a universal phenomenon and as such can be also observed in non-B-cell hematological malignancies. To extend the validity of our findings we therefore focused on acute myeloid leukemia (AML), where we (i) performed WGS on two cases of therapy-related AMLs (t-AML) arisen after platinum-based chemotherapy for ovarian carcinoma and (ii) analyzed publicly available WGS
data from the TCGA repository of primary AML cases (n= 50)59.
In this setting, we extracted four main mutational processes: Signature 1, Signature 5 and two signatures currently not included in COSMIC. Of these, one was recently associated with platinum exposure (platinum signature) and the second to the
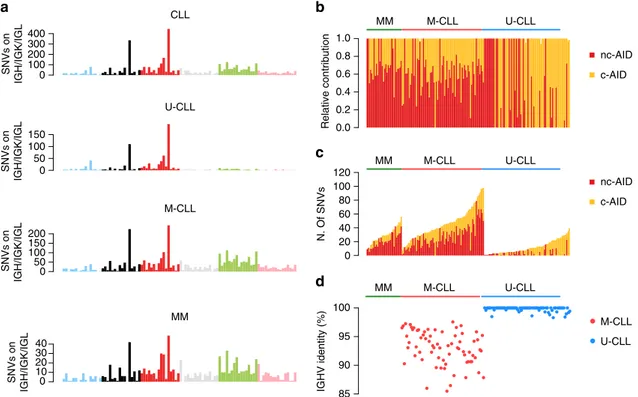
0.0 0.2 0.4 0.6 0.8 1.0 0 20 40 60 80 100 120 85 90 95 100 M-CLL U-CLL 0 100 200 300 400 0 50 100 150 0 50 100 150 200 0 10 20 30 40 CLL MM IGHV identity (%) Relative contribution N. Of SNVs SNVs on IGH/IGK/IGL SNVs on IGH/IGK/IGL SNVs on IGH/IGK/IGL SNVs on IGH/IGK/IGL M-CLL U-CLL M-CLL U-CLL MM nc-AID c-AID nc-AID c-AID MM M-CLL U-CLL MM M-CLL U-CLL a b c d
Fig. 4 Mutational signature landscape of immunoglobulin loci. a The 96-mutational classes of all SNV within IGH/IGK/IGL loci. Canonical AID (c-AID) represented the main mutational process within these regions in all tested hematological malignancies, including U-CLLs as recently described3,10,52.
b, c Mutational signature relative (b) and absolute (c) contribution within IGH/IGK/IGL loci for each sample tested by deconstructSig. d The Sanger-sequencing-based IGHV mutational status available for each CLL case. Sig.= signature
hemopoietic stem cell nature (HSPC Signature) (Fig. 7a, b and
Supplementary Data 1)31,38,60–62. The platinum signature
con-tributed for >30% of the mutational burden of t-AMLs, but its activity was also found among primary AML from TCGA
(Fig.7c). This is inconsistent with the prior knowledge of these
samples being treatment-naive. Confirming that platinum signature in primary AML samples represents a further example of inter-sample bleeding, analysis of TCGA primary AMLs without the two t-AML cases led to disappearance of the
Platinum Signature (Fig. 7d and Supplementary Sofware 3).
Furthermore, our analysis confirmed the added benefit of
performing a de novo signature extraction as a first approach,
as two out of four mutational signatures extracted in this cohort of 52 AMLs are not currently included in COSMIC.
Discussion
In this study, we explored caveats and pitfalls of mutational sig-nature analysis using whole-genome sequencing data from three common hematological neoplasms, focusing on the sample set preparation and post-algorithm interpretation processes. Fur-thermore, we showed how a comprehensive and detailed muta-tional signature analysis can provide relevant biological insights within different and well characterized cancer types, such as the c-AID activity among UM-IGHV, the absence of BRCA1/ BRCA2-mediated HRD in a MM cohort and two mutational processes in AML, one related to platinum and one less char-acterized related to stem and progenitor bone marrow
cells31,38,60–62.
With the rapid increase in the number of tumor genomes sequenced, novel mutational signatures can be identified using several approaches discussed in this work. However, blind trust
on out-of-the-box results from public tools can produce an incomplete representation of signatures, or the inclusion of false positives. Our results contain useful practical considerations that can resolve some of the uncertainty in the use of different algo-rithms, and in the interpretation of the results.
Important caveats and pitfalls a scientist can face in mutational signature analysis can usually be recognized and corrected by a priori knowledge of the biology of the tumor and by deep understanding of the way each algorithm works. For example, in CLL it is known that nc-AID exposure within the germinal center
is only present among M-CLL cases. Therefore, the finding of
Signature 9 activity in U-CLL must be regarded to as artefactual, related to the bleeding phenomenon that is common among de novo NNMF-based approaches. Knowing weaknesses and strengths of each approach, we proposed solutions to improve the accuracy of signature identification, with results that are biolo-gically plausible. The main point of this study is in fact to highlight how the statistical and mathematical methods are important, but they must be used with expertize and combined with a good knowledge of the cancer type being studied. This is
especially true when it comes to assignment offlat signatures: our
original analysis demonstrates that the previously identified presence of BRCA1/BRCA2-like HRD in an MM cohort is likely
to be a false-positive call offitting algorithms32, but this can only
be demonstrated knowing the actual genomic consequences of BRCA deficiency in cancers and comparing them to what is seen in MM. Of course, our results only argue against the presence of BRCA1/BRCA2-type of HRD in our MM cohort, as we and others have convincingly demonstrated that a subset of MM patients are characterized by a significant grade of genomic
instability3,21,22,44,63–65.
A[C>A]A A[C>A]C A[C>A]G A[C>A]T C[C>A]A C[C>A]C C[C>A]G C[C>A]T G[C>A]A G[C>A]C G[C>A]G G[C>A]T T[C>A]A T[C>A]C T[C>A]G T[C>A]T A[C>G]A A[C>G]C A[C>G]G A[C>G]T C[C>G]A C[C>G]C C[C>G]G C[C>G]T G[C>G]A G[C>G]C G[C>G]G G[C>G]T T[C>G]A T[C>G]C T[C>G]G T[C>G]T A[C>T]A A[C>T]C A[C>T]G A[C>T]T C[C>T]A C[C>T]C C[C>T]G C[C>T]T G[C>T]A G[C>T]C G[C>T]G G[C>T]T T[C>T]A T[C>T]C T[C>T]G T[C>T]T A[T>A]A A[T>A]C A[T>A]G A[T>A]T C[T>A]A C[T>A]C C[T>A]G C[T>A]T G[T>A]A G[T>A]C G[T>A]G G[T>A]T T[T>A]A T[T>A]C T[T>A]G T[T>A]T A[T>C]A A[T>C]C A[T>C]G A[T>C]T C[T>C]A C[T>C]C C[T>C]G C[T>C]T G[T>C]A G[T>C]C G[T>C]G G[T>C]T T[T>C]A T[T>C]C T[T>C]G T[T>C]T A[T>G]A A[T>G]C A[T>G]G A[T>G]T C[T>G]A C[T>G]C C[T>G]G C[T>G]T G[T>G]A G[T>G]C G[T>G]G G[T>G]T T[T>G]A T[T>G]C T[T>G]G T[T>G]T 0 2 4 6 8 10 12 C>A C>G C>T T>A T>C T>G
A[C>A]A A[C>A]C A[C>A]G A[C>A]T C[C>A]A C[C>A]C C[C>A]G C[C>A]T G[C>A]A G[C>A]C G[C>A]G G[C>A]T T[C>A]A T[C>A]C T[C>A]G T[C>A]T A[C>G]A A[C>G]C A[C>G]G A[C>G]T C[C>G]A C[C>G]C C[C>G]G C[C>G]T G[C>G]A G[C>G]C G[C>G]G G[C>G]T T[C>G]A T[C>G]C T[C>G]G T[C>G]T A[C>T]A A[C>T]C A[C>T]G A[C>T]T C[C>T]A C[C>T]C C[C>T]G C[C>T]T G[C>T]A G[C>T]C G[C>T]G G[C>T]T T[C>T]A T[C>T]C T[C>T]G T[C>T]T A[T>A]A A[T>A]C A[T>A]G A[T>A]T C[T>A]A C[T>A]C C[T>A]G C[T>A]T G[T>A]A G[T>A]C G[T>A]G G[T>A]T T[T>A]A T[T>A]C T[T>A]G T[T>A]T A[T>C]A A[T>C]C A[T>C]G A[T>C]T C[T>C]A C[T>C]C C[T>C]G C[T>C]T G[T>C]A G[T>C]C G[T>C]G G[T>C]T T[T>C]A T[T>C]C T[T>C]G T[T>C]T A[T>G]A A[T>G]C A[T>G]G A[T>G]T C[T>G]A C[T>G]C C[T>G]G C[T>G]T G[T>G]A G[T>G]C G[T>G]G G[T>G]T T[T>G]A T[T>G]C T[T>G]G T[T>G]T 0 1 2 3 4 5 6 7 C>A C>G C>T T>A T>C T>G 0 1 2 3 4 5 6 7 Copy number 21 14 8 88 14 141414 1919 21 14 DUSP22 IRF4 HLA G HLA B LTB NOTCH4CDKN1A PIM1 CCND3 BAI3
COL9A1 PRDM1 ROS1 ARID1B
1e+00 1e+02 1e+04 1e+06
0
1e+07 2e+07 3e+07 4e+07 5e+07 6e+07 7e+07 8e+07 9e+07 1e+08
1.1e+08 1.2e+08 1.3e+08 1.4e+08 1.5e+08 1.6e+08 1.7e+08
Intermutation distance 0 1 2 3 4 5 6 7 8 9 10 Copy number 12161616 16 16 16 16 16 161616161616 161616161616 16 16 7 7 9 21 8 8 TCF3 MAP2K7 TYK2 NOTCH3 MEF2B PRKD2 1e+00 1e+02 1e+04 1e+06 0
1e+07 2e+07 3e+07 4e+07 5e+07
Intermutation distance
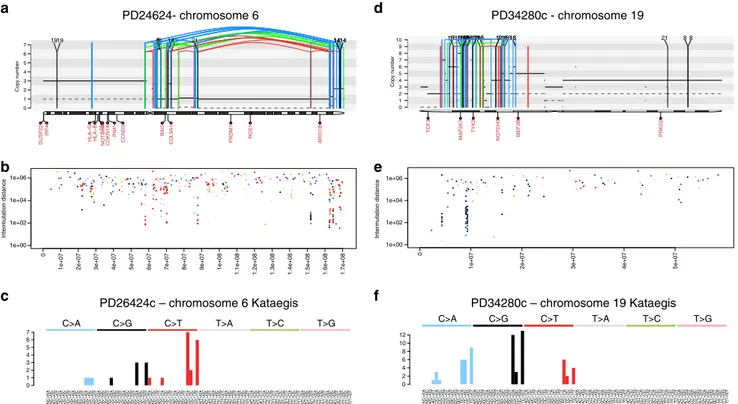
PD26424c – chromosome 6 Kataegis PD34280c – chromosome 19 Kataegis
PD24624- chromosome 6 PD34280c - chromosome 19 a b c d e f
Fig. 5 Kataegis in hematological malignancies. a Example of a MM patient with a chromothripsis on chromosome 6 associated with APOBEC-mediated kataegis. The solid and dashed lines reflect the total ploidy and the copy number status of the minor allele, respectively. In these plots, the red arch represents a deletion, the green arch represents a tandem duplication and the blue arch represents an inversion.b Inter-mutational distance of all mutations in chromosome 6, color-coded by mutational class.c Ninety-six-mutational classes of all kataegis events on chromosome 6. d Chromothripsis event on chromosome 19 in a therapy-related AML.e Inter-mutational distance of all mutations across chromosome 19. f Ninety-six-mutational classes of all mutations involved in the chromosome 19 kataegis: APOBEC emerged as the dominant mutational process, despite its activity was not detectable across the genome (Supplementary Software File 3)
PD34280PD37515
TCGA–AB–2905TCGA–AB–2906TCGA–AB–2907TCGA–AB–2963TCGA–AB–2964TCGA–AB–2965TCGA–AB–2966TCGA–AB–2967TCGA–AB–2968TCGA–AB–2969TCGA–AB–2970TCGA–AB–2971TCGA–AB–2972TCGA–AB–2973TCGA–AB–2974TCGA–AB–2975TCGA–AB–2976TCGA
–AB–2977
TCGA–AB–2978TCGA–AB–2979TCGA–AB–2980TCGA–AB–2981TCGA–AB–2982TCGA–AB–2983TCGA–AB–2984TCGA–AB–2985TCGA–AB–2986TCGA–AB–2987TCGA–AB–2988TCGA–AB–2989TCGA–AB–2990TCGA–AB–2991TCGA–AB–2992TCGA–AB–2993TCGA–AB–2994TCGA–AB–2995TCGA–AB–2996TCGA–AB–2997TCGA–AB–2998TCGA–AB–2999TCGA–AB–3000TCGA–AB–3001TCGA–AB–3002TCGA–AB–3005TCGA–AB–3006TCGA–AB–3007TCGA–AB–3008TCGA–AB–3009TCGA–AB–3011TCGA–AB–3012 TCGA–AB–2905TCGA–AB–2906TCGA–AB–2907TCGA–AB–2963TCGA–AB–2964TCGA–AB–2965 TCGA–AB–2966TCGA–AB–2967TCGA–AB–2968TCGA–AB–2969TCGA–AB–2970TCGA–AB–2971 TCGA–AB–2972TCGA–AB–2973TCGA–AB–2974TCGA–AB–2975TCGA–AB–2976TCGA
–AB–2977
TCGA–AB–2978TCGA–AB–2979TCGA–AB–2980TCGA–AB–2981TCGA–AB–2982TCGA–AB–2983 TCGA–AB–2984TCGA–AB–2985TCGA–AB–2986TCGA–AB–2987TCGA–AB–2988TCGA–AB–2989 TCGA–AB–2990TCGA–AB–2991TCGA–AB–2992TCGA–AB–2993TCGA–AB–2994TCGA–AB–2995 TCGA–AB–2996TCGA–AB–2997TCGA–AB–2998TCGA–AB–2999TCGA–AB–3000TCGA–AB–3001 TCGA–AB–3002TCGA–AB–3005TCGA–AB–3006TCGA–AB–3007TCGA–AB–3008TCGA–AB–3009 TCGA–AB–3011TCGA–AB–3012
0.0 0.2 0.4 0.6 0.8 1.0 0 0.05 0.1 0.15 C>A C>G C>T T>A T>C T>G
a Platinum signature c HSCP signature
b d 0 0.05 0.1 0.15 C>A C>G C>T T>A T>C T>G 0.0 0.2 0.4 0.6 0.8 1.0 Sig. 1-5 HSPC Sig. Sig. 1-5 HSPC Sig. Platinum Sig.
Fig. 7 Bleeding of signatures in AMLs. Example of inter-sample bleeding among 52 AML WGSs. a, b Running NNMF on the entire cohort, we extracted two mutational signatures not currently included in COSMIC: one recently associated with platinum exposure and the second recently reported as a process specific to the hemopoietic stem cell (HPSC). c, d The inclusion of two t-AMLs (PD34280 and PD37515) affects the global signature extraction, with Platinum Signature extracted also in the primary AMLs. Removing the t-AMLs the inter-sample bleeding was corrected, and no Platinum Signature was extracted in primary AMLs. Sig.= signature
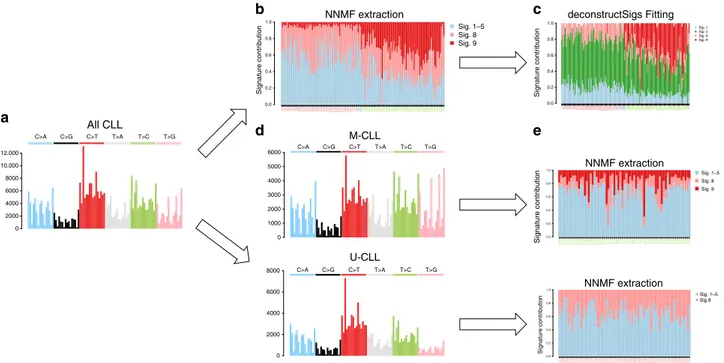
0.0 0.2 0.4 0.6 0.8 1.0 CLL5CLL12CLL16CLL20CLL23CLL25CLL26CLL27CLL30CLL48CLL56CLL58CLL63CLL82CLL83CLL134CLL138CLL139CLL141CLL145CLL157CLL166CLL176CLL184CLL188CLL277CLL282CLL290CLL294CLL296CLL306CLL318CLL356CLL371CLL386CLL435CLL442CLL723CLL749CLL761CLL853CLL875CLL1059CLL1076CLL1101CLL1169CLL1183CLL1192CLL1297CLL1344CLL1371CLL1384CLL1431CLL148CLL802CLL1432CLL10 CLL1191CLL1430CLL177CLL358CLL577CLL1267CLL15CLL6CLL677CLL278CLL128CLL44CLL753CLL1078CLL9CLL199CLL618CLL880CLL1446CLL174CLL372CLL661CLL1319 CLL29CLL283CLL1164CLL367CLL795CLL804CLL1424CLL192CLL467CLL1179CLL564CLL745CLL343CLL393CLL39CLL832CLL519CLL1525CLL783CLL1360CLL137CLL90CLL342CLL33CLL4CLL654CLL1353CLL288CLL1426CLL1425CLL1427CLL84CLL1276CLL151CLL308CLL776CLL244CLL477CLL32CLL862CLL1056CLL628CLL1423CLL179CLL473CLL594CLL523CLL684CLL1477CLL125CLL1464CLL1323CLL181CLL115CLL122CLL373CLL1292CLL64CLL60CLL339CLL824CLL887CLL1339 Sig. 1–5 Sig. 8 Sig. 9 0 2000 4000 6000 8000 10,000 12,000 C>A C>G C>T T>A T>C T>G 0 1000 2000 3000 4000 5000 6000 C>A C>G C>T T>A T>C T>G 0 2000 4000 6000 8000 C>A C>G C>T T>A T>C T>G 0.0 0.2 0.4 0.6 0.8 1.0 CLL1056CLL115CLL1164CLL1179CLL122CLL125CLL1276CLL1292CLL1319CLL1323CLL1353CLL1360CLL137CLL1423CLL1424CLL1425CLL1426CLL1427CLL1446CLL1464CLL1477CLL151CLL1525CLL174CLL179CLL181CLL192CLL199CLL244CLL283CLL288CLL29CLL308CLL32CLL33CLL342CLL343CLL367CLL372CLL373CLL39CLL393CLL4CLL467CLL473CLL477CLL519CLL523CLL564CLL594CLL60CLL618CLL628CLL64CLL654CLL661CLL684CLL745CLL776CLL783CLL795CLL804CLL832CLL84CLL862CLL880CLL90 0.0 0.2 0.4 0.6 0.8 1.0 CLL10 CLL1059CLL1076CLL1078CLL1101CLL1169CLL1183CLL1191CLL1192 CLL12 CLL1267CLL128CLL1297CLL134CLL1344CLL1371CLL138CLL1384CLL139CLL141CLL1430CLL1431CLL1432CLL145CLL148CLL15CLL157CLL16CLL166CLL176CLL177CLL184CLL188CLL20CLL23CLL25CLL26CLL27CLL277CLL278CLL282CLL290CLL294CLL296CLL30CLL306CLL318CLL356CLL358CLL371CLL386CLL435CLL44CLL442CLL48CLL5CLL56CLL577 CLL58CLL6CLL63CLL677CLL723CLL749CLL753CLL761CLL802CLL82CLL83CLL853CLL875 CLL9 0.0 0.2 0.4 0.6 0.8 1.0 CLL5CLL12 CLL16 CLL20 CLL23 CLL25 CLL26 CLL27 CLL30 CLL48 CLL56 CLL58 CLL63 CLL82 CLL83CLL134 CLL138 CLL139 CLL141 CLL145 CLL157 CLL166 CLL176 CLL184 CLL188 CLL277 CLL282 CLL290 CLL294 CLL296 CLL306 CLL318 CLL356 CLL371 CLL386 CLL435 CLL442 CLL723 CLL749 CLL761 CLL853 CLL875CLL1059 CLL1076 CLL1101 CLL1169 CLL1183 CLL1192 CLL1297 CLL1344 CLL1371 CLL1384 CLL1431CLL148 CLL802CLL1432CLL10CLL1191 CLL1430CLL177 CLL358 CLL577CLL1267CLL15CLL6CLL677 CLL278CLL128CLL44CLL753CLL1078CLL9CLL199 CLL618 CLL880CLL1446CLL174 CLL372 CLL661CLL1319CLL29CLL283CLL1164CLL367 CLL795 CLL804CLL1424CLL192 CLL467CLL1179CLL564 CLL745 CLL343 CLL393CLL39CLL832 CLL519CLL1525CLL783CLL1360CLL137CLL90CLL342CLL33CLL4CLL654CLL1353CLL288CLL1426 CLL1425 CLL1427CLL84CLL1276CLL151 CLL308 CLL776 CLL244 CLL477CLL32CLL862CLL1056CLL628CLL1423CLL179 CLL473 CLL594 CLL523 CLL684CLL1477CLL125CLL1464 CLL1323CLL181 CLL115 CLL122 CLL373CLL1292CLL64 CLL60CLL339 CLL824 CLL887CLL1339 Sig. 1 Sig. 5 Sig. 8 Sig. 9 NNMF extraction Signature contribution deconstructSigs Fitting Signature contribution Signature contribution Signature contribution M-CLL U-CLL NNMF extraction NNMF extraction All CLL Sig. 1–5 Sig 8 Sig. 1–5 Sig. 8 Sig. 9 a b c d e
Fig. 6 Bleeding of signatures in CLLs. Summary of mutational signature analysis on 146 CLL cases. From the 96-mutational catalog (a) the Alexandrov et al.6,7framework (NNMF) extracted different mutational processes. Signature 9 (nc-AID) was extracted also among U-CLL in contrast with their known
pathogenesis (b). This is a typical example of inter-sample bleeding and it can be solved either running afitting approach after the initial NNMF analysis using only the catalog of signatures extracted by NNMF (c), or analyzing M-CLL and U-CLLs in two different and independent runs (d, e). Using the 30 COSMIC signatures as reference, thefirst approach is usually the most appropriate in order to estimate the real contribution of each single mutational process. In fact, the NNMF extracted signatures may be over or under split, therefore preventing a precise estimation of their contribution. For example, in this analysis, Signature 1 and 5 were extracted as one single process and only by running afitting approach we were able to differentiate these two processes (c). Sig.= signature. In b and c, red patient labels are used for U-CLL, green for M-CLL, and blue for unknown cases
In general, our preferred approach to investigate mutational signatures in hematological malignancies follows three different steps: (1) signature discovery with a de novo extraction process; (2) assignment of extracted signatures to a reference catalog (i.e., COSMIC) and possibly identification of novel ones; (3) a fitting approach including only the subset of COSMIC signatures
identified from the extraction process (Fig. 8). This multi-step
approach allows the identification of known and novel signatures and their correct quantification, avoiding artefactual calls related to bleeding and overfitting. Based on a similar approach, two novel robust and stringent tools have recently been developed allowing the identification of >30 new mutational signatures and the redefinition of the previous 30-COSMIC signatures, creating a
catalog to be used as reference for future studies31. These
improved knowledge banks and bio-informatic tools will further refine our ability to investigate mutational signatures in hema-tological malignancies. However, we are convinced that prior knowledge of cancer biology and genomics will always be indis-pensable for a correct data interpretation.
Methods
Sample selection and processing of genomic data. In this study, we analyzed the single-nucleotide variant (SNV) catalog from four WGS cohorts: 143 CLLs (EGAS00000000092)52,53, 30 MMs (EGAD00001003309)3,9, 50 AMLs (phs000178.
v1.p1)59, and two unpublished t-AML (EGAD00001005028). These last two cases
were sequenced after written informed consent was obtained at the Wellcome Sanger Institute using the X10 Illumina platform. FASTQfiles were aligned to the reference genome using BWAmem, and deduplicated aligned BAMfiles were analyzed using the following tools: ASCAT for copy number changes, BRASS for structural variations (large inversions and deletions, translocations, internal tan-dem duplication), Caveman and Pindel for Single-Nucleotide Variants (SNVs) and small insertion-deletions20,66–68, respectively. The characterization of the main clinical and genomic features of MM and CLL series is summarized in Supple-mentary Table 1 and SuppleSupple-mentary Data 2, respectively. Kataegis was defined as a cluster of 6 or more consecutive mutations with an average intermutation distance of less than or equal to 1 Kb20.
The study involved the use of human samples, which were collected after written informed consent was obtained (Wellcome Trust Sanger Institute protocol
number 15/046 for the myeloma samples, Fondazione IRCCS Istituto Nazionale dei Tumori code 127/16 for the t-AML samples).
Mutational signature workflow. Mutational signatures were investigated using three published and available algorithms: the Alexandrov et al.6NNMF framework,
deconstructSigs24and mutationalPatterns37R packages. The full
mutatio-nalPatterns analysis was written in R and the code is provided in Supplementary Sofware Files 1–3 for MM, CLL, and AML respectively. Each of the above methods produces a matrix decomposition C≈ SE, where C is the catalog matrix, with mutation types as rows and samples as columns, S is the signature matrix, with mutation types as rows and signatures as columns, and E is the exposure matrix, with signatures as rows and samples as columns (Supplementary Fig. 1). The reconstruction error indicates how similar the mutational profiles of samples in C are to those in the product SE, and can be computed using different metrics, such as cosine similarity, Kullback-Leibler divergence (KLD) or RMSE.
Each of the signatures extracted with either mutationalPatterns or the method from Alexandrov et al.6,7,37were assigned to one or a combination of two COSMIC
signatures. To do so, cosine similarities between the extracted signatures and each COSMIC signature, or a linear combination of two COSMIC signatures (using non-negative least squares R package NNLS), were computed. These results are available in Supplementary Data 1.
HRDetect in multiple myeloma. Analysis of homologous recombination de fi-ciency (HRD) from BRCA1/BRCA2 defifi-ciency as a possible source of genomic instability was performed using the recently published HRDetect algorithm18. The
structural variant and indel catalog in MM were generated using BRASS and Pindel, respectively20,67.
Single-nucleotide variants on IGH. The mutation cancer cell fraction for c-AID SNVs was estimated using the Dirichlet process for both CLLs and MMs4,9.
Considering the well-known complexity and low-quality mappping of IGH region, we ran three additional SNV callers (mutect269, caveman66, and muse70) to reduce
the rate of false positives and we combined the results with the published catalog of SNVs generated with Sidron52. Seventy-nine percent of the previously published
mutations on IGH was confirmed by at least one additional caller (Supplementary Fig. 12). Furthermore 512 additional SNVs were called by at least two out of the three new callers. Only mutations called by at least 2 out of 4 callers were included in thefinal analysis.
Reporting summary. Further information on research design is available in the Nature Research Reporting Summary linked to this article.
Signature.9 0.00 0.01 0.02 0.03 0.04 0.05 Signature.13 0.00 0.05 0.10 0.15 0.20 0.25 0.30 MM1 0.00 0.01 0.02 0.03 0 1000 2000 3000 4000
PD26400a PD26401a PD26402a PD26403a PD26404a PD26405a PD26406a PD26407a PD26408a PD26409a PD26410d PD26411c PD26412a PD26414a PD26415c PD26416d PD26418a PD26419a PD26420a PD26422e PD26423e PD26424a PD26425e PD26426e PD26427a PD26428a PD26429a PD26432c PD26434c PD26435c
0.0 0.2 0.4 0.6 0.8 1.0 Signature.1 Signature.2 Signature.5 Signature.8 Signature.9 Signature.13 MM1 a b Signature.1 0.00 0.05 0.10 0.15 0.0 0.1 0.2 0.3 0.4 Signature.5 0.000 0.005 0.010 0.015 0.020 0.025 0.030 0.035 Signature.8 0.000 0.005 0.010 0.015 0.020 0.025 0.030 0.035 Signature 1 Signature 2 MM1 Sig. 1 Sig. 2 Sig. 5 Sig. 8 Sig. 9 Sig. 13 MM1 C>G C>T T>A T>C T>G C>G Single nucleotide variant
(SNV) catalogue 96-mutational classes catalogue 96-mutational classes catalogue All SNVs genome-wide All SNVs localized Signature extraction (de novo) Signature extraction (de novo) Signature assignment (COSMIC or PCAWG) Signature fitting (COSMIC or PCAWG) Signature fitting (COSMIC or PCAWG) Signature assignment (COSMIC or PCAWG) SampleID Pos 1511295 PD26400a PD26400a Chrom 1 2 Ref A A C 26556200 Alt C Catalogue Extraction Fitting Signature 5 Signature 8 Signature 9 Signature 13
Fig. 8 Mutational Signature workflow. Our suggested workflow for mutational signature analysis for both genome-wide and clustered processes (a) and an example of its application on 30 MM WGSs (b)
Code availability
All R codes used to generate signature data using mutationalPatterns in the paper are provided as Supplementary Software Files 1–3. All codes have been generated using R software v. 3.4.2.
Data availability
The sequencing data pertaining to MM are available from the European Genome-phenome archive (EGA) database under the accession codeEGAD00001003309. The sequencing data pertaining to CLL are available from EGA under the accession code
EGAS00000000092. The published and unpublished AML sequencing data are available from dbGAP under the accession codephs000178and from EGA dbGAP under the accession codeEGAD00001005028, respectively. The breast cancer WGSs are available from the EGA under the accession codeEGAS0000100117820. All the other data
supporting thefindings of this study are available within the article and its supplementary informationfiles and from the corresponding author upon reasonable request. A reporting summary for this article is available as a Supplementary Informationfile.
Received: 18 October 2018 Accepted: 10 June 2019
References
1. Stratton, M. R., Campbell, P. J. & Futreal, P. A. The cancer genome. Nature 458, 719–724 (2009).
2. Martincorena, I. et al. Universal patterns of selection in cancer and somatic tissues. Cell 171, 1029–1041 e1021 (2017).
3. Maura, F. et al. Genomic landscape and chronological reconstruction of driver events in multiple myeloma. Preprint at,https://www.biorxiv.org/content/ 10.1101/388611v1(2018).
4. Bolli, N. et al. Heterogeneity of genomic evolution and mutational profiles in multiple myeloma. Nat. Commun. 5, 2997 (2014).
5. Landau, D. A. et al. Mutations driving CLL and their evolution in progression and relapse. Nature 526, 525–530 (2015).
6. Alexandrov, L. B. et al. Signatures of mutational processes in human cancer. Nature 500, 415–421 (2013).
7. Alexandrov, L. B., Nik-Zainal, S., Wedge, D. C., Campbell, P. J. & Stratton, M. R. Deciphering signatures of mutational processes operative in human cancer. Cell Rep. 3, 246–259 (2013).
8. Helleday, T., Eshtad, S. & Nik-Zainal, S. Mechanisms underlying mutational signatures in human cancers. Nat. Rev. Genet. 15, 585–598 (2014). 9. Bolli, N. et al. Genomic patterns of progression in smoldering multiple
myeloma. Nat. Commun. 9, 3363 (2018).
10. Kasar, S. et al. Whole-genome sequencing reveals activation-induced cytidine deaminase signatures during indolent chronic lymphocytic leukaemia evolution. Nat. Commun. 6, 8866 (2015).
11. Greenman, C. et al. Patterns of somatic mutation in human cancer genomes. Nature 446, 153–158 (2007).
12. Pfeifer, G. P. et al. Tobacco smoke carcinogens, DNA damage and p53 mutations in smoking-associated cancers. Oncogene 21, 7435–7451 (2002).
13. Pleasance, E. D. et al. A small-cell lung cancer genome with complex signatures of tobacco exposure. Nature 463, 184–190 (2010).
14. Pleasance, E. D. et al. A comprehensive catalogue of somatic mutations from a human cancer genome. Nature 463, 191–196 (2010).
15. Nik-Zainal, S. et al. Mutational processes molding the genomes of 21 breast cancers. Cell 149, 979–993 (2012).
16. Alexandrov, L. B. et al. Clock-like mutational processes in human somatic cells. Nat. Genet. 47, 1402–1407 (2015).
17. Alexandrov, L. B. et al. Mutational signatures associated with tobacco smoking in human cancer. Science 354, 618–622 (2016).
18. Davies, H. et al. HRDetect is a predictor of BRCA1 and BRCA2 deficiency based on mutational signatures. Nat. Med. 23, 517–525 (2017).
19. Davies, H. et al. Whole-genome sequencing reveals breast cancers with mismatch repair deficiency. Cancer Res. 77, 4755–4762 (2017). 20. Nik-Zainal, S. et al. Landscape of somatic mutations in 560 breast cancer
whole-genome sequences. Nature 534, 47–54 (2016).
21. Maura, F. et al. Biological and prognostic impact of APOBEC-induced mutations in the spectrum of plasma cell dyscrasias and multiple myeloma cell lines. Leukemia. 32, 1044–1048 (2018).
22. Walker, B. A. et al. APOBEC family mutational signatures are associated with poor prognosis translocations in multiple myeloma. Nat. Commun. 6, 6997 (2015).
23. Blokzijl, F. et al. Tissue-specific mutation accumulation in human adult stem cells during life. Nature 538, 260–264 (2016).
24. Rosenthal, R., McGranahan, N., Herrero, J., Taylor, B. S. & Swanton, C. DeconstructSigs: delineating mutational processes in single tumors distinguishes DNA repair deficiencies and patterns of carcinoma evolution. Genome Biol. 17, 31 (2016).
25. Drost, J. et al. Use of CRISPR-modified human stem cell organoids to study the origin of mutational signatures in cancer. Science 358, 234–238 (2017). 26. Fischer, A., Illingworth, C. J., Campbell, P. J. & Mustonen, V. EMu:
probabilistic inference of mutational processes and their localization in the cancer genome. Genome Biol. 14, R39 (2013).
27. Gehring, J. S., Fischer, B., Lawrence, M. & Huber, W. SomaticSignatures: inferring mutational signatures from single-nucleotide variants. Bioinformatics 31, 3673–3675 (2015).
28. Rosales, R. A., Drummond, R. D., Valieris, R., Dias-Neto, E. & da Silva, I. T. signeR: an empirical Bayesian approach to mutational signature discovery. Bioinformatics 33, 8–16 (2017).
29. Covington, K., Shinbrot, E. & Wheeler, D. A. Mutation signatures reveal biological processes in human cancer. bioRxiv (2016).
30. Rebhandl, S. et al. APOBEC3 signature mutations in chronic lymphocytic leukemia. Leukemia 28, 1929–1932 (2014).
31. Alexandrov, L. et al. The Repertoire of Mutational Signatures in Human Cancer. Preprint at,https://www.biorxiv.org/content/10.1101/322859v1
(2018).
32. Hoang, P. H. et al. Whole-genome sequencing of multiple myeloma reveals oncogenic pathways are targeted somatically through multiple mechanisms. Leukemia 32, 2459–2470 (2018).
33. Walker, B. A. et al. Identification of novel mutational drivers reveals oncogene dependencies in multiple myeloma. Blood 132, 587–597 (2018).
34. Huang, X., Wojtowicz, D. & Przytycka, T. M. Detecting presence of mutational signatures in cancer with confidence. Bioinformatics. 34, 330–337 (2018). 35. Roberts, S. A. & Gordenin, D. A. Hypermutation in human cancer genomes:
footprints and mechanisms. Nat. Rev. Cancer 14, 786–800 (2014). 36. Roberts, S. A. & Gordenin, D. A. Clustered and genome-wide transient
mutagenesis in human cancers: hypermutation without permanent mutators or loss offitness. Bioessays 36, 382–393 (2014).
37. Blokzijl, F., Janssen, R., van Boxtel, R. & Cuppen, E. MutationalPatterns: comprehensive genome-wide analysis of mutational processes. Genome Med. 10, 33 (2018).
38. Fujimoto, A. et al. Whole-genome mutational landscape and characterization of noncoding and structural mutations in liver cancer. Nat. Genet. 48, 500–509 (2016).
39. Chapman, M. A. et al. Initial genome sequencing and analysis of multiple myeloma. Nature 471, 467–472 (2011).
40. Corre, J., Munshi, N. & Avet-Loiseau, H. Genetics of multiple myeloma: another heterogeneity level? Blood 125, 1870–1876 (2015).
41. Keats, J. J. et al. Clonal competition with alternating dominance in multiple myeloma. Blood 120, 1067–1076 (2012).
42. Lohr, J. G. et al. Widespread genetic heterogeneity in multiple myeloma: implications for targeted therapy. Cancer Cell 25, 91–101 (2014). 43. Morgan, G. J., Walker, B. A. & Davies, F. E. The genetic architecture of
multiple myeloma. Nat. Rev. Cancer 12, 335–348 (2012).
44. Walker, B. A. et al. Mutational spectrum, copy number changes, and outcome: results of a sequencing study of patients with newly diagnosed myeloma. J. Clin. Oncol. 33, 3911–3920 (2015).
45. Nik-Zainal, S. et al. The life history of 21 breast cancers. Cell 149, 994–1007 (2012).
46. Abkevich, V. et al. Patterns of genomic loss of heterozygosity predict homologous recombination repair defects in epithelial ovarian cancer. Br. J. Cancer 107, 1776–1782 (2012).
47. Maciejowski, J., Li, Y., Bosco, N., Campbell, P. J. & de Lange, T.
Chromothripsis and kataegis induced by telomere crisis. Cell 163, 1641–1654 (2015).
48. Basso, K. & Dalla-Favera, R. Germinal centres and B cell lymphomagenesis. Nat. Rev. Immunol. 15, 172–184 (2015).
49. Fais, F. et al. Chronic lymphocytic leukemia B cells express restricted sets of mutated and unmutated antigen receptors. J. Clin. Invest. 102, 1515–1525 (1998).
50. Hamblin, T. J., Davis, Z., Gardiner, A., Oscier, D. G. & Stevenson, F. K. Unmutated Ig V(H) genes are associated with a more aggressive form of chronic lymphocytic leukemia. Blood 94, 1848–1854 (1999).
51. Landau, D. A. et al. Evolution and impact of subclonal mutations in chronic lymphocytic leukemia. Cell 152, 714–726 (2013).
52. Puente, X. S. et al. Non-coding recurrent mutations in chronic lymphocytic leukaemia. Nature 526, 519–524 (2015).
53. Puente, X. S. et al. Whole-genome sequencing identifies recurrent mutations in chronic lymphocytic leukaemia. Nature 475, 101–105 (2011).
54. Pasqualucci, L. et al. BCL-6 mutations in normal germinal center B cells: evidence of somatic hypermutation acting outside Ig loci. Proc. Natl Acad. Sci. USA 95, 11816–11821 (1998).