Edited by:
Dr. Saumen Kumar Maitra, Visva-Bharati University, India
Reviewed by:
Taisen Iguchi, National Institute for Basic Biology, Japan Daniel Garcia De La Serrana, University of St Andrews, UK *Correspondence: Encarnación Capilla [email protected] †Present address: Cristina Salmerón, Marine Biology Research Division, Scripps Institution of Oceanography, University of California, La Jolla, CA, USA
Specialty section:
This article was submitted to Experimental Endocrinology, a section of the journal Frontiers in Endocrinology Received: 20 June 2016 Accepted: 05 August 2016 Published: 22 August 2016 Citation: Salmerón C, Riera-Heredia N, Gutiérrez J, Navarro I and Capilla E (2016) Adipogenic Gene Expression in Gilthead Sea Bream Mesenchymal Stem Cells from Different Origin. Front. Endocrinol. 7:113. doi: 10.3389/fendo.2016.00113
adipogenic gene expression in
gilthead sea Bream Mesenchymal
stem cells from Different Origin
Cristina Salmerón†, Natàlia Riera-Heredia, Joaquim Gutiérrez, Isabel Navarro and Encarnación Capilla*Department of Cell Biology, Physiology and Immunology, Faculty of Biology, University of Barcelona, Barcelona, Spain
During the last decades, adipogenesis has become an emerging field of study in aqua-culture due to the relevance of the adipose tissue in many physiological processes and its connection with the endocrine system. In this sense, recent studies have translated into the establishment of preadipocyte culture models from several fish species, sometimes lacking information on the mRNA levels of adipogenic genes. Thus, the aim of this study was to determine the gene expression profile of gilthead sea bream (Sparus aurata) primary cultured mesenchymal stem cells (MSCs) from different origin (adipose tissue and vertebra bone) during adipogenesis. Both cell types differentiated into adipocyte-like cells, accumulating lipids inside their cytoplasm. Adipocyte differentiation of MSCs from adipose tissue resulted in downregulation of several adipocyte-related genes (such as
lpl, hsl, pparα, pparγ and gapdh2) at day 4, gapdh1 at day 8, and fas and pparβ at day
12. In contrast, differences in lxrα mRNA expression were not observed, while g6pdh levels increased during adipocyte maturation. Gapdh and Pparγ protein levels were also detected in preadipocyte cultures; however, only the former increased its expression during adipogenesis. Moreover, differentiation of bone-derived cells into adipocytes also resulted in the downregulation of several adipocyte gene markers, such as fas and
g6pdh at day 10 and hsl, pparβ, and lxrα at day 15. On the other hand, the osteogenic
genes fib1a, mgp, and op remained stable, but an increase in runx2 expression at day 20 was observed. In summary, the present study demonstrates that gilthead sea bream MSCs, from both adipose tissue and bone, differentiate into adipocyte-like cells, although revealed some kind of species- and cell lineage-specific regulation with regards to gene expression. Present data also provide novel insights into some of the potential key genes controlling adipogenesis in gilthead sea bream that can help to better understand the regulation of lipid storage in fish.
Keywords: Mscs, adipogenesis, adipocyte, bone, Sparus aurata
inTrODUcTiOn
Traditionally adipose tissue was considered a mere energy store, synthesizing and accumulating triglycerides during caloric excess periods and releasing fatty acids and glycerol when needed, as under nutritional restriction. However, this changed with the discovery of the adipose tissue-produced hormone leptin in 1994 (1). Adipocytes and cells in the stromal vascular fraction of
adipose tissue produce many hormones, cytokines, and other molecules, with more than 50 described to date also in fish (2–8), which act on the central nervous system and peripheral organs regulating several processes, such as glucose and lipid metabolism (9, 10). Thus, it is now recognized that adipose tissue is an active contributor to the regulation of whole-body energy homeostasis.
Adipose tissue grows by increasing the size of existing adi-pocytes (hypertrophy), its number based on the formation of new adipocytes from precursor cells (hyperplasia), or both (11). These two adipocyte developmental types occur not only during the early life stages but also throughout life (12, 13). In addition to adipocytes, the adipose tissue also comprises a stromal vascular fraction formed by a heterogeneous population of cells, contain-ing mesenchymal stem cells (MSCs) that include multipotent cells with the ability to differentiate into adipocytes, chondrocytes, and osteoblasts, among other cell lineages (14, 15). The process of adipocyte differentiation is divided in two steps and is influenced by hormones, growth factors, cytokines, and nutrients. First, the multipotent MSCs undergo a process known as determination (16, 17). This process results in cells that are morphologically similar to fibroblasts, which appear identical to MSCs, but are only able to differentiate into adipocytes. As a result, the cells in this post-determination state are called preadipocytes or adipo-blasts. The second stage, the proper differentiation, consists in the formation of structurally mature adipocytes from preadipocytes and is commonly known as adipogenesis, where changes in cel-lular morphology, hormone sensitivity, and secretory capacity of the cells occur (18, 19). These changes are regulated through the coordinated expression of mainly transcription factors, which in turn act to activate transcription of genes that produce the adi-pocyte phenotype (20, 21). The peroxisome proliferator-activated receptor γ (Pparγ) is the central regulator of adipogenesis and is responsible for activating a number of genes involved in fatty acid binding, uptake, and storage, including lipoprotein lipase (lpl) or phosphoenolpyruvate carboxykinase, among others.
The interest in the adipogenic process and its regulation in fish has increased in the last years, because in aquaculture, the excessive fat accumulation experienced by some cultured species is generally perceived as an undesirable trait by the consumers and also has negative effects in terms of production, product lifetime, and fish health. Therefore, several primary cultures of preadipocytes have been established to better understand adipo-genesis and its endocrine regulation in fish, including Atlantic salmon (Salmo salar) (8), red sea bream (Pagrus major) (22), rainbow trout (Oncorhynchus mykiss) (23), large yellow croaker (Pseudosciaena crocea) (24), grass carp (Ctenopharyngodon idella) (25), gilthead sea bream (Sparus aurata) (26), and common carp (Cyprinus carpio) (27). However, knowledge on the gene expres-sion pattern during fish adipogenesis is usually scarce, especially in sparids, with only two microarray studies reported to date in salmonids, one in Atlantic salmon (7) and the other in rainbow trout (28).
Adipocytes and osteoblasts arise from a common precursor cell, which after the induction of certain transcription factors, differentiates into each one of these two cell types. As mentioned before, Pparγ is the master transcription factor for adipocyte
differentiation, while runt-related transcription factor 2 (Runx2) is considered the one regulating osteogenic differentiation (20). The prevalence of skeletal malformations in hatchery-reared fish stimulated the establishment of cell culture models to study the mechanisms of bone formation and development in fish. The osteoblast models described to date have been two cell lines derived from vertebra and branchial arch of gilthead sea bream (29), one cell line derived from zebrafish (Danio rerio) calcified tissues (30), and three primary cultures; one derived from gilthead sea bream vertebra bone (31) and two of Atlantic salmon, one from white muscle precursor cells (32) and one from visceral fat precursor cells (33). Using the bone-derived cells from vertebra of gilthead sea bream, we have demonstrated that they are multipotent stem cells as they can be differentiated into either osteoblasts or adipocyte-like cells using an osteogenic or an adipogenic differentiation medium (DM), respectively (31). Nevertheless, the changes that occur in the transcriptional profile of these cells during such processes have not yet been investigated either.
Furthermore, another interest of the study of these cell cul-ture models is that during the last decade in mammals, it has been speculated that the infiltration of bone marrow adipocytes during the development of osteoporosis in the elderly can be due to osteo-adipogenic transdifferentiation (34). In fish, the hematopoietic organ is the head kidney, and the bone marrow is from the beginning of its development filled with adipocytes, besides nerves, blood vessels, and connective tissue cells (35); therefore, we can hypothesize that such a process of adipocyte transdifferentiation from cells of the osteoblastic lineage may be also occurring in the adult, contributing to the whole fat content of the fish. As a first step toward exploring that possibility and using an in vitro approach, the aims of the current study were to (1) determine the transcriptional profile of gilthead sea bream preadipocytes during adipogenesis and (2) compare it with the gene expression pattern observed throughout the differentiation of bone-derived MSCs into adipocyte-like cells. To this end, we used primary cell cultures of gilthead sea bream precursor cells obtained from visceral adipose tissue and vertebra bone and analyzed well-characterized adipocyte differentiation markers and some osteogenic markers at different adipogenic stages.
MaTerials anD MeThODs
animal care
Animal care and experimental procedures complied with the Guidelines of the European Union Council (86/609/EU) and were approved by the Ethics and Animal Care Committee of the University of Barcelona, following the Catalan government-established norms and procedures (permit numbers DAAM 7951; CEEA 169/14, and DAAM 6759; CEEA 243/12 for the preparation of primary cultures derived from adipose tissue or bone, respectively).
Fish
Gilthead sea bream were obtained from a fish farm in Northern Spain and maintained in the animal facilities of the Faculty of Biology at the University of Barcelona. Fish were kept in 200 L
fiberglass tanks under 12-h light/12-h dark photoperiod at 21 ± 1°C, pH 7.5–8, 31–38% salinity and >80% oxygen saturation and fed ad libitum twice daily with a commercial diet (Skretting España SA, Burgos, Spain).
Preadipocytes and Bone cells cultures
All plasticware for tissue culture was obtained from Nunc (Barcelona, Spain); and all the reagents were purchased from Sigma–Aldrich (Tres Cantos, Spain), unless stated otherwise. Cells were incubated at 23°C with 2.5% CO2 during the wholeduration of the experiments.
Preadipocytes Cultures
Three or four juvenile gilthead sea bream of an average weight of 104 g were used for each culture. Preadipocytes were collected by mechanical disruption and enzymatic digestion of the visceral adipose tissue as described previously (26), plated at a density of 4.3 × 10⁴ cells/cm2 in gelatin-pretreated 6-well plates and
main-tained in growth media (GM) composed of Dulbecco’s Modified Eagle Medium (DMEM) with 10% fetal bovine serum (FBS), 1% antibiotic/antimycotic solution (A/A), and supplemented with 60 mM NaCl. Cells were continuously cultured in GM until day 8, once confluence was reached, and then changed to a DM containing GM plus 10 μg/mL porcine insulin, 0.5 mM 1-methyl-3-isobutylxanthine (IBMX), 0.25 μM dexamethasone, and 5 μL/ mL lipid mixture (including cholesterol and fatty acids from cod liver oil) to induce adipocyte differentiation. After 3 days, the culture conditions were changed to an adipocyte medium (AM), consisting of GM plus lipid mixture (5 μL/mL), to keep the cells already differentiating until the end of the culture. Preadipocytes samples were collected at days 4 and 8 of culture (days −4 and 0, respectively) and samples of adipocytes at days 4, 8, and 12 after induction of differentiation. Prior to harvesting, cells were washed once with phosphate-buffered saline (PBS), recovered with TRI Reagent (Ambion, Alcobendas, Spain) using a cell scraper, then transferred to an RNase-free polypropylene tube, and kept at −80°C until RNA and protein extraction.
Bone Cultures
A total of six juvenile gilthead sea bream of an average weight of 30 g were used for each culture. Bone-derived cells were isolated by mechanical disruption and enzymatic digestion of vertebra bone as described previously (31). Cells and small vertebra frag-ments were plated with GM supplemented with 19 mM NaCl and 1% fungizone (Invitrogen Life Technologies, Alcobendas, Spain), in a 10 cm culture dish. After 1 week, the fragments were removed and the attached cells collected with 0.25% trypsin– EDTA (Invitrogen Life Technologies, Alcobendas, Spain) and plated into new 10 cm plates with fresh GM. From here, the cells were routinely subcultured every time the cells reached about 70–80% confluence and used for a maximum of 10 pas-sages. Differentiation into adipocyte-like cells was achieved as previously described (31). Briefly, 70–80% confluent cells were trypsinized from 10 cm culture dishes, seeded (1 × 10⁴ cells/
cm2), and cultured in 6-well plates with GM. The following
day (i.e., day 0), media was changed first to DM, and 3 days later, changed to AM using the same experimental settings as
explained in Section “Preadipocytes Cultures.” Cell samples for RNA extraction were obtained at days 5, 10, 15, and 20 as described in Section “Preadipocytes Cultures.”
rna and Protein extraction
Simultaneous extraction of RNA and proteins from a single cell sample was performed using TRI Reagent (Ambion, Alcobendas, Spain) and following the manufacturer’s recommendations.
RNA Extraction and cDNA Synthesis
Total RNA was dissolved in DEPC-treated water (RNase-free) and stored at −80°C. RNA was quantified using a NanoDrop 2000 spectrophotometer (Thermo Scientific, Alcobendas, Spain), and its integrity was analyzed by 1% (m/v) agarose gel electrophoresis. To eliminate any residual genomic DNA, total RNA (250 ng from preadipocytes and 1 μg from bone cells) was treated with DNase I (Invitrogen, Alcobendas, Spain) and converted into cDNA using the Transcriptor First Strand cDNA Synthesis Kit (Roche, Sant Cugat del Valles, Spain), following the manufacturer’s recommendations.
Protein Extraction
Protein was extracted from the preadipocytes samples only and dissolved in RIPA buffer (Tris-HCl 50 mM, pH 7.4, NaCl 150 mM, EDTA 1 mM, NP-40 1%, Na-deoxycholate 0.25%, PMSF 1 mM, Na3VO4 1 mM, NaF 1 mM, and protease inhibitor cocktail). Then,
samples were homogenized using a “pellet pestle” for microtubes on ice, mixed in an orbital during 1 h at 4°C, and the supernatant was recovered after centrifugation during 30 min at maximum speed at 4°C. Total protein concentration was determined (595 nm) by Bradford assay using bovine serum albumin (BSA) as the standard protein (36).
Quantitative Pcr analysis
In order to characterize the transcriptional profile occurring during adipocyte differentiation in gilthead sea bream, impor-tant genes implicated in adipogenesis and energy metabolism regulation were analyzed by quantitative PCR (qPCR). The genes comprise the following enzymes: fatty acid syntase (fas),
lpl, glucose-6-phosphate dehydrogenase (g6pdh),
hormone-sensitive lipase (hsl), and glyceraldehyde 3-phosphate dehydro-genase (gapdh) 1 and 2; and the following transcription factors:
pparα, pparβ, pparγ, and liver X receptor alpha (lxrα). Moreover, the expression of four osteogenic genes, fibronectin 1a (fib1a), matrix Gla protein (mgp), osteopontin (op), and runx2, was determined in the cells derived from bone. In addition, elonga-tion factor 1α (ef1α), ribosomal protein S18 (rps18), and 18S ribosomal RNA (18s) were tested as reference genes. qPCR was performed using a CFX384 thermocycler (Bio-Rad, El Prat de Llobregat, Spain) as previously described (37). Each qPCR reaction was performed in triplicate in a total volume of 5 μL, containing 2.5 μL of the iTaq Universal SYBR Green supermix (Bio-Rad, El Prat de Llobregat, Spain), 0.125–1.25 ng of cDNA template, 250–500 nM of each primer (Table 1), and milliQ water. Samples were amplified as follows: 95°C for 3 min, and then 40 cycles of 95°C for 10 s, followed by annealing 57–69°C for 30 s (primer-dependent, Table 1), followed by dissociation
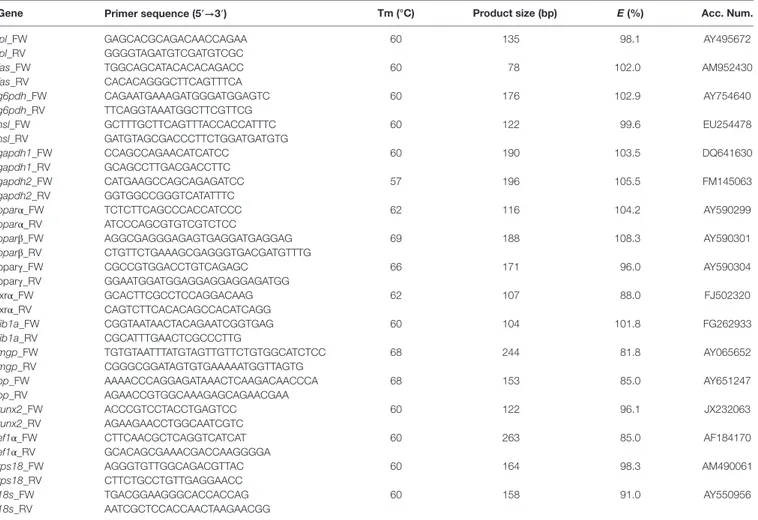
TaBle 1 | Primers used for real-time quantitative Pcr.
gene Primer sequence (5′→3′) Tm (°c) Product size (bp) E (%) acc. num.
lpl_FW GAGCACGCAGACAACCAGAA 60 135 98.1 AY495672
lpl_RV GGGGTAGATGTCGATGTCGC
fas_FW TGGCAGCATACACACAGACC 60 78 102.0 AM952430
fas_RV CACACAGGGCTTCAGTTTCA g6pdh_FW CAGAATGAAAGATGGGATGGAGTC 60 176 102.9 AY754640 g6pdh_RV TTCAGGTAAATGGCTTCGTTCG hsl_FW GCTTTGCTTCAGTTTACCACCATTTC 60 122 99.6 EU254478 hsl_RV GATGTAGCGACCCTTCTGGATGATGTG gapdh1_FW CCAGCCAGAACATCATCC 60 190 103.5 DQ641630 gapdh1_RV GCAGCCTTGACGACCTTC gapdh2_FW CATGAAGCCAGCAGAGATCC 57 196 105.5 FM145063 gapdh2_RV GGTGGCCGGGTCATATTTC
pparα_FW TCTCTTCAGCCCACCATCCC 62 116 104.2 AY590299
pparα_RV ATCCCAGCGTGTCGTCTCC
pparβ_FW AGGCGAGGGAGAGTGAGGATGAGGAG 69 188 108.3 AY590301
pparβ_RV CTGTTCTGAAAGCGAGGGTGACGATGTTTG
pparγ_FW CGCCGTGGACCTGTCAGAGC 66 171 96.0 AY590304
pparγ_RV GGAATGGATGGAGGAGGAGGAGATGG lxrα_FW GCACTTCGCCTCCAGGACAAG 62 107 88.0 FJ502320 lxrα_RV CAGTCTTCACACAGCCACATCAGG fib1a_FW CGGTAATAACTACAGAATCGGTGAG 60 104 101.8 FG262933 fib1a_RV CGCATTTGAACTCGCCCTTG mgp_FW TGTGTAATTTATGTAGTTGTTCTGTGGCATCTCC 68 244 81.8 AY065652 mgp_RV CGGGCGGATAGTGTGAAAAATGGTTAGTG
op_FW AAAACCCAGGAGATAAACTCAAGACAACCCA 68 153 85.0 AY651247
op_RV AGAACCGTGGCAAAGAGCAGAACGAA
runx2_FW ACCCGTCCTACCTGAGTCC 60 122 96.1 JX232063
runx2_RV AGAAGAACCTGGCAATCGTC
ef1α_FW CTTCAACGCTCAGGTCATCAT 60 263 85.0 AF184170
ef1α_RV GCACAGCGAAACGACCAAGGGGA
rps18_FW AGGGTGTTGGCAGACGTTAC 60 164 98.3 AM490061
rps18_RV CTTCTGCCTGTTGAGGAACC
18s_FW TGACGGAAGGGCACCACCAG 60 158 91.0 AY550956
18s_RV AATCGCTCCACCAACTAAGAACGG
lpl, lipoprotein lipase; fas, fatty acid synthase; g6pdh, glucose-6-phosphate dehydrogenase; hsl, hormone-sensitive lipase; gapdh1, glyceraldehyde 3-phosphate dehydrogenase 1; gapdh2, glyceraldehyde 3-phosphate dehydrogenase 2; pparα, peroxisome proliferator-activated receptor alpha; pparβ, peroxisome proliferator-activated receptor beta; pparγ, peroxisome proliferator-activated receptor gamma; lxrα, liver X receptor alpha; fib1a, fibronectin 1a; mgp, matrix Gla protein; op, osteopontin; runx2, runt-related transcription factor 2; ef1α, elongation factor 1 alpha; rps18, ribosomal protein S18; 18s, 18S ribosomal RNA; FW, forward primer; RV, reverse primer; Tm, annealing temperature; bp, base pair; E, amplification efficiency; Acc. Num., accession number.
step from 55 to 95°C with a 0.5°C increase every 5 s. A standard curve dilution series of a cDNA sample pool was constructed to determine the qPCR efficiency of each primer pair (Table 1), which was calculated using the CFX Manager Software (Bio-Rad). No template control (NTC), no reverse transcription control (RTC), and PCR control (PCR) were used to determine the overall performance of each qPCR assay. Relative expression levels of the target genes were determined by the Pfaffl method (38) using correction for primer efficiencies and normalizing the quantification cycle (Cq) value of each gene registered during the annealing step to that of rps18 and ef1α, the most stable refer-ence genes among the different culture stages (P > 0.05) using the CFX Manager Software (Bio-Rad). Data from preadipocytes and bone cells were obtained from 4–5 and 5–6 independent cultures, respectively.
Western Blotting
For Western blot analyses, 8 μg of protein were loaded in each lane. Proteins were separated by sodium dodecyl sulfate polyacrylamide gel electrophoresis (SDS-PAGE) (12%) and
transferred to polyvinylidene difluoride (PVDF) membranes (Bio-Rad, El Prat de Llobregat, Spain) overnight at 4°C and 100 mA. Reversible Ponceau staining was used as a loading con-trol (39). The PVDF membranes were blocked with 5% skimmed milk powder in Tris-Buffered Saline and Tween 20 (TBS-T) for 1 h 15 min and probed with rabbit polyclonal Pparγ (sc-7196) and goat polyclonal Gapdh (sc-20357) primary antibodies (Santa Cruz Biotechnology, CA, USA) at a dilution of 1:200 overnight at 4°C on a tube rotator. Membranes were washed in TBS-T and probed with a horseradish peroxidase-conjugated anti-rabbit (sc-2004) or anti-goat (sc-2020) secondary antibody (Santa Cruz Biotechnology, CA, USA) at a dilution of 1:10,000 for 1 h 15 min. Membranes were washed with TBS-T and chemiluminescent detection performed using an enhanced chemiluminescence kit (Pierce ECL Western blotting Substrate; Thermo Scientific, Alcobendas, Spain). Western blotting results were obtained from two independent cultures, and band intensities were quantified by scanning densitometry using ImageJ software (National Institutes of Health, Bethesda, MD, USA) and normalized to Ponceau staining.
Oil red O staining
To evaluate adipocyte differentiation in the bone-derived cells, intracellular neutral lipid accumulation was analyzed by Oil red O staining as explained in Ref. (31). Cells were grown as explained in Section “Bone Cultures” and samples obtained at days 5 and 15 of culture development. Quantification of cell lipid content was calculated as the absorbance measured at 490 nm divided by the read at 630 nm corresponding to cell protein content, which was obtained after Comassie blue staining for 1 h and dye extraction by incubation of the cells with 85% propylene glycol during 3 h at 60°C (31). Data are presented as fold change relative to day 5 of culture.
statistical analyses
Data normality and homoscedasticity were assessed using Shapiro–Wilk and Levene’s test, respectively. Independent sam-ples’ Student’s t-test was used for comparison between two groups. For multiple mean comparisons of normal distributed data, one-way ANOVA was used followed by Tukey’s or Dunnett’s T3
post hoc tests in case of homogeneous or heterogeneous variance
data, respectively. When data did not fit normal distribution, the non-parametric Kruskal–Wallis test, followed by Mann–Whitney test, were used. Statistical analyses were performed using SPSS Statistics version 20 (IBM, Armonk, NY, USA). Results were presented as mean ± SEM. P < 0.05 was considered to indicate a statistically significant difference. Graphs were generated using GraphPad Prism version 6.00 for Windows (GraphPad Software, La Jolla, CA, USA, www.graphpad.com).
resUlTs
gene and Protein expression Profiles
during Differentiation of Preadipocytes
Gilthead sea bream preadipocytes require the addition of a DM, a mixture of insulin, IBMX, dexamethasone, and lipid mixture, to differentiate into mature adipocytes (26). After differentiation induction, gilthead sea bream preadipocytes start to change its morphology from a fibroblast-like shape to an adipocyte-like form with an enlarged cytoplasm filled with lipids (26). The transcriptional profile during adipogenesis in gilthead sea bream preadipocytes was analyzed before (days −4 and 0) and after (days 4, 8, and 12) induction of differentiation. The mRNA levels of the early marker of adipocyte differentia-tion lpl decreased significantly from day −4 to day 4 and then gradually increased again (Figure 1A). fas and g6pdh, genes participating in the via of de novo lipogenesis from glucose and in the pentose phosphate pathway, respectively, showed opposite expression patterns, with fas gradually decreas-ing (Figure 1B), while g6pdh was significantly upregulated during most of the process (Figure 1C). The expression of the lipolysis-associated gene hsl was significantly higher in preadipocytes and late-differentiated adipocytes relative to cells at day 4 (Figure 1D). With regards to the adipocyte maturation marker gapdh, the expression of both isoforms (gapdh1 andgapdh2) significantly diminished along with differentiation
(Figures 1E,F).
Furthermore, regarding the expression of the transcription factors analyzed, pparα and pparβ, nuclear receptors that regulate the beta-oxidation of fatty acids, were significantly downregu-lated from early and at late stages of differentiation, respectively (Figures 2A,B). The transcript levels of pparγ, the nuclear recep-tor key in the process of adipocyte differentiation, decreased significantly after the addition of the DM (day 4), but then its expression was maintained along with adipocyte maturation (Figure 2C). Finally, the mRNA levels of lxrα, a nuclear receptor participating in the regulation of cholesterol homeostasis, was stable during the whole adipogenic process (Figure 2D).
Next, protein expression of Pparγ and Gapdh was also deter-mined in lysates from undifferentiated (days −4 and 0) and dif-ferentiated (days 4 and 12) adipocytes. Results showed that Pparγ tended to increase up to day 4 and then diminished (Figure 3A), while Gapdh increased steadily during adipogenesis (Figure 3B).
lipid accumulation during adipogenesis
of Bone-Derived cells
Bone-derived MSCs of gilthead sea bream can become adipo-cyte-like cells using the same DM than in preadipocytes (31). Phenotypic changes from the cells with a fibroblast-like appear-ance to more rounded and lipid-filled cells with the morphologi-cal semblance of adipocytes were observed during adipogenesis (Figure 4A). Differentiation into adipocyte-like cells was tracked by Oil red O staining, which monitors lipid accumulation. Lipid content in the cells was gradually increasing during the process of adipocyte maturation, showing day 15 cells significant differences when compared to day 5 cells (Figure 4B).
gene expression Profile during
adipogenesis of Bone-Derived cells
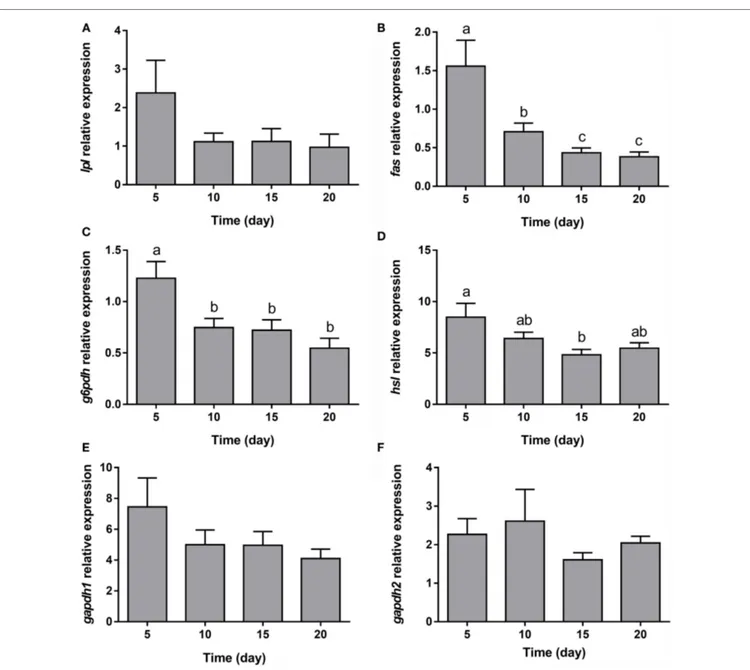
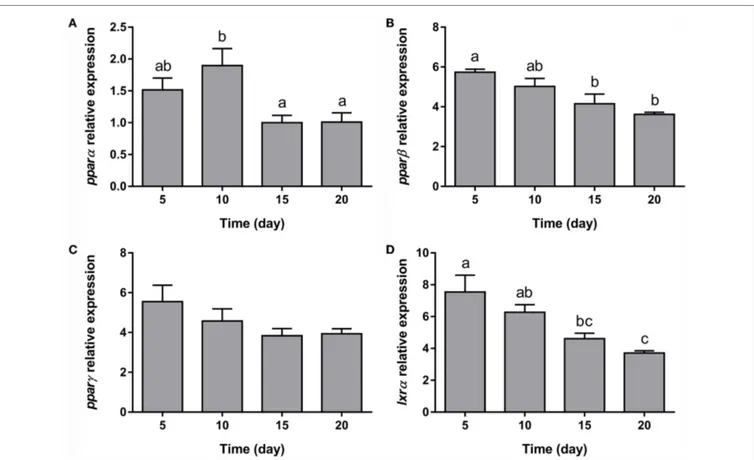
The expression of all the genes implicated in lipid metabolism analyzed, such as fas, g6pdh, and hsl (Figures 5B–D), was signifi-cantly downregulated during adipogenesis of bone-derived cells. On the other hand, the expression of lpl, gapdh1, and gapdh2 was unaffected (Figures 5A,E,F). Moreover, the gene expression of most of the transcription factors determined in the present study (pparα, pparβ, and lxrα) was progressively downregulated (Figures 6A,B,D), with the exception of pparγ that continued stable (Figure 6C).
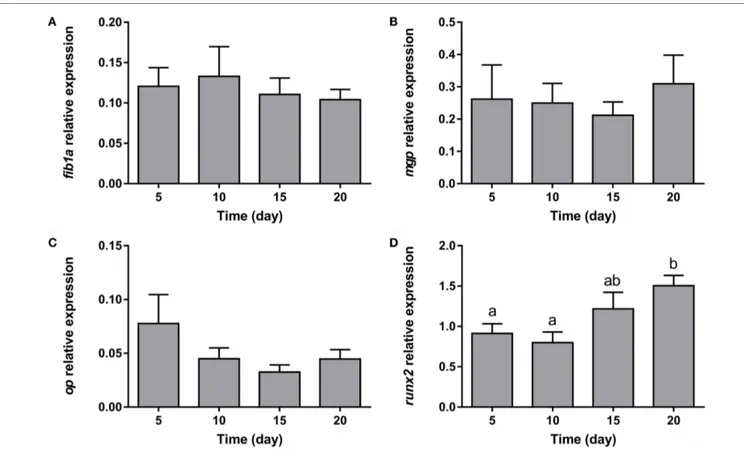
With regards to the representative osteogenic genes analyzed, the expression of the three components of the extracellular matrix (fib1a, mgp, and op) remained unaltered during the whole process of adipocyte differentiation (Figures 7A–C). On the other hand, the key transcription factor controlling osteogenesis, runx2, showed increasing levels during differentiation (Figure 7D).
DiscUssiOn
Mesenchymal stem cells are multipotent cells that through a two-step process, lineage commitment of specific progenitors and maturation, can be induced to differentiate into cells of several tissue types, such as osteoblasts or adipocytes (20). Local, hormonal, and mechanical factors in MSCs, as well as interme-diate precursors and differentiated cells, result in the activation
FigUre 1 | gene expression profile of lipid metabolism-related genes in gilthead sea bream preadipocytes during adipogenesis. The mRNA levels of
lpl (a), fas (B), g6pdh (c), hsl (D), gapdh1 (e), and gapdh2 (F) were measured by quantitative real-time PCR and normalized to ef1α and rps18. Samples were taken from preadipocytes (days −4 and 0 of culture) and differentiated adipocytes (days 4, 8, and 12 of culture). Values are means ± SEM, n = 4–5. Bars with different letters are significantly different (P < 0.05). lpl, lipoprotein lipase; fas, fatty acid synthase; g6pdh, glucose-6-phosphate dehydrogenase; hsl, hormone-sensitive lipase; gapdh1 and 2, glyceraldehyde 3-phosphate dehydrogenase 1 and 2, respectively; ef1α, elongation factor 1 alpha; rps18, ribosomal protein S18.
of a series of transcription factors and epigenetic mechanisms, which jointly control the balance of adipogenesis and osteoblas-togenesis, including their transdifferentiation (40). Gilthead sea bream MSCs isolated from adipose tissue or vertebra bone can be differentiated into mature adipocytes using a medium supplemented with insulin, IBMX, dexamethasone, and lipid mixture (i.e., DM) (26, 31). Insulin, the most potent of these inducers in mammals, activates pparγ expression (41, 42). IBMX and dexamethasone activate CCAAT enhancer-binding proteins
c/ebpβ and c/ebpδ expression, respectively (20), which in turn
induce the expression of c/ebpα and pparγ, the master regulators of adipogenesis. In preadipocyte primary cultures of some fish species, the addition of lipids in the differentiation cocktail is required to induce full maturation of adipocytes, most probably since polyunsaturated fatty acids, such as docosahexaenoic and eicosapentaenoic acids, are natural activators of Pparγ (43). A lipid mixture containing cholesterol and cod liver oil fatty acids (methyl esters), polyoxyethylenesorbitan monooleate, and d-α-tocopherol acetate has been used in Atlantic salmon (8), rainbow trout (23), large yellow croaker (24), and gilthead sea bream (26).
FigUre 2 | gene expression profile of transcription factors in gilthead sea bream preadipocytes during adipogenesis. The mRNA levels of pparα (a),
pparβ (B), pparγ (c), and lxrα (D) were measured by quantitative real-time PCR and normalized to ef1α and rps18. Samples were taken from preadipocytes (days −4 and 0 of culture) and differentiated adipocytes (days 4, 8, and 12 of culture). Values are means ± SEM, n = 4–5. Bars with different letters are significantly different (P < 0.05). pparα, β, and γ, peroxisome proliferator-activated receptor alpha, beta, and gamma, respectively; lxrα, liver X receptor alpha; ef1α, elongation factor 1 alpha; rps18, ribosomal protein S18.
In common carp, linoleic and oleic acids have been employed in combination with T3 and troglitazone (27), whereas in red sea bream (22, 44) and grass carp (25), the use of a DME/F12 medium containing only linoleic acid was enough to induce adipocyte differentiation.
In the present study, the addition of the DM to the preadi-pocytes downregulated the expression of the early marker lpl, as it occurs during the early stages of differentiation in Atlantic salmon preadipocytes (7). However, lpl gene expression remained stable during the adipocyte differentiation of bone-derived cells; and in other fish species, such as large yellow croaker (24), rain-bow trout (45), and red sea bream (22, 44), its expression was increased after induction of adipocyte differentiation. Thus, the regulation of lpl expression could be species-specific, or posttran-scriptional mechanisms such as modulation at the activity level cannot be discarded. Fas is an enzyme that regulates the de novo biosynthesis of long-chain fatty acids catalyzing the formation of palmitate (46). In this study, fas mRNA expression decreased gradually during adipogenesis of both MSC types, contrary to that observed in Atlantic salmon (7) and red sea bream (44)
preadipocytes, where its expression was higher and increased during adipocyte differentiation. In a recent study about de novo lipogenesis in Atlantic salmon preadipocytes, Bou and coworkers (47) showed that the use of palmitate decreases the expression of acetyl-CoA carboxylase (acc), the enzyme that catalyzes the formation of malonyl-CoA necessary for the fatty acid synthesis by Fas. Such data suggested that the synthesis of palmitate medi-ated by Fas may be blocking its own, and acc gene expression, through a negative feedback mechanism, similarly as reported in primary fetal rat calvarial cultured cells where palmitate reduced the expression of fas and pparγ (48).
G6pdh, an enzyme of the pentose phosphate pathway that produces the NADPH necessary for the biosynthesis of fatty acids and cholesterol, was upregulated after the induction of differentiation in preadipocytes as it occurs in Atlantic salmon (7), although its expression decreased during adipogenesis of bone-derived cells. In 3T3-L1 cells, Parks and collaborators dem-onstrated that g6pdh overexpression upregulates most adipocyte marker genes (such as fas and pparγ) and elevates the levels of cellular free fatty acids and triglycerides. Consistently, g6pdh
FigUre 4 | gilthead sea bream bone-derived cells during adipogenesis. (a) Representative phase-contrast images of cells stained with Oil red O at days 0, 5, and 15 of culture. Magnification 20× and enlarged views. (B) Quantification of Oil red O staining at days 5 and 15 of culture. Values are mean ± SEM of five independent experiments with wells run in duplicate and presented as fold change relative to day 5 of culture (**P < 0.01).
FigUre 3 | Protein expression of Pparγ and gapdh in gilthead sea bream preadipocytes during adipogenesis. Representative Western blot, corresponding Ponceau, and quantification of Pparγ (a) and Gapdh (B) protein levels in preadipocytes (days −4 and 0 of culture) and differentiated adipocytes (days 4 and 12 of culture). Values are means ± SEM, n = 2. Pparγ, peroxisome proliferator-activated receptor gamma; Gapdh, glyceraldehyde 3-phosphate dehydrogenase.
FigUre 5 | gene expression profile of lipid metabolism-related genes in gilthead sea bream bone-derived cells during adipogenesis. The mRNA levels of lpl (a), fas (B), g6pdh (c), hsl (D), gapdh1 (e), and gapdh2 (F) were measured by quantitative real-time PCR and normalized to ef1α and rps18. Samples were taken from adipocyte-like cells at days 5, 10, 15, and 20 of culture. Values are means ± SEM, n = 5–6. Bars with different letters are significantly different (P < 0.05).
lpl, lipoprotein lipase; fas, fatty acid synthase; g6pdh, glucose-6-phosphate dehydrogenase; hsl, hormone-sensitive lipase; gapdh1 and 2, glyceraldehyde
3-phosphate dehydrogenase 1 and 2, respectively; ef1α, elongation factor 1 alpha; rps18, ribosomal protein S18.
knockdown via small interfering RNA attenuated adipocyte dif-ferentiation reducing lipid droplet accumulation, indicating that proper expression of g6pdh is required for adipogenesis as well as lipogenesis (49). Therefore, the different mRNA expression of
g6pdh, observed during adipocyte differentiation between the
two tissues, suggests that G6pdh may be playing different roles during adipogenesis (i.e., fatty acid synthesis and/or oxidation protection), and thus it can be used as a feature to identify adi-pocytes derived from each tissue type. Moreover, the lipolytic marker hsl decreased transiently its gene expression with dif-ferentiation to then increase again, in preadipocytes and to a
lesser extent in bone-derived MSCs as well, in agreement with a previous study in human preadipocytes where hsl mRNA levels rose during adipocyte differentiation (50). This result suggests that the increase of lipid storage in the cells during adipogenesis may also promote lipolysis through Hsl in order to control its own intracellular levels of lipids. Furthermore, Gapdh produces the triglyceride glycerol required for the triglyceride synthesis being considered a late adipogenic marker. The gene expression of both isoforms of gapdh decreased along with adipocyte differ-entiation in preadipocytes but was unchanged in bone-derived MSCs, in contrast to that occurred at a protein level, where Gapdh
FigUre 6 | gene expression profile of transcription factors in gilthead sea bream bone-derived cells during adipogenesis. The mRNA levels of pparα (a), pparβ (B), pparγ (c), and lxrα (D) were measured by quantitative real-time PCR and normalized to ef1α and rps18. Samples were taken from adipocyte-like cells at days 5, 10, 15, and 20 of culture. Values are means ± SEM, n = 5–6. Bars with different letters are significantly different (P < 0.05). pparα, β, and γ, peroxisome proliferator-activated receptor alpha, beta, and gamma, respectively; lxrα, liver X receptor alpha; ef1α, elongation factor 1 alpha; rps18, ribosomal protein S18.
appeared to increase from preadipocytes to differentiated adipo-cytes. In grass carp (25), Atlantic salmon (8), and rainbow trout (23), Gapdh gene expression was not determined, but its activity was also increased with adipocyte differentiation suggesting that perhaps some kind of posttranscriptional, translational, and/or protein regulation processes may be occurring (51).
Regarding the analyses of transcription factors, the expres-sion of all ppars decreased early (pparα), steadily (pparγ), or late (pparβ) during preadipocyte differentiation and were similarly downregulated during the differentiation of bone-derived cells with the exception of pparγ that remained stable. In previous works with Atlantic salmon, the gene expression of pparα and the short form of pparγ increased during differentiation, while
pparγ long was induced during the early phase and decreased at later stages of differentiation (52). Other studies in Atlantic salmon showed that the gene expression of pparα and pparβ were unchanged during adipogenesis (53), whereas pparγ was upregulated already in subconfluent cells (7), as observed in our study. In red sea bream, pparα mRNA expression increased up to 7 days after induction and then decreased, while pparβ and
pparγ remained unaffected (44). In grass carp (25) and in large yellow croaker (24), pparγ transcriptional expression increased gradually during cell differentiation. Here, the presence of the
Pparγ protein increased from preadipocytes to early differenti-ated adipocytes, contrary to that occurred at a transcriptional level, suggesting that control at a posttranscriptional level exists. However, the present data about Pparγ protein expression during differentiation are in agreement with a previous study in rainbow trout preadipocytes where the protein level of Pparγ was higher in mature cells than in proliferating cells, suggesting that Pparγ par-ticipates as a transcription factor mostly during the early stages of the adipogenic process (23). Finally, gradual downregulation of
lxrα mRNA levels was detected during adipocyte differentiation of bone-derived cells, while those were stable in differentiating preadipocytes in disagreement with other studies in 3T3-L1 cells (54) and rainbow trout preadipocytes (55), where its expression increased during differentiation. Lxr induction in the late wave of adipogenesis and its activation inhibits adipocyte conversion, increases glucose uptake, glycogen synthesis, cholesterol synthe-sis, and fatty acids efflux (56). To sum up, lxrα and g6pdh during maturation of cells from both tissue types showed a similar pattern of gene expression, suggesting that Lxrα can be involved in the expression of g6pdh, regulating the pentose phosphate pathway in gilthead sea bream.
The process of osteogenesis can be divided in three stages, com-mitment, extracellular matrix production, and mineralization.
Fib1a, Op, and Mgp are components of the extracellular matrix. Fib1a is related to the initial state of osteoblast differentiation (57), and in previous studies with gilthead sea bream bone-derived cells, its gene expression increased at day 5 after addi-tion of an osteogenic medium and decreased slowly during differentiation (58). On the other hand, Op and Mgp are key molecules during the phase of calcification of the extracellular matrix (59, 60), and in the gilthead sea bream osteoblast culture, its gene expression increased steadily when mineralization of the tissue started (58). These findings contrast with the results obtained here in the presence of an adipogenic media, where the expression of these osteogenic genes remained low and without variations, indicating a change in the transcriptomic profile of these cells when turning into adipocyte-like cells. Moreover, Runx2 and Osterix are considered key transcription factors required for osteogenic differentiation of MSCs (20). Runx2 promotes cell differentiation into immature osteoblasts inhibit-ing their commitment to the adipocyte lineage, while Osterix is required for the maturation phase (20). Nevertheless, during the in vitro osteogenic development of gilthead sea bream, bone MSCs’ differences in runx2 expression were not observed (58). Rat adipose-derived stem cells infected with a recombinant adenovirus carrying the runx2 gene, decreased the gene expres-sion of lpl and pparγ and reduced lipid droplet formation (61).
In precursor cells isolated from visceral fat of Atlantic salmon differentiating into adipocytes or osteoblasts, Ytteborg and col-laborators found that pparγ mRNA was absent in cultures given osteogenic medium, and runx2 when adipogenic medium was added, suggesting that a similar corepressing mechanism also exists in fish (33). Nevertheless, in our study, the gene expression of runx2 during adipogenesis was high and increased toward the end, explaining perhaps why the lpl and pparγ mRNA levels in bone-derived cells were not modified.
In summary, in the present study, we used primary cultures of MSCs derived from adipose tissue or vertebra bone of gilthead sea bream to investigate the expression profile of lipid metabolism-related genes and transcription factors during adipogenesis. Gilthead sea bream preadipocytes and bone-derived cells were able to differentiate into adipocyte-like cells after addition of a DM. However, the revealed gene expression profile during the process of adipogenesis contradicts some previous findings using similar experimental models in another vertebrate species. The differences between the present and other studies can be related to some kind of species or tissue-specific regulation, differences in the composition of the DM used to induce adipogenesis, or due to the existence of posttranscriptional, translational, and/or protein regulation processes. Future experiments will explore if this cell lineage determination provokes the complete activation
FigUre 7 | gene expression profile of osteogenic markers in gilthead sea bream bone-derived cells during adipogenesis. The mRNA levels of fib1a (a),
mgp (B), op (c), and runx2 (D) were measured by quantitative real-time PCR and normalized to ef1α and rps18. Samples were taken from adipocyte-like cells at days 5, 10, 15, and 20 of culture. Values are means ± SEM, n = 5–6. Bars with different letters are significantly different (P < 0.05). fib1a, fibronectin 1a; mgp, matrix Gla protein; op, osteopontin; runx2, runt-related transcription factor 2; ef1α, elongation factor 1 alpha; rps18, ribosomal protein S18.
reFerences
1. Zhang Y, Proenca R, Maffei M, Barone M, Leopold L, Friedman JM. Positional cloning of the mouse obese gene and its human homologue. Nature (1994) 372:425–32. doi:10.1038/372425a0
2. Kling P, Rønnestad I, Stefansson SO, Murashita K, Kurokawa T, Björnsson BT. A homologous salmonid leptin radioimmunoassay indicates elevated plasma leptin levels during fasting of rainbow trout. Gen Comp Endocrinol (2009) 162:307–12. doi:10.1016/j.ygcen.2009.04.003
3. Lago F, Dieguez C, Gómez-Reino J, Gualillo O. Adipokines as emerging mediators of immune response and inflammation. Nat Clin Pract Rheumatol (2007) 3:716–24. doi:10.1038/ncprheum0674
4. Saera-Vila A, Calduch-Giner JA, Navarro I, Pérez-Sánchez J. Tumour necrosis factor (TNF) alpha as a regulator of fat tissue mass in the Mediterranean gilthead sea bream (Sparus aurata L.). Comp Biochem Physiol B Biochem Mol
Biol (2007) 146:338–45. doi:10.1016/j.cbpb.2006.11.003
5. Salmerón C, Johansson M, Asaad M, Angotzi AR, Rønnestad I, Stefansson SO, et al. Roles of leptin and ghrelin in adipogenesis and lipid metabolism of rainbow trout adipocytes in vitro. Comp Biochem Physiol A Mol Integr Physiol (2015) 188:40–8. doi:10.1016/j.cbpa.2015.06.017
6. Sánchez-Gurmaches J, Cruz-Garcia L, Gutiérrez J, Navarro I. Adiponectin effects and gene expression in rainbow trout: an in vivo and in vitro approach.
J Exp Biol (2012) 215:1373–83. doi:10.1242/jeb.061697
7. Todorcević M, Skugor S, Krasnov A, Ruyter B. Gene expression profiles in Atlantic salmon adipose-derived stromo-vascular fraction during differ-entiation into adipocytes. BMC Genomics (2010) 11:39. doi:10.1186/1471- 2164-11-39
8. Vegusdal A, Sundvold H, Gjøen T, Ruyter B. An in vitro method for studying the proliferation and differentiation of Atlantic salmon preadipocytes. Lipids (2003) 38:289–96. doi:10.1007/s11745-003-1063-3
9. Saltiel AR. You are what you secrete. Nat Med (2001) 7:887–8. doi:10.1038/90911 10. Tocher DR. Metabolism and functions of lipids and fatty acids in teleost fish.
Rev Fish Sci (2003) 11:107–84. doi:10.1080/713610925
11. Hausman DB, DiGirolamo M, Bartness TJ, Hausman GJ, Martin RJ. The biology of white adipocyte proliferation. Obes Rev (2001) 2:239–54. doi:10.1046/j.1467-789X.2001.00042.x
12. Rosen ED, Spiegelman BM. What we talk about when we talk about fat. Cell (2014) 156:20–44. doi:10.1016/j.cell.2013.12.012
13. Weil C, Lefèvre F, Bugeon J. Characteristics and metabolism of different adipose tissues in fish. Rev Fish Biol Fish (2012) 23:157–73. doi:10.1007/ s11160-012-9288-0
14. Bourin P, Bunnell BA, Casteilla L, Dominici M, Katz AJ, March KL, et al. Stromal cells from the adipose tissue-derived stromal vascular fraction and culture expanded adipose tissue-derived stromal/stem cells: a joint statement of the International Federation for Adipose Therapeutics and Science (IFATS) and the International Society for Cellular Therapy (ISCT). Cytotherapy (2013) 15:641–8. doi:10.1016/j.jcyt.2013.02.006
15. Schäffler A, Büchler C. Concise review: adipose tissue-derived stromal cells – basic and clinical implications for novel cell-based therapies. Stem Cells (2007) 25:818–27. doi:10.1634/stemcells.2006-0589
16. Boone C, Mourot J, Grégoire F, Remacle C. The adipose conversion process: regulation by extracellular and intracellular factors. Reprod Nutr Dev (2000) 40:325–58. doi:10.1051/rnd:2000103
17. Gregoire FM, Smas CM, Sul HS. Understanding adipocyte differentiation.
Physiol Rev (1998) 78:783–809.
18. Medina-Gómez G. Mitochondria and endocrine function of adipose tissue.
Best Pract Res Clin Endocrinol Metab (2012) 26:791–804. doi:10.1016/j.
beem.2012.06.002
19. Savopoulos C, Dokos C, Kaiafa G, Hatzitolios A. Adipogenesis and osteo-blastogenesis: trans-differentiation in the pathophysiology of bone disorders.
Hippokratia (2011) 15:18–21.
20. Chen Q, Shou P, Zheng C, Jiang M, Cao G, Yang Q, et al. Fate decision of mesenchymal stem cells: adipocytes or osteoblasts? Cell Death Differ (2016) 23(7):1128–39. doi:10.1038/cdd.2015.168
21. Reusch JE, Colton LA, Klemm DJ. CREB activation induces adipo-genesis in 3T3-L1 cells. Mol Cell Biol (2000) 20:1008–20. doi:10.1128/ MCB.20.3.1008-1020.2000
22. Oku H, Tokuda M, Okumura T, Umino T. Effects of insulin, triiodothyronine and fat soluble vitamins on adipocyte differentiation and LPL gene expression in the stromal-vascular cells of red sea bream, Pagrus major. Comp Biochem
Physiol B Biochem Mol Biol (2006) 144:326–33. doi:10.1016/j.cbpb.2006.
03.008
23. Bouraoui L, Gutiérrez J, Navarro I. Regulation of proliferation and differen-tiation of adipocyte precursor cells in rainbow trout (Oncorhynchus mykiss).
J Endocrinol (2008) 198:459–69. doi:10.1677/JOE-08-0264
24. Wang X, Huang M, Wang Y. The effect of insulin, TNFα and DHA on the proliferation, differentiation and lipolysis of preadipocytes isolated from large yellow croaker (Pseudosciaena Crocea R.). PLoS One (2012) 7:e48069. doi:10.1371/journal.pone.0048069
25. Li Y. Establishment and evaluation of a new model for studying lipogenesis in grass carp (Ctenopharyngodon idella) preadipocytes. In Vitro Cell Dev Biol
Anim (2012) 48:37–42. doi:10.1007/s11626-011-9474-8
26. Salmerón C, Acerete L, Gutiérrez J, Navarro I, Capilla E. Characterization and endocrine regulation of proliferation and differentiation of primary cul-tured preadipocytes from gilthead sea bream (Sparus aurata). Domest Anim
Endocrinol (2013) 45:1–10. doi:10.1016/j.domaniend.2013.02.002
27. Ljubojevic D, Pelic M, Novakov N, Lazic S, Lupulovic D, Cirkovic M, et al. The establishment of the cell culture of preadipocytes of common carp (Cyprinus
carpio L.). Food Feed Res (2014) 41:103–8. doi:10.5937/FFR1402103L
28. Bou M, Montfort J, Le Cam A, Ralliere C, Gabillard JC, Weil C, et al. Gene expression profile during proliferation and differentiation in rainbow trout adipocyte precursor cells. Paper Presented at AQUA 2012: Global Aquaculture
Securing Our Future, Prague, Czech Republic (2012).
29. Pombinho AR, Laizé V, Molha DM, Marques SMP, Cancela ML. Development of two bone-derived cell lines from the marine teleost Sparus aurata; evidence for extracellular matrix mineralization and cell-type-specific expression of matrix Gla protein and osteocalcin. Cell Tissue Res (2004) 315:393–406. doi:10.1007/s00441-003-0830-1
30. Vijayakumar P, Laizé V, Cardeira J, Trindade M, Cancela ML. Development of an in vitro cell system from zebrafish suitable to study bone cell differen-tiation and extracellular matrix mineralization. Zebrafish (2013) 10:500–9. doi:10.1089/zeb.2012.0833
31. Capilla E, Teles-García A, Acerete L, Navarro I, Gutiérrez J. Insulin and IGF-I effects on the proliferation of an osteoblast primary culture from sea bream (Sparus aurata). Gen Comp Endocrinol (2011) 172:107–14. doi:10.1016/j. ygcen.2011.03.020
of adipocyte functions, and that the cells are not only able to accumulate lipids but also have other key characteristics, such as adipokines production or sensitivity to lipolytic or lipogenic stimuli, as it occurs in mature adipocytes.
aUThOr cOnTriBUTiOns
EC and IN conceived the idea and designed the experiments. CS and NR-H performed the cell cultures and analytical procedures and drafted the manuscript. All authors interpreted the data, revised the manuscript, and approved the final version.
acKnOWleDgMenTs
The authors would like to thank Carlos Mazorra from Tinamenor SL (Pesués, Cantabria, Spain) for the gilthead sea bream used in this study and the personnel from the animal facility of the Faculty of Biology for their maintenance. This study was supported by the projects from the “Ministerio de Ciencia e Innovación” (MICINN) AGL2010-17324 to EC and AGL2011-24961 to IN, the “Xarxa de Referència d’R + D + I en Aqüicultura de la Generalitat de Catalunya,” and by the project from the European Union LIFECYCLE (EU-FP7 222719).
32. Ytteborg E, Vegusdal A, Witten PE, Berge GM, Takle H, Østbye T-K, et al. Atlantic salmon (Salmo salar) muscle precursor cells differentiate into osteo-blasts in vitro: polyunsaturated fatty acids and hyperthermia influence gene expression and differentiation. Biochim Biophys Acta (2010) 1801:127–37. doi:10.1016/j.bbalip.2009.10.001
33. Ytteborg E, Todorcevic M, Krasnov A, Takle H, Kristiansen IØ, Ruyter B. Precursor cells from Atlantic salmon (Salmo salar) visceral fat holds the plas-ticity to differentiate into the osteogenic lineage. Biol Open (2015) 4:783–91. doi:10.1242/bio.201411338
34. Gao B, Huang Q, Lin YS, Wei BY, Guo YS, Sun Z, et al. Dose-dependent effect of estrogen suppresses the adipogenic transdifferentiation of osteo-blasts via canonical Wnt signaling pathway. PLoS One (2014) 9(6):e99137. doi:10.1371/journal.pone.0099137
35. Boglione C, Gavaia P, Koumoundouros G, Gisbert E, Moren M, Fontagné S, et al. Skeletal anomalies in reared European fish larvae and juveniles. Part 1: normal and anomalous skeletogenic processes. Rev Aquac (2013) 5:S99–120. doi:10.1111/raq.12015
36. He F. Bradford protein assay. Bio Protoc (2011) 101:e45.
37. Salmerón C, Navarro I, Johnston IA, Gutiérrez J, Capilla E. Characterisation and expression analysis of cathepsins and ubiquitin-proteasome genes in gilthead sea bream (Sparus aurata) skeletal muscle. BMC Res Notes (2015) 8:149. doi:10.1186/s13104-015-1121-0
38. Pfaffl MW. A new mathematical model for relative quantification in real-time RT-PCR. Nucleic Acids Res (2001) 29(9):e45. doi:10.1093/nar/29.9.e45 39. Romero-Calvo I, Ocón B, Martínez-Moya P, Suárez MD, Zarzuelo A,
Martínez-Augustin O, et al. Reversible Ponceau staining as a loading control alternative to actin in Western blots. Anal Biochem (2010) 401:318–20. doi:10.1016/j.ab.2010.02.036
40. Berendsen AD, Olsen BR. Osteoblast-adipocyte lineage plasticity in tissue development, maintenance and pathology. Cell Mol Life Sci (2014) 71:493–7. doi:10.1007/s00018-013-1440-z
41. Klemm DJ, Leitner JW, Watson P, Nesterova A, Reusch JE, Goalstone ML, et al. Insulin-induced adipocyte differentiation. Activation of CREB rescues adipogenesis from the arrest caused by inhibition of prenylation. J Biol Chem (2001) 276:28430–5. doi:10.1074/jbc.M103382200
42. Nadeau KJ, Leitner JW, Gurerich I, Draznin B. Insulin regulation of sterol regulatory element-binding protein-1 expression in L-6 muscle cells and 3T3 L1 adipocytes. J Biol Chem (2004) 279:34380–7. doi:10.1074/jbc.M403596200 43. Grygiel-Górniak B. Peroxisome proliferator-activated receptors and their
ligands: nutritional and clinical implications – a review. Nutr J (2014) 13:17. doi:10.1186/1475-2891-13-17
44. Oku H, Umino T. Molecular characterization of peroxisome proliferator-ac-tivated receptors (PPARs) and their gene expression in the differentiating adipocytes of red sea bream Pagrus major. Comp Biochem Physiol B Biochem
Mol Biol (2008) 151:268–77. doi:10.1016/j.cbpb.2008.07.007
45. Bouraoui L, Cruz-Garcia L, Gutiérrez J, Capilla E, Navarro I. Regulation of lipoprotein lipase gene expression by insulin and troglitazone in rainbow trout (Oncorhynchus mykiss) adipocyte cells in culture. Comp Biochem Physiol
A Mol Integr Physiol (2012) 161:83–8. doi:10.1016/j.cbpa.2011.09.008
46. Chakravarty B, Gu Z, Chirala SS, Wakil SJ, Quiocho FA. Human fatty acid synthase: structure and substrate selectivity of the thioesterase domain. Proc
Natl Acad Sci U S A (2004) 101:15567–72. doi:10.1073/pnas.0406901101
47. Bou M, Todorčević M, Torgersen J, Škugor S, Navarro I, Ruyter B. De novo lipogenesis in Atlantic salmon adipocytes. Biochim Biophys Acta (2016) 1860:86–96. doi:10.1016/j.bbagen.2015.10.022
48. Yeh L-CC, Ford JJ, Lee JC, Adamo ML. Palmitate attenuates osteoblast dif-ferentiation of fetal rat calvarial cells. Biochem Biophys Res Commun (2014) 450:777–81. doi:10.1016/j.bbrc.2014.06.063
49. Park J, Rho HK, Kim KH, Choe SS, Lee YS, Kim JB. Overexpression of glu-cose-6-phosphate dehydrogenase is associated with lipid dysregulation and
insulin resistance in obesity. Mol Cell Biol (2005) 25:5146–57. doi:10.1128/ MCB.25.12.5146-5157.2005
50. Langin D, Dicker A, Tavernier G, Hoffstedt J, Mairal A, Rydén M, et al. Adipocyte lipases and defect of lipolysis in human obesity. Diabetes (2005) 54:3190–7. doi:10.2337/diabetes.54.11.3190
51. Vogel C, Marcotte EM. Insights into the regulation of protein abundance from proteomic and transcriptomic analyses. Nat Rev Genet (2012) 13:227–32. doi:10.1038/nrg3185
52. Todorcević M, Vegusdal A, Gjøen T, Sundvold H, Torstensen BE, Kjaer MA, et al. Changes in fatty acids metabolism during differentiation of Atlantic salmon preadipocytes; effects of n-3 and n-9 fatty acids. Biochim Biophys Acta (2008) 1781:326–35. doi:10.1016/j.bbalip.2008.04.014
53. Huang T-S, Todorcevic M, Ruyter B, Torstensen BE. Altered expression of CCAAT/enhancer binding protein and FABP11 genes during adipogenesis in vitro in Atlantic salmon (Salmo salar). Aquac Nutr (2010) 16:72–80. doi:10.1111/j.1365-2095.2008.00642.x
54. Hummasti S, Laffitte BA, Watson MA, Galardi C, Chao LC, Ramamurthy L, et al. Liver X receptors are regulators of adipocyte gene expression but not differentiation: identification of apoD as a direct target. J Lipid Res (2004) 45:616–25. doi:10.1194/jlr.M300312-JLR200
55. Cruz-Garcia L, Sánchez-Gurmaches J, Gutiérrez J, Navarro I. Role of LXR in trout adipocytes: target genes, hormonal regulation, adipocyte differentiation and relation to lipolysis. Comp Biochem Physiol A Mol Integr Physiol (2012) 163(1):120–6. doi:10.1016/j.cbpa.2012.05.193
56. Ross SE, Erickson RL, Gerin I, DeRose PM, Bajnok L, Longo KA, et al. Microarray analyses during adipogenesis: understanding the effects of Wnt signaling on adipogenesis and the roles of liver X receptor alpha in adipocyte metabolism. Mol Cell Biol (2002) 22:5989–99. doi:10.1128/ MCB.22.16.5989-5999.2002
57. Ribeiro N, Sousa SR, Monteiro FJ. Influence of crystallite size of nano-phased hydroxyapatite on fibronectin and osteonectin adsorption and on MC3T3-E1 osteoblast adhesion and morphology. J Colloid Interface Sci (2010) 351(2):398–406. doi:10.1016/j.jcis.2010.08.013
58. Riera N, Andres M, Salmerón C, Velez EJ, Takahashi LS, Gutierrez J, et al. Osteoblastogenesis in gilthead sea bream: transcriptional characterization and temperature effects. Paper Presented at: The 11th International Congress on the
Biology of Fish, Edinburgh, UK (2014).
59. Chatakun P, Núñez-Toldrà R, Díaz-López EJ, Gil-Recio C, Martínez-Sarrà E, Hernández-Alfaro F, et al. The effect of five proteins on stem cells used for osteoblast differentiation and proliferation: a current review of the literature.
Cell Mol Life Sci (2014) 71(1):113–42. doi:10.1007/s00018-013-1326-0
60. Lu X, Gao B, Yasui T, Li Y, Liu T, Mao X, et al. Matrix Gla protein is involved in crystal formation in kidney of hyperoxaluric rats. Kidney Blood Press Res (2013) 37(1):15–23. doi:10.1159/000343396
61. Zhang X, Yang M, Lin L, Chen P, Ma KT, Zhou CY, et al. Runx2 overexpression enhances osteoblastic differentiation and mineralization in adipose-derived stem cells in vitro and in vivo. Calcif Tissue Int (2006) 79:169–78. doi:10.1007/ s00223-006-0083-6
Conflict of Interest Statement: The authors declare that the research was
con-ducted in the absence of any commercial or financial relationships that could be construed as a potential conflict of interest.
Copyright © 2016 Salmerón, Riera-Heredia, Gutiérrez, Navarro and Capilla. This is an open-access article distributed under the terms of the Creative Commons Attribution License (CC BY). The use, distribution or reproduction in other forums is permitted, provided the original author(s) or licensor are credited and that the original publication in this journal is cited, in accordance with accepted academic practice. No use, distribution or reproduction is permitted which does not comply with these terms.