UNIVERSITÀ DEGLI STUDI DI SALERNO DIPARTIMENTO DI SCIENZE FARMACEUTICHE
E BIOMEDICHE
Dottorato di Ricerca in Scienze Farmaceutiche X-CICLO NUOVA SERIE
2008-2011
BIOPHYSICAL INVESTIGATION OF BIOMOLECULES IN BIO-MEMBRANE MODELS
Tutor Dottoranda
Ch.ma Prof. Anna Maria D’Ursi Dott.ssa Sara Di Marino
Coordinatore
Contents Abstract I Part 1 Chapter 1 1 Introduction 1 Chapter 2 5 Experimental Section 5 2.1 Peptide synthesis 5
2.1.1 Solid-phase peptide synthesis and purification 5 2.1.2 General procedure for cyclization 6
2.1.3 Side-chain deprotection 7
2.2 Peptide chaaracterization 7
2.2.1 Peptide purification 7
2.2.2. Mass spectral analysis 8
2.3 Antifungal test 8
2.3.1 Yeast isolated 8
2.3.2 Susceptibility testing assays 9 2.3.3 Invitro test (fluorescence microscopi) 9
2.4 Spectroscopic analysis 10
2.4.1 Circular Dichoism 10
2.4.2 Fluorescence titration measurements 10 2.4.3 Isothermal Titration Calorimetry 11
2.4.5 NMR structure calculation 13 Chapter 3 14 Results 14 3.1 Antifungal activity 14 3.2 Fluorescence microscopy 16 3.3 Membrane-peptide interaction 17
3.3.1 Fluorescence titration measurements 17 3.3.2 Isothermal Titration Calorimetry 23
3.3 Conformational analysis 35 3.3.1 CD spectroscopy 35 3.3.2 NMR Spectroscopy 37 3.4 Discussion 43 References 47 Part 2 Chapter 1 54 Introduction 54 Chapter 2 59 Experimental section 59 2.1 Peptide synthesis 59 2.2 Sample preparation 60 2.3 ESR spectroscopy 62
2.5 Fluorescence Titration Measurements 64 2.6 Molecular Dynamics 65 2.7 NMR analysis: C8 titration 66 2.7.1 NMR structure calculation 67 Chapter 3 69 Results 69 3.1 Peptide-membrane interaction 69 3.1.1 Choise of solvent 69 3.1.2 EPS spectroscopy 69 3.1.3 Fluorescence spectroscopy 72 3.2 conformational analysis 74 3.2.1 Circular Dichroism 74 3.2.2 NMR analisi 77 3.2.3MD simulations 87 3.2.4 Discussion 96 Chapter 4 100 Conclusions 100 References 101
I Abstract
Many drugs are available for the treatment of systemic or superficial mycoses, but only a limited number of them are effective antifungal drugs, devoid of toxic and undesirable side effects. Therefore there remains an urgent need for a new generation of antifungal agents.
The present work concerns the synthesis, the antifungal activity and the biophysical characterization of a set of linear and cyclic peptides (AMT1, cyclo-AMT1, AMT2, cyclo-AMT2, AMT3, cyclo-AMT3) including aminoacids characteristic of membrane-active antimicrobial peptides (AMP). The peptides were tested against different yeast species, and displayed general antifungal activity, with a therapeutically promising antifungal specificity against Cryptococcus neoformans.
To shed light on the role played by the membrane cell in the antifungal activity an extensive biophysical study was carried out using different spectroscopic techniques. Our structural investigation provides data to exclude the ability of the peptides to penetrate the membrane of the fungal cell, highlighting their attitude to interact with the external surface of the bilayer. Taken together our data support the hypothesis that the membrane cell of the fungi may be an important platform for specific interactions of the synthesized peptides with more specific targets involved in the cell wall synthesis.
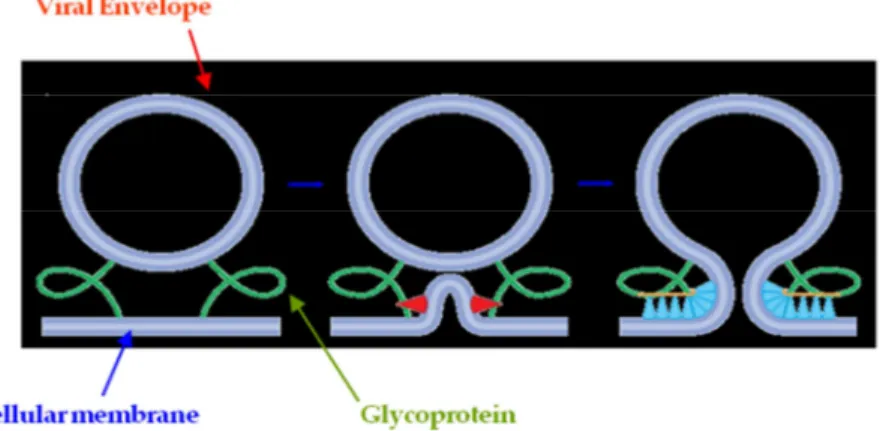
Viral fusion glycoproteins present a membrane-proximal external region (MPER) which is usually rich in aromatic residues and presents a marked tendency to stably reside at the membrane interfaces, leading, through unknown mechanisms, to a destabilization of the bilayer structure. This step
II
has been proposed to be fundamental for the fusion process between target membrane and viral envelope. In present work, we investigate the interaction between an octapeptide (C8) deriving from the MPER domain of gp36 of Feline Immunodeficiency Virus and different membrane models by combining experimental results obtained by Nuclear Magnetic Resonance, Electron Spin Resonance, Circular Dichroism and Fluorescence Spectroscopy with Molecular Dynamics simulations. Our data indicate that C8 binds to the lipid bilayer adsorbing onto the membrane surface without deep penetration. As a consequence of this interaction, the bilayer thickness decreases. The association of the peptide with the lipid membrane is driven by hydrogen bonds as well as hydrophobic interactions that the Trp side chains form with the lipid headgroups. Notably these interactions may be the key to interpret at molecular level the function played by Trp residues in all the fragments of viral envelope involved in fusion mechanism with target membrane.
1
Chapter 1
Introduction
Fungal infections are a persistent major health problem, especially for immunocompromised patients. Invasive fungal infections can be life-threatening for neonates, cancer patients receiving chemotherapy, organ transplant recipients and patients with acquired immunodeficiency syndrome (AIDS). Many fungal infections are caused by opportunistic pathogens that may be endogenous or acquired from the environment, including Candida,
Cryptococcus, and Aspergillus. Cryptococcosis, which is caused by the
encapsulated fungus Cryptococcus neoformans, has been lethal for HIV-infected patients. Cryptococcus infects pulmonary organs and can disseminate widely, most commonly to the brain and skin.(1-3)
Although it appears that many drugs are available for the treatment of systemic or superficial mycoses, there are only a limited number of effective antifungal drugs, many of them toxic and having undesirable side effects. Furthermore, resistance development and fungistatic rather than fungicidal activities represent limitations of current antifungal therapy.(4-6) Therefore there is an urgent need for a new generation of antifungal agents.(7)
Cationic antimicrobial peptides (CAPs) have been found in almost all species of eukaryotic organisms and are recognized as the evolutionarily conserved components of their innate immune system that defend the host against microbes through membrane or metabolic disruption.(8) A distinguishable advantage of CAPs over conventional antibiotics is that they do not provoke immune responses.(9) Regardless of their origin and biological efficacy, CAPs share common features. They are short peptides (usually between 3-50 amino
2
acid residues), which include a large content of basic amino acids and a global distribution of hydrophobic and hydrophilic residues. Due to the high frequency of amino acid residues, such as R and K in their sequences, they carry an overall positive charge in the physiological pH range, which is of great importance for their interactions with the negative charges of bacterial cell membranes.(8) CAPs adopt an amphipathic conformation at polar-nonpolar interfaces with a hydrophobic domain consisting of polar-nonpolar amino acid residues on one side and polar or charged residues on the opposite. Because of these physicochemical characteristics, CAPs have a tendency to accumulate on the negatively charged microbial surfaces and membranes. Electrostatic interactions cause the accumulation of the cationic peptides at the negatively charged bacterial membrane, and hydrophobic interactions drive their insertion into the lipid bilayer.(10)
Each CAP has a unique pattern of activity against a variety of Gram-positive and Gram-negative bacteria, yeasts, fungi and viruses.(11) While the antimicrobial peptide cecropin A is only active against Gram-positive bacteria, (12) MG 2 and dermaseptin show activity against both types of bacteria as well as fungi,(13),(14) and the membrane-lytic peptide MEL attacks both prokaryotic and mammalian cells.(15)
Small CAPs rich in particular amino acid residues, such as R, W, and P have gained high interest as lead compounds(16-20). They are usually found as small antimicrobial motifs of much larger natural compounds.(21) The mechanisms of interaction of small and conformationally constrained peptides with cellular membranes, as well as the key factors that provide bacterial specificity for these peptides, are much less well understood.(22) The mechanisms of action for antimicrobial peptides are not completely understood, but in most cases their biological effects are believed to involve
3
membrane disruption of the target cells.(21, 23-30) The proposed mechanism requires positively charged aminoacids to associate with negatively charged microbial membranes, causing the peptides to adopt a globally amphiphilic helical conformation at the membrane–water interface. The ensuing membrane disruption can lead directly to cell lysis and death,(31, 32) or membrane permeabilization may allow peptide molecole to reach intracellular targets.(33,
34) AMPs have gained attention as potential antifungal agents because their
activity is not associated with resistance phenomena. Development of resistance by sensitive microbial strains against these AMPs is less probable, because AMPs exert their action by forming multimeric pores in the cell membranes, leading to cell lysis,(35) or interaction with the RNA or DNA after penetration into the cell.(36)Thus, among others, small RW-rich peptides with improved toxicity against bacteria are interesting candidates to study the structural motifs and forces responsible for selectivity and may pave the way to develop new therapeutics with potent activity against multi-resistant bacteria.
Linear and cyclic RRWWRF, dubbed AMT1 and cyclo-AMT1, respectively (Figure 1), were recently indentified from a synthetic combinatorial library as new antimicrobial peptides,(37-39) exerting their action by inducing curvature strain, permeation or disintegration of the target membrane.(18, 37) Starting from AMT1 and cyclo-AMT1 sequence, we synthesised AMT2, cyclo-AMT2, AMT3 and cyclo- AMT3 (Figure 1) including one and two more His residues than the AMT1 analogues, respectively. The imidazole ring characteristic of His side chains was designed in the attempt to confer to AMT2, cyclo-AMT2, AMT3 and cyclo-AMT3 antifungal activity analogous to the imidazole ring of the azole antifungal compounds. The azole antifungal agents, containing either two or three nitrogens in the azole ring, are currently the most widely used and
4
studied class of antifungal agents; they prevent synthesis of ergosterol, a major component of fungal plasma membranes, by inhibiting the cytochrome P450-dependent enzyme 14a-sterol demethylase.(40-44)
Figure 1 Chemical structures of AMT peptides.
The aim of this work is to verify the antifungal activity of linear and cyclic peptides synthesized and to investigate the role of peptide-membrane interactions in antimicrobial activity.
The antifungal activity was evalueted by in vitro test.
Then, the ability of our peptides to interact with the surface of the fungal cell was monitored by fluorescence microscopy, using specifically labelled AMT peptide.
To investigate the role of peptide-membrane interactions in the biological activity, biophysical investigation was carried out based on multiple analytical techniques including fluorescence spectroscopy, isothermal titration calorimetry, circular dichroism (CD), and nuclear magnetic resonance (NMR).
5
Chapter 2
Experimental section
2.1 Peptide synthesis
2.1.1 Solid-phase peptide synthesis and purification
Peptides of Figure 1 were synthesized with a manual batch synthesizer (Agitatore orbitale Mod. KS 130 basic IKA, STEROGLASS, Perugia Italy) using a Teflon reactor (10mL), applying the Fmoc/tBu solid phase peptide synthesis (SPPS) procedure, together with the following side chain protecting groups: Arg, Pbf; His, Trt; Trp, Boc. (Chan, W.; White, P. Fmoc Solid Phase Peptide Synthesis; Oxford University Press:Oxford, 2000.)
AMT1, AMT2 and AMT3 were synthesized with a Wang resin (0.6–1.0 mmol/g, 0.2 g) that was swelled with N,N-dimethylformamide (DMF) (1 mL/100 mg of resin) for 3 h before use. The Wang resin (0.6–1.0 mmol/g, 0.2 g) was treated with N-Fmoc amino acid derivatives (fourfold excess), which were sequentially coupled to the growing peptide chain using O-benzotriazole-N,N,N0 ,N0-tetramethyl-uronium-hexafluoro-phosphate (HBTU) (fourfold excess) in DMF and N,N-diisopropylethylamine (DIPEA) (eightfold excess). The coupling reaction time was 2 h. After deprotection of the last N-Fmoc group, the peptide resin was washed with methanol and dried in vacuo to yield the protected peptide-bound Wang resin. The deprotected peptide was cleaved from the resin by treatment with trifluoroacetic acid (TFA)/H2O/phenol/ethanedithiol/thioanisole (reagent K) (82.5:5:5:2.5:5 v/v) at a ratio of 10 mL to 0.5 g of resin at room temperature for 3 h. After filtration of the exhausted resin, the solvent was concentrated in vacuo, and the
6
residue was triturated with ether. Cyclo-AMT2, AMT1 and cyclo-AMT3 were synthesized using a 2-chlorotrityl chloride resin. The first N-Fmoc amino acid (0.6–1.2 equiv relative to the resin for 2-chlorotrityl resin) and DIPEA (4 equiv relative to amino acid) were dissolved in dry dichloromethane (DCM) (approx. 10 mL per gram of resin) containing, if necessary, a small amount of dry DMF (enough to facilitate dissolution of the acid). This was added to the resin and stirred for 30–120 min. After stirring, the resin was washed with 3X DCM/MeOH/DIPEA (17:2:1), 3 X DCM, 2X DMF and 2 X DCM. Other N-Fmoc amino acids (fourfold excess) were sequentially coupled to the growing peptide chain according to the Fmoc/tBu solid phase peptide synthesis (SPPS) procedure. The final cleavage with AcOH/MeOH/DCM (1:1:8) resulted in protected peptides.
For fluorescence microscopy study we synthesized cyclo–AMT2 and cyclo– AMT3 including Dap (l-diamino propionic acid) aminoacid in substitution of
Trp. cyclo–AMT2 and cyclo–AMT3 with Dap aminoacid were synthesized
according to the solid phase synthesis methods using Fmoc-Dap(NBD)-OH This was obtained by alkylating the free amino group of Nα-Fmoc, l-diamino propionic acid (Fmoc-Dap-OH) with NBD chloride. (45)
2.1.2 General procedure for cyclization
A solution of the linear protected peptide (0.03 mmol) in dry DMF (6.5 mL) was added at room temperature to a reaction flask containing a solution of N-hydroxybenzotriazole (HOBt) (3 equiv, 12 mg, 0.09 mmol), HBTU (3 equiv, 34 mg, 0.09 mmol) and DIPEA (5 equiv, 0.26 mL, 1.5 mmol) in dry DMF (1 mL) using a syringe pump. The solution was added at rate of about 0.01 mL/min. Once the addition was complete, the mixture was stirred for 24 h at room temperature. The reaction mixture was concentrated under reduced
7
pressure, and the residue was dissolved in ethyl acetate (AcOEt). The organic phase was washed twice with 5% aqueous sodium bicarbonate (NaHCO3), dried over sodium sulfate (Na2SO4), and filtered. The solvent was removed by reduced pressure, and the crude residue was purified by flash chromatography on silica gel (CHCl3/MeOH from 99:1 to 90:10) to yield the protected cyclic peptide as a glassy white solid.
2.1.3 Side-chain deprotection
The protected cyclopeptide (0.02 mmol) was treated with 10 mL of a solution of TFA/triisopropylsilane (TIS)/H2O 95:2.5:2.5 at room temperature. After 24 h, the reaction mixture was evaporated in vacuo, and the residue was dissolved in 5 mL of 3 N aqueous hydrogen chloride (HCl). The aqueous phase was washed twice with diethyl ether (Et2O) and concentrated in vacuo, yielding the side chain-deprotected cyclopeptide as a hydrochloride salt (quant.).
2.2 Peptide characterization 2.2.1 Peptide purification
All peptides were purified by preparative reversed phase high performance liquid chromatography (HPLC) using a Jupiter [Phenomenex, Anzola Emeilia (BO), Italy] C18 column (25 _ 4.6 cm, 5 l, 300 Å pore size). The column was perfused at a flow rate of 3 mL/min with a mobile phase containing solvent A (0.1% TFA in water). A linear gradient from 50% to 90% of solvent B (0.1% TFA in acetonitrile) for 40 min was adopted for peptide elution. The pure fraction was collected to yield a white powder after lyophilisation. After purification cyclo-AMT1, cyclo-AMT2 and cyclo-AMT3 were obtained in 35%, 45% and 68% overall yield, respectively. The molecular weight of the compound was determined by mass spectral analysis.
8 2.2.2 Mass spectral analysis
Peptide fragments were characterised using a Finnigan LCQDeca ion trap instrument equipped with an electrospray source (LCQ Deca Finnigan, San Jose, CA, USA). The samples were directly infused into the ESI source using a syringe pump set at a flow rate of 5 lL/min. The data were analysed with Xcalibur software.
2.3 Antifungal tests
2.3.1 Yeast isolates
To verify the existence of antifungal activity the antifungal assays were performed using different yeast species.
One-hundred and thirty-five yeast clinical isolates belonging to five Candida species (20 Candida albicans, 20 Candida glabrata, 20 Candida parapsilosis, 20 Candida tropicalis and 20 Candida krusei) and 35 isolates of C.
neoformans were tested. The Candida isolates were obtained from clinical
specimens of blood, urine, vaginal fluid and sputum, whereas the C.
neoformans isolates were all recovered from blood and cerebrospinal fluid
specimens. We also included two reference C. neoformans strains, H99 and the acapsular ATCC 52817. Isolates were identified to the species level by standard methods and stored as glycerol stocks at -80 °C. Prior to testing, isolates were grown on Sabouraud dextrose agar (Kima, Padua, Italy) for 48 h at 30 °C. C. parapsilosis ATCC 22019 andC. krusei ATCC 6258 were used as quality control strain.( Clinical and Laboratory Standards Institute (CLSI), Reference Method for Broth Dilution Antifungal Susceptibility Testing of Yeasts; Approved Standard, 3rd ed.; CLSI document M27–A3. (ISBN 1-56238-666-2) Clinical and Laboratory Standards Institute, 940 West Valley
9
Road, Suite 1400, Wayne, Pennsylvania 19087-1898 USA, 2008).
2.3.2 Susceptibility testing assays
Susceptibility testing of the yeast isolates to the antifungals amphotericin B and fluconazole and to the six investigated peptides was performed by the broth microdilution method, as descrive in the Clinical and Laboratory Standards Institute (CLSI) M27-A3 document48 with a final inoculum concentration of 1.5 (±1.0) ×103 cells/mL in RPMI 1640 medium buffered to pH 7.0 with morpholinepropanesulphonic acid. Standard powders of amphotericin B and fluconazole were obtained from their respective manufacturers. For each drug, trays containing 0.1 mL of the serially diluted drug solution (2× final concentration) in each well were inoculated with 0.1 mL of each diluted yeast inoculum suspension and then incubated for 48 h (Candida species isolates) or for 72 h (C. neoformans isolates) at 35 °C. The final concentrations of the standard antifungal drugs ranged from 0.03 to 16 lg/mL for amphotericin B and from 0.125 to 64 lg/mL for fluconazole, while those of the peptides ranged from 1 to 512 lg/mL. The minimum inhibitory concentration (MIC) endpoint was defined as the lowest concentration of drug that produced a prominent decrease in turbidity (∼50% reduction in growth) compared with that of the drug-free growth control.
2.3.3 In vitro test (fluorescence microscopy)
Candida albicans strains ATCC 90028 and MYA-2876 were grown for 17 h
in 10 ml YPD-broth at 28 °C to obtain mid-logarithmic phase organisms and washed three times, then diluted in 10 mM Tris, pH 7.4 to a concentration of 1×10⁷ cfu/ml. 100 µl samples of the C. albicans suspensions were incubated for 5 min on ice together with 1 µl of cyclo-AMT1 or cyclo-AMT3 (2 mg/ml).
10
The pellets were washed three times in 10 mM Tris, pH 7.4. Cell FIX (Becton Dickinson Catalogue No. 340181) was added (to a final concentration of 4% formaldehyde) and the yeast cell pellets were incubated 15 min on ice and then 45 min in room temperature. Ethanol washed glass cover slips were coated with 0.25 ml of poly-lysine (0.2 mg/ml dissolved in water), dried and then washed with distilled water. The samples were adhered to the poly-lysine glasses for 30 min and mounted on microscope slides for visual inspection. A Nikon Eclipse TE300 inverted fluorescence microscope was used.
2.4 Spectroscopic analysis
2.4.1 Circular dichroism (CD)
The samples for CD experiments in micelles of SDS were prepared by dissolving an appropriate amount of peptide (0,15 mM) in a SDS micelle solution (=0.08 mol kg-1). All CD spectra were recorded using a JASCO J810 spectropolarimeter at room temperature and with a cell path length of 1 mm. CD spectra were acquired at 25 °C using a measurement range from 190 to 260 nm, 1-nm band width, four accumulations, and 10-nm/min scanning speed. Spectra were corrected for solvent contribution. For an estimation of secondary structure content, CD spectra were analysed using the SELCONN algorithm from the DICHROWEB website.(46)
2.4.2 Fluorescence titration measurements
Fluorescence measurements were performed at 300 K using a LS 55 Luminescence Spectrofluorimeter (Perkin Elmer). The excitation wavelength was 280 nm and emission spectra were recorded between 300 and 400 nm, at exitation slit width 5nm and emission slit width 2.5 nm, scan speed 50nm/min.
11
The titrations with SDS were performed by adding measured amounts of a phosphate buffer solution (pH 7;10 mM) containing the peptide (3×10⁻⁶ M) and the surfactant at a concentration well above the cmc to a weighed amount of a phosphate buffer solution of the peptide at the same concentration, initially put into the spectrofluorimetric cuvette. In this way, the surfactant concentration was progressively increased, while the peptide concentration remained constant during the whole titration. After each addition there was a 10-min wait to ensure equilibrium had been reached.
2.4.3 Isothermal Titration Calorimetry (ITC)
Small unilamellar vesicles (SUVs) of average size z = 30 nm, composed of POPC/POPG (3:1, mol/mol) and of POPC/POPG/POPE (2/1/1; mol/mol/mol) were prepared as follows. The desired amount of POPC in chloroform was dried under a stream of nitrogen and then overnight under high vacuum. POPG in chloroform was added and the lipid mixture was vortexed and thendried as described for POPC. The desired amount of buffer was added and the dispersion vortexed. The multilamellar vesicles were sonified for 25 min under a stream of nitrogen (Branson sonifier S-250A equipped with a disruption horn, 200 W) until an almost clear dispersion of unilamellar vesicles was obtained.
The diameter of the small unilamellar vesicles (SUVs) was measured by DLS (Nano Series NS, ZEN3600, Malvern Instruments Ltd, UK) and their average size was about 30 nm at all pH values.
For the ITC measurements the peptides were solubilized in buffer solution and the prepared samples were monitored on a Uvikon 860 (GOEBEL Instrumentelle Analytik, Germany) with the buffer spectrum as a reference. A 1 cm cuvette was used (Hellma, Jena, Germany). Peptide concentration was
12
determined from the absorption measured at 280 nm.
Isothermal titration calorimetry was performed with a VP ITC instrument (Microcal, Northampton, MA). The cell volume was Vcell = 0.203 ml. The peptide solution and lipid dispersion were degassed under vacuum and equilibrated at the experimental temperature for 10 min before filling the cells and syringe. The heats of reaction were corrected with the heat of dilution of POPC/POPG titrated into buffer.
Raw data were processed using the Origin software provided by Microcal.
2.4.4 Nuclear Magnetic Resonance (NMR)
NMR experiments were performed in sodium dodecyl sulphate (SDS) solution. The samples for NMR experiments in micelles of SDS were prepared by dissolving an appropriate amount of peptide (1.5 mM) in a SDSd25 micelle solution (=0.08 mol kg-1).
NMR spectra were collected using a Bruker DRX-600 spectrometer at 300 K. One-dimensional (1D) NMR spectra were recorded in the Fourier mode with quadrature detection. The water signal was suppressed by low-power selective irradiation in the homo-gated mode. DQF-COSY, TOCSY, and
NOESY(47-49) experiments were run in the phase-sensitive mode using quadrature
detection in ω1 via time-proportional phase increases of the initial pulse. Data block sizes were 2048 addresses in t2 and 512 equidistant t1 values. Prior to Fourier transformation, the time domain data matrices were multiplied by shifted sin2 functions in both dimensions. A mixing time of 70 ms was used for the TOCSY experiments. NOESY experiments were run with mixing times in the range of 100-300 ms. Qualitative and quantitative analyses of DQF-COSY, TOCSY, and NOESY spectra were achieved using SPARKY software.(50)
13 2.4.5 NMR structure calculations
Peak volumes were translated into upper distance bounds with the CALIBA routine from the CYANA software package.(51) The requisite pseudoatom corrections were applied for non-stereospecifically assigned protons at prochiral centers and for the methyl group. After discarding redundant and duplicated constraints, the final list of experimental constraints was used to generate an ensemble of 100 structures by the standard CYANA protocol of simulated annealing in torsion angle space implemented (using 6000 steps). No dihedral angle or hydrogen bond restraints were applied. The best 20 structures that had low target function values (0.83-1.19) and small residual violations (maximum violation = 0.38 Å) were refined by in vacuo minimization in the AMBER 1991 force field using the SANDER program of the AMBER 5.0 suite.(52, 53) To mimic the effect of solvent screening, all net charges were reduced to 20% of their real values. Moreover, a distance-dependent dielectric constant (ε = r) was used. The cut-off for non-bonded interactions was 12 Å. NMR-derived upper bounds were imposed as semi-parabolic penalty functions, with force constants of 16 Kcal/mol Å2. The function was shifted to be linear when the violation exceeded 0.5 Å. The best 10 structures after minimization had AMBER energies ranging from -441.4 to -391.1 Kcal/mol. Final structures were analyzed using the Insight 98.0 program (Molecular Simulations, San Diego, CA, USA).
14
Chapter 3
RESULTS 3.1 Antifungal activity
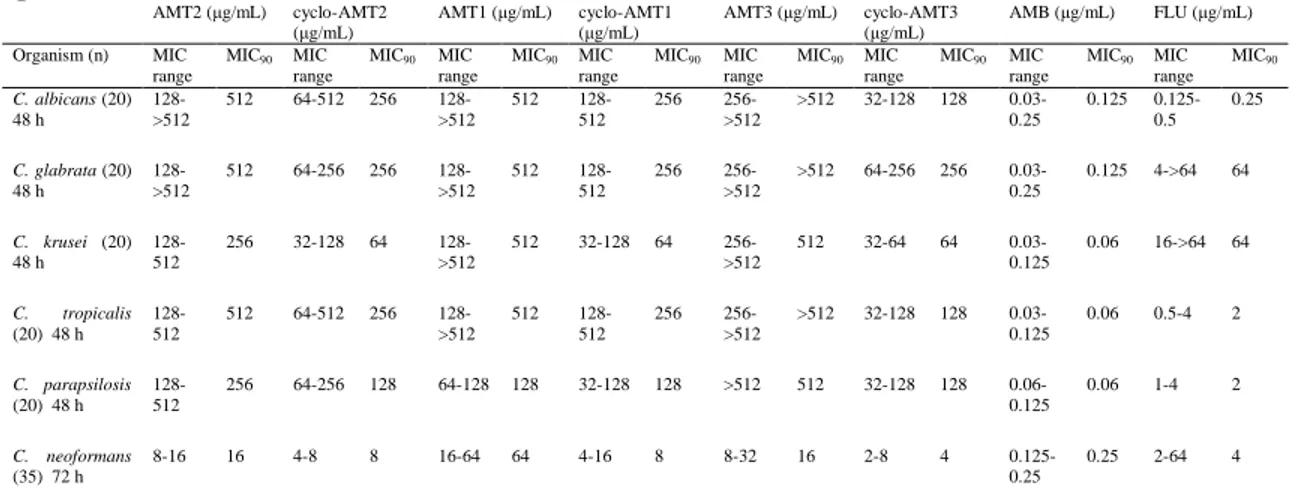
The Minimum Inhibitory Concentrations (MICs) of peptides AMT2, cyclo-AMT2, AMT1, cyclo-AMT1, AMT3 and cyclo-AMT3 were determined using a standardised microbroth dilution method for yeasts, as recommended by the Clinical and Laboratory Standards Institute48 (CLSI). The application of an endpoint less than the MIC90 was used according to CLSI recommendations because it proved to consistently represent the in vitro activity of the compounds and often provided a better correlation with other measurements of antifungal activity. AMT1, cyclo-AMT1, AMT2, cyclo-AMT2, AMT3 and cyclo-AMT3 were tested against C. albicans, C. glabrata, C. krusei, C.
tropicalis, C. parapsilosis and C. neoformans. The antifungal antibiotics
amphotericin B and fluconazole served as positive controls for the microbes and gave the expected minimal inhibitory concentrations (MICs). For the
Candida species isolates, MICs ranged from 64 to >512 lg/mL for the linear
compounds and from 32 to 512 lg/mL for the cyclic compounds. The MIC values shown in Table 1 indicate that all species are susceptible to the peptides tested; cyclic peptides have generally lower MIC values than their linear analogues. In particular the longest linear AMT3, having a MIC greater than 512, can be considered inactive against C. albicans, C. glabrata and C.
15
Table 1: In vitro susceptibilities of Candida species and Cryptococcus neoformans isolates to six
peptidesa. AMT2 (µg/mL) cyclo-AMT2 (µg/mL) AMT1 (µg/mL) cyclo-AMT1 (µg/mL) AMT3 (µg/mL) cyclo-AMT3 (µg/mL) AMB (µg/mL) FLU (µg/mL) Organism (n) MIC range MIC90 MIC range MIC90 MIC range MIC90 MIC range MIC90 MIC range MIC90 MIC range MIC90 MIC range MIC90 MIC range MIC90 C. albicans (20) 48 h 128->512 512 64-512 256 128->512 512 128-512 256 256->512 >512 32-128 128 0.03-0.25 0.125 0.125-0.5 0.25 C. glabrata (20) 48 h 128->512 512 64-256 256 128->512 512 128-512 256 256->512 >512 64-256 256 0.03-0.25 0.125 4->64 64 C. krusei (20) 48 h 128-512 256 32-128 64 128->512 512 32-128 64 256->512 512 32-64 64 0.03-0.125 0.06 16->64 64 C. tropicalis (20) 48 h 128-512 512 64-512 256 128->512 512 128-512 256 256->512 >512 32-128 128 0.03-0.125 0.06 0.5-4 2 C. parapsilosis (20) 48 h 128-512 256 64-256 128 64-128 128 32-128 128 >512 512 32-128 128 0.06-0.125 0.06 1-4 2 C. neoformans (35) 72 h 8-16 16 4-8 8 16-64 64 4-16 8 8-32 16 2-8 4 0.125-0.25 0.25 2-64 4
Abbreviations: AMB, amphotericin B; FLU, fluconazole; MIC, minimum inhibitory concentration; MIC90, MIC for 90% of the isolates. a As determined by the CLSI M27-A3 broth microdilution method
16
Interestingly, all compounds are significantly more active against C.
neoformans. Cryptococcus is a pathogenic fungus responsible for severe
opportunistic infections. The most prominent feature of this yeast is its elaborate polysaccharide capsule, a complex structure that is required for virulence. To investigate the origin of this specificity, we tested our compounds against the acapsular C. neoformans strain ATCC 52817. MIC values against ATCC 52817 are quite similar to those of C. neoformans H99 (16 lg/ mL for AMT2, 8 lg/mL for cyclo-AMT2, 16 lg/mL for AMT1, 8 lg/mL for cyclo-AMT1, 8 lg/mL for AMT3 and 4 lg/mL for cyclo- AMT3), indicating the absence of any specific interaction with the capsular structure.
3.2 Fluorescence microscopy
To investigate whether the peptides cyclo-AMT2 and cyclo-AMT3 bind to
Candida cell wall, the peptides were labelled with the fluorescent dye Dap
(l-diamino propionic acid) aminoacid and incubated with the fungal cells. As demonstrated by fluorescence microscopy the peptides bound to the surface of
Candida albicans cells (Figure 2).
Figure 2 Binding of cyclo-AMT2 and cyclo-AMT3 to C. albicans. ATCC 90028 (on the left) and C. albicans MYA-2876 (on the right). Panels show fluorescence of Candida cells stained with labelled with Dap conjugated cyclo-AMT3.
17 3.3 Membrane-peptide interaction
3.3.1 Fluorescence titration measurement.
Peptide-surfactant and peptide-liposome interactions were studied by monitoring the changes in the Trp fluorescence emission spectra with increasing surfactant concentrations.
The fluorescence intensities of some fine vibronic structures in the tryptophan fluorescence spectrum show strong environmental dependance.(54, 55) In particular, the emission maximum shifts from 354 to 329 nm when going from water to an apolar medium. The quantum yield could also undergo large changes, the direction and extent of which depend on the system under consideration.(56) To evaluate the interaction capability of the peptides with micelle aggregates, tryptophan fluorescence of AMT1, cyclo-AMT1, AMT2, cyclo-AMT2, AMT3, and cyclo-AMT3 in SDS micelle solutions was registered. SDS micelles were chosen as representatives of anionic micellar systems.
The spectra of all peptides in phosphate buffer and in a SDS micellar solution are shown in Figure 3.
18
Figure 3 Tryptophan emission spectra (range 300-400 nm) of AMT1, cyclo-AMT1, AMT2, cyclo-AMT2, AMT3 and cyclo-AMT3 in aqueous phosphate buffer (solid line) and SDS micelles (dashed line).
0 5 10 15 20 25 300 320 340 360 380 400 0 10 20 30 40 50 60 70 80 90 300 320 340 360 380 400 0 5 10 15 20 25 30 35 300 320 340 360 380 400 0 20 40 60 80 100 120 300 320 340 360 380 400 0 20 40 60 80 100 120 140 160 180 300 320 340 360 380 400 0 10 20 30 40 50 60 70 80 300 320 340 360 380 400 λ/nm λ/nm λ/nm λ/nm λ/nm λ/nm F / a rb it ra ry u n it F / a rb it ra ry u n it F / a rb it ra ry u n it F / a rb it ra ry u n it F / a rb it ra ry u n it F / a rb it ra ry u n it 0 5 10 15 20 25 300 320 340 360 380 400 0 10 20 30 40 50 60 70 80 90 300 320 340 360 380 400 0 5 10 15 20 25 30 35 300 320 340 360 380 400 0 20 40 60 80 100 120 300 320 340 360 380 400 0 20 40 60 80 100 120 140 160 180 300 320 340 360 380 400 0 10 20 30 40 50 60 70 80 300 320 340 360 380 400 λ/nm λ/nm λ/nm λ/nm λ/nm λ/nm F / a rb it ra ry u n it F / a rb it ra ry u n it F / a rb it ra ry u n it F / a rb it ra ry u n it F / a rb it ra ry u n it F / a rb it ra ry u n it
19
In phosphate buffer, all the spectra show a Trp emission spectrum typical of an aqueous environment (λmax ≈ 358 nm) indicating that the Trp side chains are exposed to the aqueous medium. For the linear peptides, the addition of SDS causes a reduction in Trp quantum yield which could be ascribed to peptide-micelle interaction,(57) and a weak shift of the emission maximum to shorter wavelength (λmax ≈ 350 nm). The limited extent of the shift indicates that the Trp residues remain greatly exposed to the solvent, suggesting a peptide positioning at the micelle surface rather than inside the inner hydrophobic core. For cyclo-AMT1 and cyclo-AMT2 in SDS micelles a different behaviour is observed, since the Trp quantum yield increases and the shift of the emission maximum is more evident (λmax ≈ 345 nm). Thus, our evidences indicate a different peptide-micelle interaction mode,(58, 59) where the Trp residues of cyclo-AMT1 and cyclo-AMT2 experiences a slightly more apolar environment than the linear analogues. Interestingly, the cyclo-AMT3 behavior is more similar to that of the linear AMT3 than to those of the other cyclic peptides.
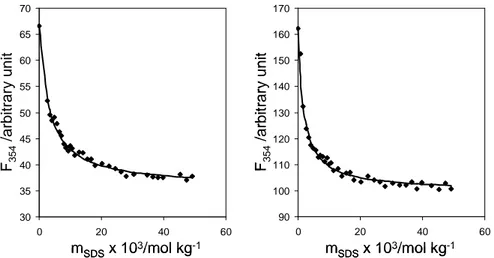
In order to obtain further information on peptide-surfactant interaction, Trps fluorescence of peptides was monitored at surfactant concentrations ranging from premicellar to concentrated micellar solutions. As an example, Figure 4 contains the variation of fluorescence for AMT3 and cyclo-AMT3 at λ= 354 nm, corresponding to the emission in a hydrophobic (water) environment, with SDS concentration.
20
Figure 4 Trps fluorescence variation of AMT3 and cyclo-AMT3 at λ = 354 nm, with increasing SDS concentrations.
For the six peptides, a very low amount of surfactant is sufficient to induce dramatic changes in the Trps fluorescence; moreover, no further change is observed at the point of SDS micellization (cmc =0.008 mol kg-1). This means that the considered peptides interact with surfactants monomers, inducing their aggregation.(60)
The data reporting the variation of fluorescence with SDS concentration offer the opportunity for a quantification of the peptide-surfactant interaction. Actually, the quantitative description of a peptide interaction with biomembranes and related mimetic systems (vesicles, micelles) has been the subject of recent scientific discussion.(61) Two different approaches have been proposed: a partition process and a binding mechanism. For these two approaches two different constants are calculated, Kp,x and Ka, respectively.(62, 63) The former, describes the mole-fraction partitioning of the peptide between the solution bulk and the microscopically dispersed hydrophobic phase, the second is an association constant between the peptide and the surfactant. It is not possible to choice a priori which model is the most
30 35 40 45 50 55 60 65 70 0 20 40 60 90 100 110 120 130 140 150 160 170 0 20 40 60 F3 5 4 /a rb it ra ry u n it F3 5 4 /a rb it ra ry u n it mSDSx 103/mol kg-1 m SDSx 103/mol kg-1 30 35 40 45 50 55 60 65 70 0 20 40 60 90 100 110 120 130 140 150 160 170 0 20 40 60 F3 5 4 /a rb it ra ry u n it F3 5 4 /a rb it ra ry u n it mSDSx 103/mol kg-1 m SDSx 103/mol kg-1
21
representative model for the system under scrutiny, but the choice depends on the trend evidenced by Trps fluorescence at λ = 354 nm in function of surfactant concentration.
In the case of our peptides, the variation of Trps fluorescence at λ = 354 nm in function of surfactant concentration shows a saturation trend. For this trend the binding approach is proved the most representative model; here, interpolation of the experimental Trp fluorescence data, F, by means of the proper equation allows the estimation Ka (association constant between the peptide and the
surfactant) and n (surfactant molecules) as described below.
The change in the peptide fluorescence has been described following the equations developed by Christiaens et al.(63) In particular, using the equation:
0 F 1 F ( [P ] [PL] ) ([P ] [PL]) + = + F F F (1)
where F is the fluorescence intensity at a given added lipid concentration. F0 and [PF] are the fluorescence intensity and concentration of the unbound peptide, respectively, while F1 and [PL] are the fluorescence intensity and concentration of the peptide-lipid complex. [PL] can be obtained via the definition of the dissociation (association) constant:
F F d a ([P ][L ] ) 1 [PL] = = K K (2)
with Kd dissociation constant, Ka association constant, and [LF] free lipid concentration.
The binding Eqn (2) can be rearranged to the following quadratic equation:
2 tot ' tot
tot d tot
[L ] [L ]
[PL] −[PL]([P ]+ +K )+ [P ]=0
22
The parameter n, representing the formal number of phospholipid molecules that are involved in a binding site for one peptide, is introduced in order to account for the formal stoichiometry of binding (Kd' = Kd/n). The solution of this quadratic equation is thus given by:
2 tot 1/ 2 tot [L ] ( 4( )[P ] [PL] = 2 ± − S S n (4) with ' tot tot d [L ] [P ] = + + S K n
Substitution of Eqn (4) into Eqn (1) yields an equation of F as a function of [Ptot] and [Ltot]. By plotting the measured fluorescence intensity as a function of [Ltot], Kd' and n can be determined through a non-linear best fitting
procedure. Kd is obtained by multiplying of Kd' by n.
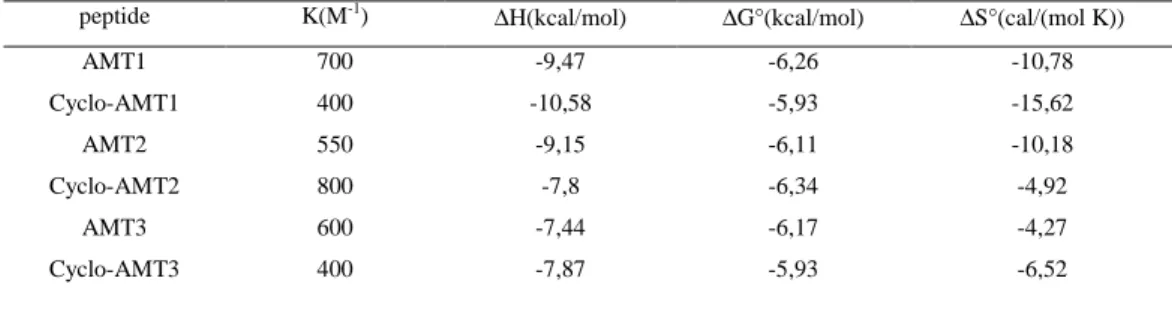
Table 2 summarizes the Ka and n values obtained for the systems under
consideration. The Ka values, although not very high, indicate a significant
propensity of AMT1, AMT2, AMT3, AMT1, AMT2 and cyclo-AMT3 to form complexes with SDS molecules. An average of 4-6 surfactants interact per peptide. Interestingly, cyclo-AMT1 and cyclo-AMT2 present a lower Ka than the linear analogues, confirming the peculiarity of interaction as
compared to the remaining peptides, while cyclo-AMT3 binding to SDS aggregates is much stronger than that of AMT3.
23
Table 2 Ka (association constant between the peptide and the surfactant/liposome),
and n (number of surfactant molecules/vesicles interacting with the peptide, calculated for AMT1, AMT2, AMT3, cyclo-AMT1, cyclo-AMT2 and cyclo-AMT3 in SDS micelle solutions. solvent medium Ka×10-2/M-1 n AMT1 SDS micelles 3.8±0.4 4±1 AMT2 SDS micelles 3.3±0.4 5±1 AMT3 SDS micelles 3.4±0.3 4±1 cyclo-AMT1 SDS micelles 2.2±0.2 6±2 cyclo-AMT2 SDS micelles 2.0±0.4 6±1 cyclo-AMT3 SDS micelles 5.5±0.4 6±1
3.3.2 Isothermal Titration Calorimetry ITC.
ITC is a thermodynamic technique that directly measures the heat released or absorbed during a biomolecular binding event. Measurement of this heat allows accurate determination of binding constants (K), reaction stoichiometry (n), enthalpy (∆H) and entropy (∆S), thereby providing a complete thermodynamic profile of the molecular interaction in a single experiment. Because ITC goes beyond binding affinities and can elucidate the mechanism of the molecular interaction, it has become the method of choice for characterizing biomolecular interactions.
24
To study lipid-peptide interaction by ITC there are two different type of titration.(64)
In the first titration mode the peptide solution is injected into the lipid dispersion contained in the calorimeter cell. In this titration the lipids vesicles are in excess compared to the peptide, so all peptide molecules injected bind the vesicle surface, provided the binding constant is sufficiently large. Each injection gives the same heat of reaction hi, and hi /δni provide the enthalpy of
binding,
∆
H0.In the second titration mode the peptide contained in the calorimeter cell is titrated with lipid vesicles injections. As this type of titration was previously preferred to study AMT1 and cyclo-AMT1 binding to POPC vesicles(65) we have adopted this titration mode and experimental conditions for our experiments.
Peptide-lipid interaction: electrostatic/hydrophobic factor
The first measurements investigated the AMT interaction to POPC/POPG (75/25, M/M) SUVs at pH 7.4 and 25°C. POPC/POPG 3:1 M/M is often used to mimic the electrostatic charge of cytoplasmic membrane of yeast as C.
Albicans.(66, 67)
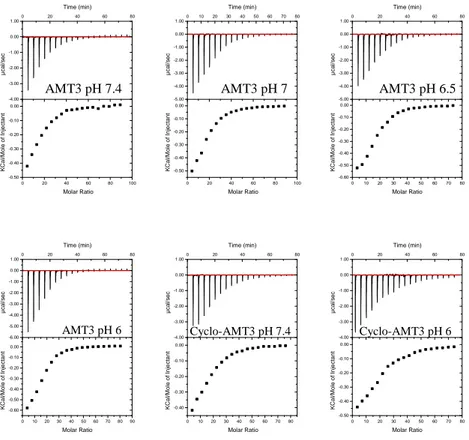
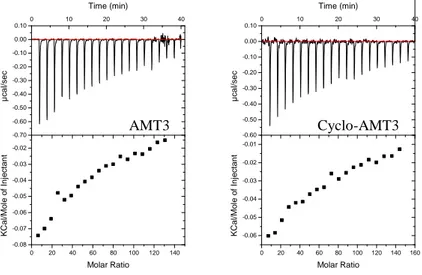
Figure 5 shows the calorimetric trace flow obtained titrating AMT peptides with the SUVs system described above and the integrated reaction heats plotted against the molar lipid-to-peptide ratio.
25
Figure 5 Titration of each peptide with POPC/POPG (75/25 M/M) SUVs at pH 7.4 and 25°C. UP: ITC trace (differential heating power vs. time). Down: the cumulative heat of reaction as a function of the lipid to-to-peptide molar ratio.
In each titration the binding of peptide to vesicles produce exothermic heat of reaction. The exothermic heat flow decreases with increasing number of injections because less and less peptide is available for binding. The residual heat is the heat of dilution of the lipid dispersion in the buffer.
The molar binding enthalpy ∆H0 of peptides to POPC/POPG SUVs can be
determined from the total heat released in the titration, ∑hi, and the molar amount of peptide in the sample cell, n0, according to
∆ = ∑ (1) 0 20 40 60 80 100 120 -0.50 -0.40 -0.30 -0.20 -0.10 0.00 -4.00 -3.00 -2.00 -1.00 0.00 1.00 0 20 40 60 80 Time (min) µ c a l/ s e c Molar Ratio K C a l/ M o le o f In je c ta n t 0 20 40 60 80 100 120 -0.50 -0.40 -0.30 -0.20 -0.10 0.00 -4.00 -3.00 -2.00 -1.00 0.00 1.00 0 20 40 60 80 Time (min) µ c a l/ s e c Molar Ratio K C a l/ M o le o f In je c ta n t 0 20 40 60 80 100 -0.50 -0.40 -0.30 -0.20 -0.10 0.00 -4.00 -3.00 -2.00 -1.00 0.00 1.00 0 20 40 60 80 Time (min) µ c a l/ s e c Molar Ratio K C a l/ M o le o f In je c ta n t 0 20 40 60 80 100 -0.50 -0.40 -0.30 -0.20 -0.10 0.00 -4.00 -3.00 -2.00 -1.00 0.00 1.00 0 20 40 60 80 Time (min) µ c a l/ s e c Molar Ratio K C a l/ M o le o f In je c ta n t 0 20 40 60 80 100 -0.40 -0.30 -0.20 -0.10 0.00 -4.00 -3.00 -2.00 -1.00 0.00 1.00 0 20 40 60 80 Time (min) µ c a l/ s e c Molar Ratio K C a l/ M o le o f In je c ta n t 0 10 20 30 40 50 60 70 80 -0.40 -0.30 -0.20 -0.10 0.00 -4.00 -3.00 -2.00 -1.00 0.00 1.00 0 20 40 60 80 Time (min) µ c a l/ s e c Molar Ratio K C a l/ M o le o f In je c ta n t AMT1 CYCLO-AMT1
CYCLO-AMT2 AMT3 CYCLO-AMT3
26
The enthalpy of the reaction is calculated according to Equation (1) assuming that the total amount of peptide in the calorimeter is bound. The calculated binding enthalpies ∆H0 are listed in Table 3.
High-sensitivity calorimetric experiments can allow the definition of a binding isotherm,(68) Xib = f(cf). It describes the extent of binding, Xib, as a function of
the concentration of free peptide, cf, at each injection of the titration. Xib is
defined as the ratio between the molar amount of bound peptide, nipep bound, and
the molar amount of injected lipid available for binding, niL, after i injections.
= ,
(2)
niL is given by the lipid concentration in the syringe, the volume of injection
and the number i of injections performed. nipep bound is determined from the
experimental heats of reaction hi as follows:
, =∆ !∑ " ## $ (3)
with cpep0 the total peptide concentration in the calorimeter cell and Vcell the
volume of the calorimeter cell. The molar amount of peptide bound to the lipid membrane (equation 3) combined with the principle of mass conservation allows the calculation of the free peptide concentration in solution. This provides the description of the binding isotherm without assuming a specific binding model.
The calculation of further thermodynamic parameters such as the binding constant or the free energy of the reaction requires the analysis of the binding isotherm. In the present context it is based on a surface partitioning model in which the peptide binding to the lipid membrane is dependent on the peptide affinity for the lipid and the concentration of peptide, cM, found immediately
27
= % &' (4)
with K0 the intrinsic binding constant. The surface partitioning model takes
into account the attraction of positively-charged peptides to the negatively-charged membrane surface. The peptide concentration at the membrane surface, cM, is therefore higher than the peptide concentration in the bulk, cf.
The Boltzmann law expresses the electrostatic equilibrium between these two concentrations:
&' = &( )*
+, - Ψ
./ 0 (5)
where zp is the peptide effective charge,
Ψ
is the membrane surface potential, F0 is the Faraday constant and RT is the thermal energy.Ψ
can be calculatedfrom the Gouy-Chapman theory. It leads to the peptide concentration at the membrane surface after each lipid injection and finally to the intrinsic binding constant K0, according to equation (4).
The free energy of binding
∆
G0 follows from:∆
G0 = -RTln(55.5 K0). Thefactor 55.5 is the molar concentration of water and corrects for the cratic contribution. The binding entropy can be derived from the second law of thermodynamics, ∆G0 = ∆H0-T∆S0.
28
Table 3 Thermodynamic parameters for the binding of linear and cyclic AMT to POPC/POPG (75/25 M/M) SUVs at pH 7.4 and 25°C.
POPC/POPG peptide K(M-1) ∆
H(kcal/mol) ∆G°(kcal/mol) ∆S°(cal/(mol K))
AMT1 700 -9,47 -6,26 -10,78 Cyclo-AMT1 400 -10,58 -5,93 -15,62 AMT2 550 -9,15 -6,11 -10,18 Cyclo-AMT2 800 -7,8 -6,34 -4,92 AMT3 600 -7,44 -6,17 -4,27 Cyclo-AMT3 400 -7,87 -5,93 -6,52
For all the peptides the intrinsic binding constants K are not high and vary between 400 and 800 M-1. The low value of binding constant suggests that the peptides do not penetrate the hydrophobic core of the vesicles but are adsorbed on their external surface. ∆H values are generally higher than ∆G values in absolute value; furthermore ∆S value are always negative. These data suggest that the insertion of the peptide into the lipid bilayer is driven by enthalpy and opposed by entropy.
To investigate the role of electrostatic/hydrophobic contribution to peptide-vesicles interaction, AMT3 and cyclo-AMT3 were titrated at different pH values with POPC/POPG and POPC SUVs.
The titration curves of AMT3 and cyclo-AMT3 with POPC/POPG SUVs show an exothermic profile (Figure 6). Thermodynamic parameters are summerized in Table 4.
29
Figure 6 Titration of AMT3 and cyclo-AMT3 with POPC/POPG (75/25 M/M) SUVs at 35°C and different pH value. UP: ITC trace (differential heating power vs. time). Down: the cumulative heat of reaction as a function of the lipid to-to-peptide molar ratio.
For AMT3 a gain in free energy and an increasing of binding constant show that the membrane binding is enforced by pH decrease. In contrast, cyclo-AMT3 show no variation of binding constant in dependence of pH, but just a slight gain in free energy (Table 4). For both peptides the binding to vesicles is enthalpy driven. 0 20 40 60 80 100 -0.50 -0.40 -0.30 -0.20 -0.10 0.00 -4.00 -3.00 -2.00 -1.00 0.00 1.00 0 20 40 60 80 Time (min) µ c a l/ s e c Molar Ratio K C a l/ M o le o f In je c ta n t 0 20 40 60 80 100 -0.50 -0.40 -0.30 -0.20 -0.10 0.00 -5.00 -4.00 -3.00 -2.00 -1.00 0.00 1.00 0 10 20 30 40 50 60 70 80 Time (min) µ c a l/ s e c Molar Ratio K C a l/ M o le o f In je c ta n t 0 10 20 30 40 50 60 70 80 -0.60 -0.50 -0.40 -0.30 -0.20 -0.10 0.00 -5.00 -4.00 -3.00 -2.00 -1.00 0.00 1.00 0 20 40 60 80 Time (min) µ c a l/ s e c Molar Ratio K C a l/ M o le o f In je c ta n t 0 10 20 30 40 50 60 70 80 90 -0.60 -0.50 -0.40 -0.30 -0.20 -0.10 0.00 -6.00 -5.00 -4.00 -3.00 -2.00 -1.00 0.00 1.00 0 20 40 60 80 Time (min) µ c a l/ s e c Molar Ratio K C a l/ M o le o f In je c ta n t 0 10 20 30 40 50 60 70 80 -0.40 -0.30 -0.20 -0.10 0.00 -4.00 -3.00 -2.00 -1.00 0.00 1.00 0 20 40 60 80 Time (min) µ c a l/ s e c Molar Ratio K C a l/ M o le o f In je c ta n t 0 10 20 30 40 50 60 70 80 -0.50 -0.40 -0.30 -0.20 -0.10 0.00 -4.00 -3.00 -2.00 -1.00 0.00 1.00 0 20 40 60 80 Time (min) µ c a l/ s e c Molar Ratio K C a l/ M o le o f In je c ta n t
AMT3 pH 7.4 AMT3 pH 7 AMT3 pH 6.5
30
Table 4 Thermodynamic parameters for the binding of AMT3 and cyclo-AMT3 to POPC/POPG (75/25 M/M) SUVs at 35°C and different pH value.
POPC/POPG peptide K(M-1) ∆
H(kcal/mol) ∆G°(kcal/mol) ∆S°(cal/(mol K)) pH T(°C) AMT3 800 -7,45 -6,55 -2,93 7.4 35 AMT3 900 -9,06 -6,62 -7,92 7.0 35 AMT3 1700 -9,21 -7,01 -7,14 6.5 35 AMT3 6000 -9,22 -7,78 -4,67 6.0 35 Cyclo-AMT3 400 -7,87 -5,93 -6,52 7.4 25 Cyclo-AMT3 400 -9,54 -6,12 -11,09 6.0 35
To study the hydrophobic contribution in peptide-vesicles interaction AMT3 and cyclo-AMT3 were titrated with neutral POPC SUVs (Figure 7). The results of peptide titrations with POPC SUVs is summerized in Table 5.
Figure 7 Titration of AMT3 and cyclo-AMT3 with POPC SUVs at 35°C and pH 6. UP: ITC trace (differential heating power vs. time). Down: the cumulative heat of reaction as a function of the lipid to-to-peptide molar ratio.
0 20 40 60 80 100 120 140 -0.08 -0.07 -0.06 -0.05 -0.04 -0.03 -0.02 -0.70 -0.60 -0.50 -0.40 -0.30 -0.20 -0.10 0.00 0.10 0 10 20 30 40 Time (min) µ c a l/ s e c Molar Ratio K C a l/ M o le o f In je c ta n t 0 20 40 60 80 100 120 140 160 -0.06 -0.05 -0.04 -0.03 -0.02 -0.01 -0.60 -0.50 -0.40 -0.30 -0.20 -0.10 0.00 0.10 0 10 20 30 40 Time (min) µ c a l/ s e c Molar Ratio K C a l/ M o le o f In je c ta n t AMT3 Cyclo-AMT3
31
Table 5 Thermodynamic parameters for the binding of AMT3 and cyclo-AMT3 to POPC SUVs at 35°C and pH 6.
POPC peptide K(M-1) ∆
H(kcal/mol) ∆G°(kcal/mol) ∆S°(cal/(mol K)) pH T(°C) AMT3 2500 -5,39 -7,25 6,03 6.0 35 Cyclo-AMT3 800 -5,25 -6,55 4,22 6.0 35
Hydrophobic constant of AMT3 decreases from 6000kcal/mol with POPC/POPG SUVs (Table 4) to 2500 kcal/mol with POPC SUVs (Table 5). Also the free energy (-7,25kcal/mol; Table 5) is slightly lower than with POPC/POPG SUVs (Table 4).
On the contrary, cyclo-AMT3 titrated with POPC SUVs shows a slight increase in binding constant and free energy in comparison to the values observed in the titration with POPC/POPG SUVs (Table 4).
For both peptides the interaction with POPC vesicles is entropy driven as shown by positive value of entropy (Table 5).
Taken all together the ITC data can be interpreted supposing that at lower pH the basic residue of peptides are protonated and thus attracted by the negative charge of POPC/POPG SUVs. This electrostatic effect is highly evident for AMT3-vesicles interaction as compared to cyclo-AMT3 vesicles interaction. The role of His in peptide-vesicles interaction
To clarify the effect of the presence of His residues in peptide-vesicles interaction, AMT2 was titrated with POPC/POPG SUVs at different pH values (Figure 8).
A slight gain in free energy and an increase in binding constant show that the membrane binding is facilitated by pH decrease (Table 6). The entropy value shows that moving from pH 7 to pH 6 the system become more disordered.
32
The results of Table 4 and Table 6 show that in the same conditions the binding of AMT3 to vesicles has a lower free energy, an higher binding constant and is more disordered than AMT2 binding. These data suggest that His residues are important for the interaction of the two peptides with the vesicle surface.
Figure 8 Titration of AMT2 with POPC/POPG (75/25 M/M) SUVs at 35°C and different pH value. UP: ITC trace (differential heating power vs. time). Down: the cumulative heat of reaction as a function of the lipid to-to-peptide molar ratio.
Table 6 Thermodynamic parameters for the binding of AMT2 to POPC/POPG (75/25 M/M) SUVs at 35°C and different pH value.
POPC/POPG peptide K(M-1) ∆
H(kcal/mol) ∆G°(kcal/mol) ∆S°(cal/(mol K)) pH T(°C) AMT2 350 -10,92 -6,04 -15,83 7.0 35 AMT2 450 -10,78 -6,20 -14,88 6.5 35 AMT2 1000 -8,82 -6,69 -6,93 6.0 35 0 20 40 60 80 -0.50 -0.40 -0.30 -0.20 -0.10 0.00 -4.00 -3.00 -2.00 -1.00 0.00 1.00 0 10 20 30 40 50 60 Time (min) µ c a l/ s e c Molar Ratio K C a l/ M o le o f In je c ta n t 0 20 40 60 80 100 120 -0.50 -0.40 -0.30 -0.20 -0.10 0.00 -4.00 -3.00 -2.00 -1.00 0.00 1.00 0 20 40 60 80 Time (min) µ c a l/ s e c Molar Ratio K C a l/ M o le o f In je c ta n t 0 20 40 60 80 -0.50 -0.40 -0.30 -0.20 -0.10 0.00 -4.00 -3.00 -2.00 -1.00 0.00 1.00 0 10 20 30 40 Time (min) µ c a l/ s e c Molar Ratio K C a l/ M o le o f In je c ta n t
33
The role of membrane fluidity in peptide-vesicles interaction
To understand the influence of membrane fluidity we repeated the titration of AMT3 and cyclo-AMT3 with POPC/POPG+cholesterol, and POPC/POPG/POPE+cholesterol SUVs that mimics the composition of the outer leaflet of yeast membrane (Figure 9).(66, 67)
Cholesterol is used as mimetic of ergosterol, the sterol component in yeast membrane. Cholesterol is an essential component in the membranes of most eukaryotic cells, in which it mediates many functions including membrane fluidity, permeability and the formation of ordered membrane domains. The presence of cholesterol decreases the membrane fluidity.
POPC/POPG/POPE/cholesterol 50/25/25 M/M/M bilayers are more densely packed than POPC/POPG/cholesterol 75/25 M/M bilayers.(71) In contrast to POPC, the head group of POPE is a primary amine that makes it capable for the formation of intra and intermolecular hydrogen bonds to lipid phosphate groups.(72) As a result, the water-lipid interface of a POPE membrane is more densely packed than POPC membrane.
The results of titrations are summerized in Table 7 and 8.
The free energy of AMT3 increases from -7.01 Kcal/mol, when titrated with POPC/POPG SUVs (Table 4) to -6,47 and -6,37 Kcal/mol when titrated with POPC/POPG/cholesterol (Table 7)and POPC/POPG/POPE/cholesterol (Table 8) respectively. The binding constant decreases from 1700 kcal/mol (Table 4) to 700 M-1 and 600 M-1 titrating with POPC/POPG/cholesterol (Table 7) and with POPC/POPG/POPE/cholesterol (Table 8). Interestingly the ∆H increases from -9,21 to -7,37 and -5,36 kcal/mol while the ∆S increases from 7,14 to -2,93 and + 3,29 cal/mol K. Thus, with POPC/POPG/POPE/cholesterol the peptide-vesicle interaction is entropy driven while the interactions with the previous liposome system were enthalpy driven.
34
The binding constant of cyclo-AMT3 titrated with POPC/POPG/cholesterol SUVs is 250 M-1 and it slightly decreases to 150 M-1 when the peptide is titrated with POPC/POPG/POPE/cholesterol vesicles. The results of the titrations of cyclo-AMT3 with the two vesicles system show an increase of ∆G and ∆H and a decrease of ∆S (see Tables 7 and 8). The data show that the peptide-membrane interaction is opposed by membrane rigidity.
Figure 9 Titration of AMT3 and cyclo-AMT3 with POPC/POPG and cholesterol SUVs and with POPC/POPE/POPG and cholesterol SUVs at 35°C and pH 6.5. UP: ITC trace (differential heating power vs. time). Down: the cumulative heat of reaction as a function of the lipid to-to-peptide molar ratio.
0 10 20 30 40 50 60 70 80 -0.40 -0.35 -0.30 -0.25 -0.20 -0.15 -0.10 -0.05 0.00 -4.00 -3.00 -2.00 -1.00 0.00 0 10 20 30 40 50 Time (min) µ c a l/ s e c Molar Ratio K C a l/ M o le o f In je c ta n t 0 20 40 60 80 100 -0.30 -0.20 -0.10 0.00 -3.00 -2.00 -1.00 0.00 1.00 0 10 20 30 40 50 Time (min) µ c a l/ s e c Molar Ratio K C a l/ M o le o f In je c ta n t 0 10 20 30 40 50 60 70 80 -0.25 -0.20 -0.15 -0.10 -0.05 0.00 -2.50 -2.00 -1.50 -1.00 -0.50 0.00 0 10 20 30 40 50 60 Time (min) µ c a l/ s e c Molar Ratio K C a l/ M o le o f In je c ta n t 0 20 40 60 80 100 -0.25 -0.20 -0.15 -0.10 -0.05 0.00 -2.00 -1.50 -1.00 -0.50 0.00 0 10 20 30 40 50 60 Time (min) µ c a l/ s e c Molar Ratio K C a l/ M o le o f In je c ta n t AMT3 POPC/POPG/chol Cyclo-AMT3 POPC/POPG/chol AMT3 POPC/POPG/POPE/chol Cyclo-AMT3 POPC/POPG/POPE/chol
35
Table 7 Thermodynamic parameters for the binding of AMT3 and cyclo-AMT3 to POPC/POPG and cholesterol SUVs at 35°C and pH 6.5.
POPC/POPG and cholesterol peptide K(M-1) ∆
H(kcal/mol) ∆G°(kcal/mol) ∆S°(cal/(mol K)) pH T(°C) AMT3 700 -7,37 -6,47 -2,93 6.5 35 Cyclo-AMT3 250 -7,85 -5,84 -6,54 6.5 35
Table 8 Thermodynamic parameters for the binding of AMT3 and cyclo-AMT3 to POPC/POPG/POPE and cholesterol SUVs at 35°C and pH 6.5.
POPC/POPG/POPE and cholesterol peptide K(M-1) ∆
H(kcal/mol) ∆G°(kcal/mol) ∆S°(cal/(mol K)) pH T(°C) AMT3 600 -5,36 -6,37 3,29 6.5 35 Cyclo-AMT3 150 -6,33 -5,52 -2,62 6.5 35
3.3 Conformational analysis 3.3.1 CD spectroscopy
The conformational structure of cyclo-AMT1 was previously solved.(18, 38) in SDS micelles. SDS micelle solution is considered a simple plasma membrane- mimicking system. To compare our results to AMT1 and cyclo-AMT1, we studied the conformational behaviour of AMT2, cyclo-AMT2, AMT3 and cyclo-AMT3 in SDS micelle system.
A preliminary study of conformational preferences of cyclic and linear AMT derivatives were screened by CD spectroscopy. All CD spectra were recorded in water and in sodium dodecyl sulphate (SDS) micelle solution. CD spectra of linear and cyclic AMT derivatives were recorded in this system to explore their propensity to assume specific secondary structures in response to the
36
presence of membrane-mimicking interfaces. CD spectra of AMT1, AMT2 and AMT3 indicate the preponderance of disordered conformations both in water and in SDS micelles. CD spectra of cyclic peptides recorded in water and in SDS micelles are shown in Figure 10. They were quantitatively evaluated using the DICHROWEB interactive website (SELCONN algorithm); consistently with this analysis, a significant presence of turn conformation is evident in cyclo-AMT1 cyclo-AMT2 and cyclo-AMT3 in water. CD spectrum of cyclo-AMT2 in SDS micelles is similar to that exhibited in water solution; on the contrary CD spectra of cyclo-AMT1 and cyclo-AMT3 in SDS micelle solution have the shape characteristic of random coil conformation.
Figure 10. CD spectra of cyclo-AMT1, cyclo-AMT2 cyclo-AMT3 in water (on the left) and in SDS micelle solution (on the right).
37 3.3.2 NMR Spectroscopy.
The NMR structure of cyclo-AMT1 in SDS micelles was previously solved.(38, 65) In this work, NMR structure of AMT2, AMT3, cyclo-AMT2 and cyclo-AMT3 are solved and compared to cyclo-AMT1 structure. Accordingly a whole set of 1D and 2D proton spectra were recorded in pure SDS micelles. To check the absence of self-aggregation, spectra were acquired in the peptide concentration range of 0.5-15 mM. No significant changes were observed in the distribution and shape of 1H resonances, indicating that no aggregation phenomena occurred in this concentration range. The NOESY spectra of linear and cyclic peptides acquired in SDS micelles are showed in Figure 11. The spectra shown considerable high quality NOE cross-peaks that were essential to assign all resonance and to understand the conformational structure of peptides in exam. The chemical shift assignments of proton spectra were achieved via the standard systematic application of TOCSY and NOESY experiments. The proton chemical shifts of peptides in SDS micelle solution are reported in Tables 9-12.
38
Figure 11 . Low field region of NOESY spectra of AMT2 (A) cyclo-AMT2 (B) AMT3 (C) and cyclo-AMT3 (D) in SDS micelle solution. (600 MHz, T 298K)
C D
39
Table 9 1H chemical shift of AMT2 in SDS micelle solution.
Residue HN CαH CβH CγH CδH CεH Others His1 4.446 3.420 7.374 8.492 Arg2 8.546 4.273 1.697/1.651 1.544 3.058 6.976 Arg3 8.198 4.245 1.621 1.475/1.427 3.074 7.014 Trp4 7.802 4.607 3.229 7.157 Hε1 9.786 Hε3 7.510 Hη2 7.001 Hζ2 7.293 Hζ3 6.958 Trp5 7.642 4.464 3.145/3.068 7.036 Hε1 9.899 Hε3 7.401 Hη2 7.093 Hζ2 7.420 Hζ3 7.019 Arg6 6.843 4.052 1.412/1.080 0.933/0.760 2.823 6.870 Phe7 6.846 4.440 3.197/2.654 6.940 7.166 Hζ 7.081
Table 10 1H chemical shift of cyclo-AMT2 in SDS micelle solution.
Residue HN CαH CβH CγH CδH CεH Others His1 7.916 4.394 3.498/3.414 7.209 8.524 Arg2 8.255 4.391 1.998/ 1.640 3.238/3.151 7.213 Arg3 7.942 4.131 1.628 1.262/1.152 2.951/2.833 6.973 Trp4 7.110 4.732 3.159/2.663 7.193 Hε1 9.831 Hε3 7.397 Hη2 7.032 Hζ2 7.293 Hζ3 6.958 Trp5 8.395 4.784 3.572/ 3.129 7.453 Hε1 10.109 Hε3 7.647 Hη2 7.106 Hζ2 7.461 Hζ3 7.039 Arg6 6.383 3.504 0.958/0.536 0.300/-0.153 2.500/2.403 6.619 Phe7 7.915 4.573 3.382/3.283 7.197 7.289 Hζ 7.100
40
Table 11 1H chemical shift of AMT3 in SDS micelle solution.
Residue HN CαH CβH CγH CδH CεH Others His1 4.405 3.407 7.501 8.683 Gly2 8.639 4.026/3.985 His3 8.372 4.792 3.268/3.159 7.280 8.496 Arg4 8.220 4.188 1.580 1.460 2.992 6.979 Arg5 8.008 4.053 1.509/1.477 1.347 2.994 6.945 Trp6 7.558 4.568 3.228 7.206 Hε1 9.860 Hε3 7.528 Hη2 7.057 Hζ2 7.402 Hζ3 7.026 Trp7 7.487 4.451 3.048 7.022 Hε1 9.870 Hε3 7.409 Hη2 7.083 Hζ2 7.309 Hζ3 6.981 Arg8 7.072 4.042 1.410/1.139 0.949/0.796 2.845 6.885 Phe9 7.064 4.554 3.209/2.759 7.046 7.197 Hζ 7.107
Table 12 1H chemical shift of cyclo-AMT3 in SDS micelle solution.
Residue HN CαH CβH CγH CδH CεH Others His1 8.315 4.540 3.342/3.189 7.328 8.594 Gly2 8.163 3.994 His3 8.261 4.590 3.336/ 3.260 Arg4 8.174 4.260 1.827/ 1.729 1.516/ 1.424 3.006 7.097 Arg5 7.915 4.085 1.593 1.347/ 1.294 3.002 6.942 Trp6 7.674 4.495 3.216 7.264 Hε1 9.822 Hε3 7.510 Trp7 7.644 4.348 3.339 7.270 Hε1 9.972 Arg8 7.266 3.614 1.079/ 1.034 0.371/ 0.336 2.561/ 2.419 6.722 Phe9 7.662 Hζ 7.081
41
Figure 12 shows the NOE connectivities of AMT2, AMT3, cyclo-AMT2 and cyclo-AMT3 as derived from NOESY spectra in SDS micelles. Sequential NH-NH(i, i+1), and sporadic medium range CHα−NH(i, i+2) NOE effects were observed in the NOESY spectrum of AMT2. AMT3, cyclo-AMT2 and cyclo-AMT3 in pure SDS micelles, show sequential NH-NH(i, i+1) effects and several medium range NOEs including in particular CHα-NH(i, i+2) and NH-NH(i, i+2) along different triads of the sequences.
Figure 12 NOE connectivities of AMT2, cyclo-AMT2, AMT3, cyclo-AMT3 Cyclo-AMT3, in SDS micelle solution.
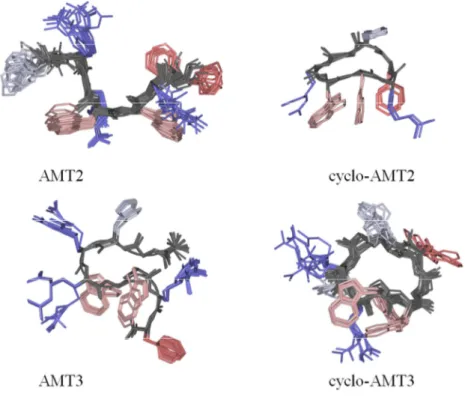
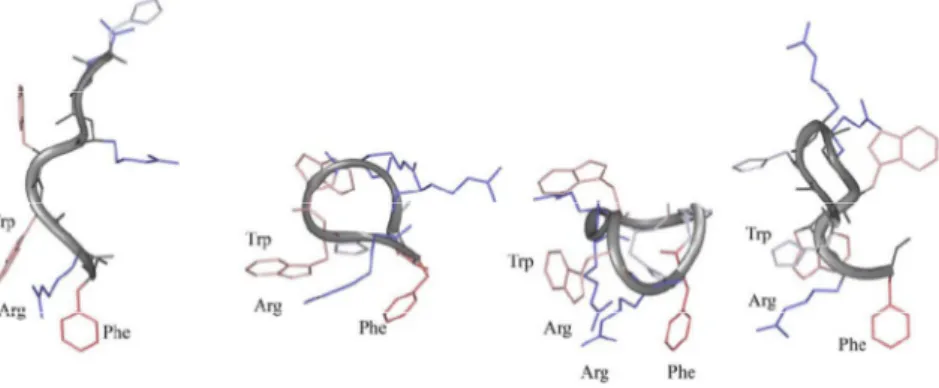
The structural calculations of AMT2, cyclo-AMT2, AMT3 and cyclo-AMT3 in pure SDS micelles, were carried out using CYANA software on the basis of NOE data. This data was transformed into interprotonic distances and imposed as restraints in the calculation.
Figure 13 shows NMR structure bundles of AMT2, cyclo-AMT2, AMT3, cyclo-AMT3 in SDS micelles. Analysis of AMT2 and cyclo-AMT2 structure bundle shows high structural agreement between the calculated conformers (RMSD < 0.80 Å), however the evaluation of backbone dihedral angles according to PROMOTIF procedure, indicates a minor presence of canonical secondary structures.
42
On the contrary PROMOTIF analysis of AMT3 structure bundle,(73) points to the presence of regular γ-turn structures on residues His3-Arg5 with H-bond between C=O His3 and HN Arg5 stabilizing the γ-turn structures. cyclo-AMT3 shows the preference for regular turn structures in Trp6-Phe9 segment. All the calculated structures show a common, ordered orientation of side chains confirming the preponderance of ordered structures in micelle solution.