UNIONE EUROPEA
FONDO SOCIALE EUROPEO PROGRAMMA OPERATIVO NAZIONALE 2000/2006 “Ricerca Scientifica, Sviluppo Tecnologico, Alta Formazione”
Regioni dell’Obiettivo 1 – Misura III.4 - “Formazione superiore ed universitaria”
DOTTORATO DI RICERCA IN INGEGNERIA CIVILE PER L’AMBIENTE ED IL TERRITORIO
Università degli Studi di Salerno
VIII Ciclo Nuova Serie (2006-2009)
SATELLITE REMOTE SENSING FOR
SURFACE SOIL WATER CONTENT
ESTIMATION
Candidate
GIOVANNA DE CHIARA
Doctoral Coordinator prof. ing. R.M.A. NAPOLI Tutor:
prof. ing. VITTORIO BOVOLIN prof. ing. PAOLO VILLANI
Co-Tutor:
SATELLITE REMOTE SENSING FOR SURFACE SOIL WATER CONTENT ESTIMATION
__________________________________________________________________ Copyright © 2010 Università degli Studi di Salerno – via Ponte don Melillo, 1 – 84084 Fisciano (SA), Italy – web: www.unisa.it
Proprietà letteraria, tutti i diritti riservati. La struttura ed il contenuto del presente volume non possono essere riprodotti, neppure parzialmente, salvo espressa autorizzazione. Non ne è altresì consentita la memorizzazione su qualsiasi supporto (magnetico, magnetico-ottico, ottico, cartaceo, etc.).
Benché l’autore abbia curato con la massima attenzione la preparazione del presente volume, Egli declina ogni responsabilità per possibili errori ed omissioni, nonché per eventuali danni dall’uso delle informazione ivi contenute.
Ai miei genitori….
“Bear in mind that the wonderful things that you learn in your schools are the work of many generations, produced by enthusiastic effort and infinite labour in every country of the world. All this is put into your hands as your inheritance in order that you may receive it, honour it, and add to it, and one day faithfully hand it on to your children. Thus do we mortals achieve immortality in the permanent things which we create in common. If you always keep that in mind you will find meaning in life and work and acquire the right attitude towards other nations and ages” (Albert Einstein talking to a group of school children. 1934)
“Pensate bene a questo: le cose ammirevoli che imparate a conoscere nelle vostre scuole sono l’opera di numerose generazioni, create in tutti i paesi della terra, a prezzo di grandi pene e sforzi appassionati. Tutto ciò è deposto nelle vostre mani, come un retaggio, in modo che lo accogliate, lo veneriate, lo sviluppiate e lo trasmettiate un giorno, fedelmente, ai vostri figli. E’ così che noi, esseri mortali, diveniamo immortali in questa cosa che noi creiamo in comune, contribuendo ad opere imperiture. Se voi pensate sempre a questo, troverete un senso alla vita e allo sforzo e nutrirete una giusta opinione nei confronti degli altri popoli e degli altri tempi” (A. Einstein).
i
TABLE OF CONTENTS...i
INDEX OF FIGURES...iii
INDEX OF TABLES ...vii
SOMMARIO ...ix
ABSTRACT ...xi
ACKNOWLEDGEMENTS ...xiii
ABOUT THE AUTHOR...xv
1 INTRODUCTION ...1
1.1 Context and aim of study ...1
1.2 Outline of the thesis ...5
2 REMOTE SENSING PRINCIPLES AND TECHNIQUES ...7
2.1 Electromagnetic Radiation ...9
2.1.1 Interaction with the Atmosphere...10
2.1.2 Radiation-Matter Interaction ...11
2.2 Remote Sensing Systems ...13
2.2.1 Passive sensors...15
2.2.2 Source of EM radiation for remote sensing ...17
2.2.3 Active Sensors...20
3 SATELLITE INSTRUMENTS ...35
3.1 TM/ETM+...35
3.2 ESA Satellite Radars...38
3.2.1 SAR/ASAR ...40
3.2.2 The ERS Scatterometer ...43
3.2.3 Sigma nought acquisition and processing ...46
3.2.4 Geophysical parameter retrieval...49
3.2.5 ERS-2 SCAT Mission Events...50
4 WATER SURFACE ESTIMATION ...53
4.1 Case Study and Data Set...54
4.2 Surface Water Detection Method...56
4.2.1 Analysis based on SAR images...56
4.2.2 Analysis Based on Landsat images...60
5 THE ADVANCED SCATTEROMETER PROCESSING
SYSTEM...65
5.1 ASPS Architectural Design ...66
5.2 Spatial resolution Enhancement...69
5.3 ASPS Scatterometer Products...70
5.4 ERS-2 Scatterometer Data Calibration...71
5.4.1 Antenna pattern...72
5.4.2 Gamma nought histograms and peak position evolution 76 5.4.3 Calibration analysis results ...81
5.5 ASPS Facility configuration ...81
5.6 ASPS Reprocessing activity and data quality control ...84
6 ASPS MEASUREMENTS FOR SOIL MOISTURE ESTIMATION...89
6.1 data sets ...92
6.2 Analysis performed...96
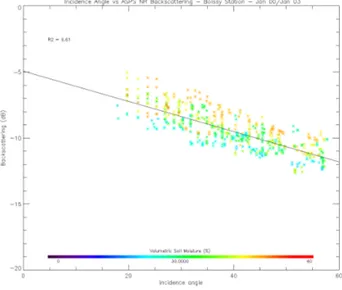
6.2.1 Backscattering against incidence angles ...96
6.2.2 Backscattering against volumetric soil moisture ...97
6.3 analysis results ...111
7 CONCLUDING REMARKS...113
iii
INDEX OF FIGURES
Figure 2.1 Electromagnetic Spectrum ...9
Figure 2.2: Diagram of atmospheric windows—wavelengths at which electromagnetic radiation penetrates the Earth's atmosphere...11
Figure 2.3: Example of Reflected, Absorbed, and Transmitted Radiation...12
Figure 2.4: Radiant energy of the blackbody in each temperature (Planck’s law). ...16
Figure 2.5: Emission spectra at different temperatures. ...17
Figure 2.6: Atmospheric windows and Emission spectra at different wavelenght. ...18
Figure 2.7: Reflected solar radiation and emitted thermal radiation of an average object ...19
Figure 2.8: Instantaneous field of view ...20
Figure 2.9: Radar system description...21
Figure 2.10: NRCS dependence from frequency...25
Figure 2.11: Radar cross section (over the sea) dependency from polarization. ...26
Figure 2.12: angular variation of the backscattering coefficient for different 27 Figure 2.13: Examples of surface-scattering patterns ...28
Figure 2.14: variation of dielectric constant as function of volumetric soil moisture...29
Figure 2.15: Backscattering coefficient as function of the incidence angle for wet and dry conditions. ...30
Figure 2.16 Remote sensing systems geometry...30
Figure 2.17: Radar geometry ...32
Figure 3.1: ERS-2 AMI Image mode...40
Figure 3.2: ERS-2 AMI Wind/Wave mode...41
Figure 3.3 ASAR Image Mode (left panel) and ASAR Wide Swath Mode (right panel)...42
Figure 3.4: ERS-2 Scatterometer...44
Figure 3.5: Scatterometer Node localization ...44
Figure 3.6: Scatterometer geometry acquisition ...46
Figure 3.8: Funzione di Hamming ...49 Figure 3.9. ERS-2 Global Mission Scenario ...51 Figure 3.10: ERS-2 Regional Mission 2003 – 2010: ascending passes
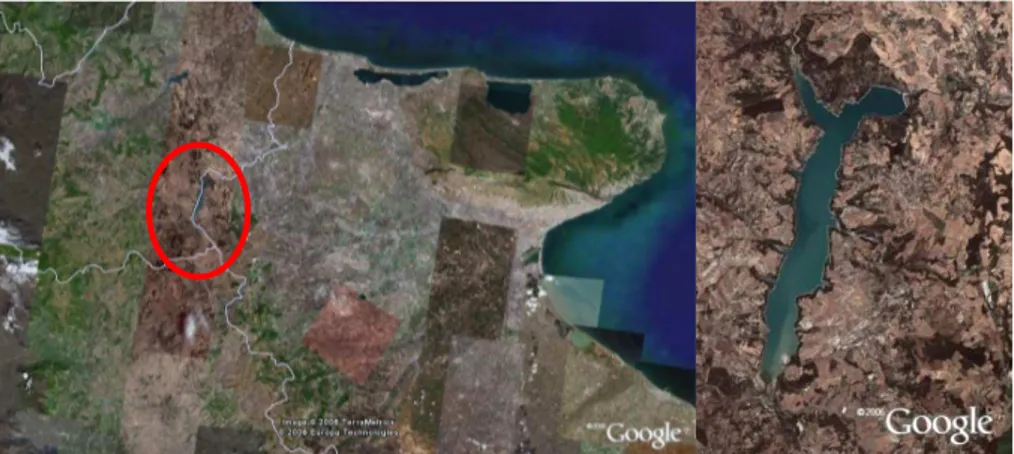
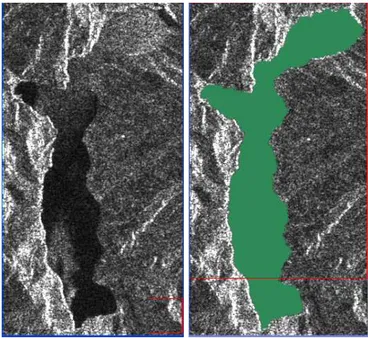
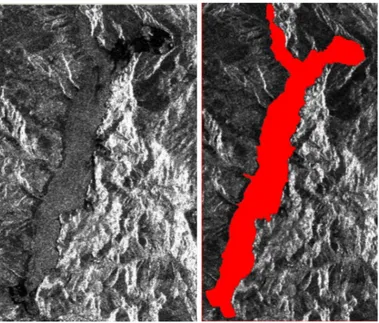
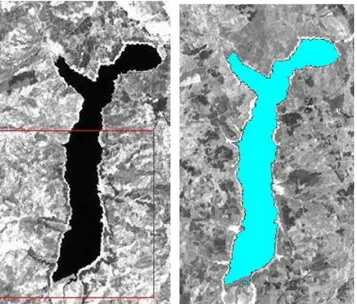
coverage during Cycle 140...52 Figure 4.1: Detail of the Occhito lake: dam is located at the end of the
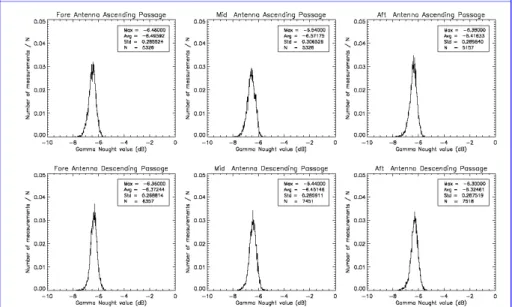
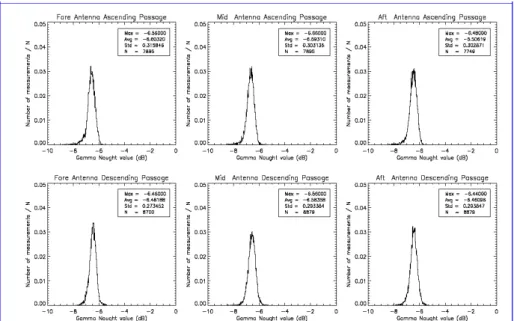
north-est branch. ...54 Figure 4.2 ERS-2 SAR image acquired on 27 February 1999. On the right panel water mask is shown. ...57 Figure 4.3 ERS-2 SAR image acquired on 17 July 1999: on the right panel the water mask is delineated. ...57 Figure 4.4 ERS-2 SAR image acquired on 12 January 2002: on the right the water mask is delineated...58 Figure 4.5 ERS-2 SAR image acquired on 28 December 2002: on the right the water mask is delineated...58 Figure 4.6 ENVISAT ASAR image acquired on 4 May 2003: on the right the water mask is delineated...59 Figure 4.7 ENVISAT ASAR image acquired on 27 February 2005: on the right the water mask is delineated...59 Figure 4.8 LANDSAT 5 TM band 4 image acquired on 20 August 1992: on the right the water mask is delineated...61 Figure 4.9 LANDSAT 7 ETM+ band 4 acquired on 16 August 1999: on the right the water mask is showed...61 Figure 5.1: ASPS Design overview ...67 Figure 5.2: Backscattering coefficient for the aft beam: ASPS nominal resolution (on the right) and high resolution (on the left) data...69 Figure 5.3 Gamma nought across the swath over the rain forest for cycle 31 data: In the upper panel the nominal antenna pattern; in the lower one the new antenna pattern. ...74 Figure 5.4: Gamma nought across the swath over the rain forest for cycle 51 data: In the upper panel the nominal antenna pattern; in the lower one the new antenna pattern. ...75 Figure 5.5 ERS-2 Gamma Nought histograms (Amazonas Area) for Cycle 31– Nominal Antenna Pattern...77 Figure 5.6 ERS-2 Gamma Nought histograms (Amazonas Area) for Cycle 31 – new antenna pattern...77 Figure 5.7 ERS-2 Gamma Nought histograms (Amazonas Area) for Cycle 51– Nominal Antenna Pattern...78 Figure 5.8 ERS-2 Gamma Nought histograms (Amazonas Area) for Cycle 51– New Antenna Pattern ...78
v Figure 5.9 Gamma Nought Standard Deviation for Cycle 31 (upper plot) and Cycle 51 (lower plot). In each histogram data processed with new
and nominal antenna pattern are compared...79
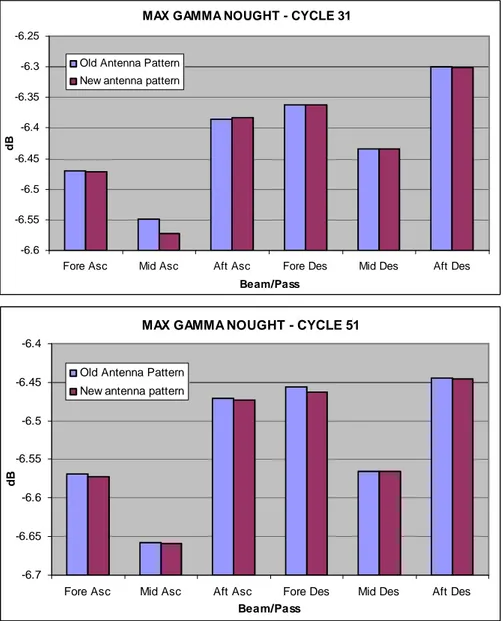
Figure 5.10: Maximum value of Gamma Nought for Cycle 31 (upper plot) and Cycle 51 (lower plot). Each histogram compare data processed with new and nominal antenna pattern...80
Figure 5.11 ASPS QC report: Yaw angle monitoring page...86
Figure 5.12: comparison between ASPS winds and backscattering and respectively ECMWF first guess winds and backscattering values derived by inverting CMOD5N model[Hans Hersbach-ECMWF]...87
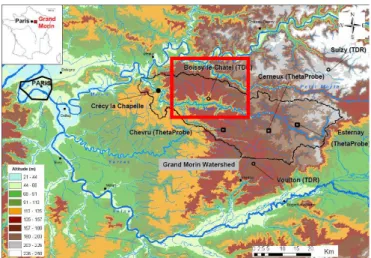
Figure 6.1: Boissy Le Chatel location. ...93
Figure 6.2: Boissy-Le-chatel site as observed from the satellite. ...93
Figure 6.3 SCAN network stations ...94
Figure 6.4 Location of Alabama stations from the SCAN project: stations selected are highlighted in the green box. ...95
Figure 6.5 SCAN stations analyzed as viewed from Google Map: for comparison with the Scatterometer node dimension a square of about 50km x 50km centered over WTARS station is shown. ...95
Figure 6.6: Backscattering measurements (fore, mid, aft beams) from NR products as function of the incidence angle...96
Figure 6.7: Backscattering measurements (fore, mid, aft beams) from HR products as function of the incidence angle ...97
Figure 6.8 Backscattering as function of in-situ soil moisture measurements: incidence angles range [26°-30°]...98
Figure 6.9 Backscattering as function of in-situ soil moisture measurements: incidence angles range [36°-40°]...98
Figure 6.10 Backscattering as function of in-situ soil moisture measurements: incidence angles range [46°-50°]...99
Figure 6.11 Single beam backscattering as function of soil moisture measurements: ASPS HR data, incidence angle range [26°-30°]. ...100
Figure 6.12 Single beam Backscattering as function of in-situ soil moisture measurements: HR products, incidence angles range [36°-40°]. ...101
Figure 6.13 Single Beam Backscattering as function of in-situ soil moisture measurements: HR products, incidence angle range [35°-41°]. 102 Figure 6.14 Fore Beam Backscattering as function of in-situ soil moisture measurements (incidence angles range [45°-51°])...102
Figure 6.15 Mid Beam Backscattering as function of in-situ soil moisture measurements (incidence angles range [45°-51°]. ...103 Figure 6.16 Backscattering as function of in-situ soil moisture measurements on seasonal base: HR products, incidence angles range [26°-30°].
...104 Figure 6.17 All beams Backscattering vs in-situ soil moisture: HR products analyzed as function of the season, incidence angles range [36°-40°]...105 Figure 6.18 Backscattering as function of in-situ soil moisture measurements on seasonal base: HR products, incidence angles range [46°-50°].
...106 Figure 6.19 Backscattering as function of in-situ soil moisture measurements:
spring season, incidence angles range [36°- 40°]...107 Figure 6.20 Mid beam backscattering vs in-situ soil moisture: spring season, incidence angles range [36°-40°]...108 Figure 6.21 Mid beam Backscattering vs in-situ soil moisture: spring season,
incidence angles range [46°-50°]...108 Figure 6.22 Backscattering coefficient against in-situ soil moisture: Newby station, incidence angle range [26°-30°]...109 Figure 6.23 Backscattering vs in-situ soil moisture: WTARS station, incidence
angle range [26°-30°]. ...110 Figure 6.24 Mid Beam Backscattering vs in-situ soil moisture measurements: AAMU station, incidence angles range [26°-30°]...111 Figure 6.25 Mid Beam Backscattering vs in-situ soil moisture measurements:
vii
INDEX OF TABLES
Table 2.1: Typical radar working frequencies...21
Table 3.1 Landsat 5 TM spectral bands ...36
Table 3.2: Landsat 7 ETM+ spectral bands ...37
Table 3.3: Scatterometer beams incidence angles...45
Table 4.1: images selected and Occhito water levels...55
Table 4.2 Comparison between remote sensing water surface analysis and in situ surface value. ...62
ix
SOMMARIO
Il telerilevamento satellitare è un’utile fonte di osservazione delle variabili e dei processi idrologici superficiali e può essere una pratica alternativa ai convenzionali sistemi di monitoraggio in-situ. La maggior parte dei processi relativi alle dinamiche idrologiche variano non solo su scala annuale ma anche su scale temporali più brevi che richiedono osservazioni più frequenti. Il principale vantaggio del telerilevamento è la capacità di offrire osservazioni sinottiche delle dinamiche e della distribuzione spaziale di fenomeni e parametri spesso difficili da monitorare con una elevata frequenza temporale mediante l’utilizzo delle tradizionali misure in-situ. Molte delle variabili che partecipano al bilancio dell’acqua superficiale possono essere ora osservate con sensori satellitari grazie ad un forte sviluppo di questa tecnologia negli ultimi decenni. Spesso il problema principale connesso all’uso delle acquisizioni satellitari è rappresentato dall’accuratezza delle misure che può variare da moderata ad eccellente in base al sensore utilizzato.
In questa tesi si è valutato l’utilizzo di sensori satellitari per il monitoraggio di due variabili utili per applicazioni idrologiche: l’estensione di corpi idrici e l’umidità del suolo.
La capacità di misurare l’estensione di corpi idrici è importante in molte applicazioni idrologiche; in particolare risulta un elemento rilevante per il monitoraggio delle alluvioni e per la gestione delle risorse idriche. Spesso queste informazioni sono difficili da ottenere mediante tradizionali rilevamenti in caso di aree inaccessibili o di masse d’acqua in movimento. Per questa attività di ricerca, come caso studio è stato selezionato un bacino artificiale per cui sono note le informazioni relative all’estensione della superficie di acqua. Le misure reali registrate giornalmente dal Consorzio di gestione del bacino sono state confrontate con le rilevazioni ottenute mediante utilizzo di immagini satellitari acquisite dai sensori SAR e TM/ETM+ ed hanno evidenziato buoni risultati. L’analisi ha inoltre messo in risalto anche i fattori da tenere in considerazione per i diversi tipi di sensori.
L’umidità del suolo è una variabile chiave in molti processi idrologici ed ecologici in quanto influenza lo scambio di acqua e calore latente tra la superficie del suolo e l’atmosfera. Nonostante l’alta variabilità spaziale di
questo parametro, è stato dimostrato che molti sensori satellitari sono capaci di derivare informazioni sull’umidità superficiale del suolo a livello di bacino idrografico. Tra i vari sensori lo Scatterometro risulta utile per studi climatici e di modellistica grazie ad una buona frequenza temporale, copertura globale ed una serie storica consistente. Sebbene questo sensore sia stato progettato per ricavare informazioni di vento superficiale sul mare, negli ultimi anni è stato evidenziato che le misure di backscattering hanno una elevata potenzialità per applicazioni su superfici terrestri.
La seconda parte di questo progetto di ricerca, relativo all’utilizzo di dati satellitari per il monitoraggio dell’umidità del suolo, è stata sviluppata presso la Serco S.p.A. nell’ambito del progetto Advanced Scatterometer Processing System (ASPS) sviluppato dall’Agenzia Spaziale Europea (ESA-Esrin) al fine di riprocessare l’intera missione ERS-Scatterometer. Sin dall’inizio della missione ERS-1 nel 1991 quasi 20 anni di misure di backscattering acquisite in banda C sono disponibili per studi e ricerche. Questo dataset molto consistente è importante soprattutto per analisi climatologiche. In questo tipo di studi è importante anche avere dati di alta qualità e soprattutto una serie storica omogenea come anche riconosciuto dal Global Climate Observing System (GCOS) dell’Organizzazione Meteorologica Mondiale.
L’obiettivo principale di questa parte di ricerca è stata la generazione dei nuovi prodotti ASPS caratterizzati da una migliore qualità radiometrica e risoluzione spaziale. Questo lavoro ha richiesto una lunga preparazione ma rappresenta un importante contributo nell’ambito delle serie storiche di dati acquisiti dallo Scatterometro disponibili per la comunità scientifica. Al fine di valutare l’utilizzo dei nuovi dati riprocessati, le misure di backscattering ottenutene con il nuovo processore ASPS sono state confrontate con misure in-situ di umidità del suolo. La relazione tra le due variabili è stata analizzata considerando diversi fattori: l’angolo di incidenza, l’angolo di azimuth, la risoluzione dei prodotti e la copertura vegetativa.
I risultati mostrano che una relazione tra backscattering e umidità del suolo esiste ed è condizionata dai fattori sopraelencati.
xi
ABSTRACT
Satellite remote sensing is a useful source of observations of land surface hydrologic variables and processes and could be a practical substitution of conventional in-situ monitoring. Most of hydrological dynamic processes change not only throughout the years but also within weeks or months and their monitoring requires frequent observations. The most prominent advantage of the remote sensing technologies is that they offer a synoptic view of the dynamics and spatial distribution of phenomena and parameters, often difficult to monitor with traditional ground survey, with a frequent temporal coverage. Many of the variables in the land surface water balance can now be observed with satellite techniques thanks to an extensive development over the last decades. Often the problem connected to the use of remotely sensed data is their accuracy that, according to the sensor used and to the application considered, can ranges from moderate to excellent.
The objective of this thesis has been to evaluate the use of satellite remote sensing techniques for the monitoring of two variables useful for hydrology applications: water body extension and soil moisture monitoring.
The capability to map water surface is important in many hydrological applications, in particular accurate information on the extent of water boundary is essential for flood monitoring and water reservoir management. Often, this information is difficult to retrieve using traditional survey techniques because water boundaries can be fast moving as in floods or may be inaccessible. In this PhD thesis, an artificial basin for which in-situ information about the water extension are available is used as case study. The area extension recorded daily by the dam owner is compared to the one retrieved by using satellite images acquired from SAR and TM/ETM+ sensors. The outcomes of the analysis show that satellite images are able to map water body surfaces with a good accuracy. The analysis also highlighted the factor to be taken into account while using types of sensors.
Soil moisture is recognized as a key variable in different hydrological and ecological processes as it controls the exchange of water and heat energy
between land surface and the atmosphere. Despite the high spatial variability of this parameter it has been demonstrated that many satellite sensors are able to retrieve soil moisture information of the surface layer at catchment scale. Among other sensors, the Scatterometer is very useful for climatic studies and modelling analysis thanks, respectively, to the temporal frequency, global coverage and to the long time series availability. Even though the ERS Scatterometer has been designed to measure the wind over the ocean surface, in recent years it has been pointed out that backscattering measurements have high potentiality for soil moisture retrieval.
The second task of this PhD thesis, concerning the use of satellite data for soil moisture monitoring, has been developed at Serco S.p.A. in the framework of the Advanced Scatterometer Processing System (ASPS) project developed by ESA (European Space Agency) to reprocess the entire ERS Scatterometer mission. Since the beginning of the ERS-1 Scatterometer mission in 1991 a long dataset of C-band backscattering signal from the Earth surface is available for studies and researches. This is a very consistent dataset, but in particular for climatology studies it is important to have high quality and homogeneous long term observation as also stated in the key guidelines included in the Global Climate Observing System (GCOS) from the World Meteorological Organization (WMO).
The main goal of this task has been the generation of the new Scatterometer ASPS products with improved data quality and spatial resolution. This achievement required a long preparation activity but represents an important contribution to the C-band Scatterometer dataset available to the scientific community. In order to evaluate the usage of the re-processed Scatterometer data for soil moisture estimation, the backscattering measurements derived in the new ASPS products have been then compared to in-situ volumetric soil moisture data and the relationship between radar backscattering and soil moisture measurements has been investigated under different conditions: angle of incidence, angle of azimuth, data measurements resolution, season of the year.
Analysis results show that a relationship between the C-band backscattering coefficient and the in-situ volumetric soil moisture exists and takes into account the incidence and azimuth angles and the vegetation cover.
xiii
ACKNOWLEDGEMENTS
This PhD research has been mostly carried out at Serco S.p.A. in collaboration with ESA in the framework of the ASPS project. SAR and Landsat images have been provided by ESA within a Category 1 project. Occhito Basin ground measurements have been supplied by the “Consorzio per la Bonifica della Capitanata”. In-situ soil moisture measurements have been downloaded from the “Global Soil Moisture Data Bank” (Robock et al., 2000) and the “Soil Climate Analysis Network” web sites.
At the end of this PhD program I need to say ‘grazie’ to many person involved directly and indirectly in this period of my life.
In first place, I would like to thank Prof. Paolo Villani and Prof. Vittorio Bovolin who gave me the chance to start this project and supported and followed my work since the beginning despite the distance.
I am especially grateful to Raffaele Crapolicchio that followed my Scatt work. His constant support, attempts to teach me all about the Scatt world, the scientific advices on the methodology and on the interpretation of the results at different stages as well as his very big patience, the encouragement and the choice to supervise me for the second time are highly appreciated.
I would also to thank Pascal Lecomte, with which talking of Scatterometer is a big pleasure. And Angelika Dehn to have always encouraged me to go on and shared with me many nights at office. A special thanks has to be addressed to Marina, my ‘guardian angel’ during this PhD program, whose help, smiles, bureaucratic support, the emails with the subject ‘do not forget…’ gave me the chance to arrive at the end of this journey. Thanks Marina!
Thanks also to the other friends at CUGRI and ‘al Cubo’ for the few but intense moments spent together and the moral support provided: Giusy, Dario, Giovanni, Ersilio, Ferdinando, Agostino, Giuseppe, Serena, Claudia. And to Antonia…for her advice and the “proper words at the right time”.
Many thanks to my colleagues in Serco that during these years, despite suffering my stress, showed me their friendship and gave a very big support in terms of cars (Sabrina, Gabriele, Lidia), interesting discussions about UTC times & julian dates (Sabrina), IDL helps (Lidia…mi faro en la niebla!), interesting questions (‘ancora il dottorato?’) or simply smiling (above all Lauretta). To Aidan for the “English correction service”. To Gareth for the “Oceanosophy” discussions and English “wordspots”. A very special mention goes to Michela and Teddy boy: their invaluable support in every moment of the day...and the night…their friendship and total availability have been essential over these years…dico vero!!! Thanks to my friends and flatmates, a big support network, to have suffered my obsession (PhD): Lucilla & Lucia… are u ready for dancing now on? The Fox Family (Zio Bambo included) for the love they demonstrated me in all the possible ways and the moral and material support they gave me even in the hardest moments; Aleffff…just to be Alefff! Alo for the shared feelings; Valeria to have shared doubts, feelings and experiences (but “no polpette” this time), Lemon for the last minute questions. Lucia which is always present in my life. To the Florentin group: Todz (which has always a thought for me), Pianino (my perl/grib/grads/meteo lighthouse), Massi (my favourite researcher) & my fellow adventure “buddy Louise” (Massi & Ramo...please…start now to write!). To the “Minuetto team” for the never tedious journeys and political discussions: I found friends indeed! And thanks to Chris that is able to send me texts on the right time that always make me smile. Thanks to Pablo, Jeffrey and Mociccione and the others for sure I forget…
And finally a big thanks to my family. Specially to my mother and father that always take care of me, have always encouraged me and taught me to give my best in everything I do. And to my sisters and brothers-in-law above all for my jewels: Simona, Fabiano and the little star Elettra.
xv
ABOUT THE AUTHOR
Giovanna De Chiara ha conseguito la laurea in Scienze Ambientali (indirizzo Marino Oceanografico) presso l’Università degli Studi di Napoli “Parthenope” nel 2002. La parte sperimentale del lavoro di tesi di laurea é stato svolto durante un tirocinio presso l’Agenzia Spaziale Europea (ESA-Esrin) in Frascati lavorando su un progetto dal titolo ”Tracking a tropical cyclone with ERS-SCAT: a CMOD4 model review”. Dal 2003 al 2005 svolge attività di ricerca presso “l’Osservatorio del Clima” dell’Istituto di Biometeorologia (CNR) di Firenze.
Nel 2006 usufruisce di una borsa di studio al Consorzio Inter-Universitario per la Previsione e Prevenzione dei Grandi Rischi (C.U.G.RI.) lavorando su un progetto relativo all’analisi di pericolosità meteorologica e alluvionale mediante utilizzo di dati satellitari. Nel Novembre 2006 si iscrive al Corso di Dottorato di Ricerca in Ingegneria Civile per l’Ambiente ed il Territorio (VIII ciclo Nuova Serie) con sede presso l’Università degli Studi di Salerno. Durante il corso di Dottorato svolge attività di ricerca sull’utilizzo di dati satellitari per la stima dell’estensione di corpi d’acqua e contenuto di umidità del suolo. Dal 2007 é responsabile presso la Serco S.p.A. dell’attività di controllo e monitoraggio dei dati acquisiti dallo Scatterometro, sensore operativo a bordo del satellite ESA ERS-2.
Giovanna De Chiara received a 5-year Batchelor of Science degree in Marine Environmental Sciences, with a specialization in Oceanography, from the Università degli Studi di Napoli Parthenope in 2002. Her thesis work was developed during an internship period at the European Space Agency (ESA-Esrin) in 2001 where she worked on the project “Tracking a tropical cyclone with ERS-SCAT: a CMOD4 model review”.
From 2003 to 2005 she worked at the “Climate observatory” of the Institute of Biometeorology (CNR-National Research Council) in Florence where she collaborated on different projects regarding meteorological hazards and climate changes. In 2006 she was the
recipient of a grant from the National Research Institute C.U.G.R.I. (Consorzio Inter-Universitario per la Previsione e Prevenzione dei Grandi RIschi) which related to remote sensing techniques for meteorological and flood risk analysis.
In November 2006 she took the PhD Course in Civil and Environmental Engineering. As a PhD student she developed research topics related to the use of remote sensing data for water body detection and soil moisture analysis. Since 2007 she has worked for Serco S.p.A. in Frascati where she has been responsible for the quality control of ERS-2 Scatterometer data as part of a support contract with the European Space Agency (ESA-Esrin).
1
1.1
C
ONTEXT AND AIM OF STUDYOver the last decade, the importance of the global hydrological cycle has become increasingly clear in understanding global processes. Often information related to the elements of the hydrological cycle are not satisfactorily monitored from in situ sensor networks that do not widely cover extensive areas of the Earth surface. The current observational information available on ground is so often inadequate for the monitoring the hydrological parameters.
It has been recognize that satellite remote sensing systems represents a precious source of observations and is playing an increasing important role in hydrology and water managements (Barrett et al., 1988). The most prominent advantage of this technology is the synopticity of the measurements over a defined spatial zone, with frequent temporal coverage of the observed scenes.
Each sensor has its own spatial resolution, temporal coverage and accuracy. The choice of the instrument to be used depends on the application and analysis considered and often a compromise among the three parameters is needed.
Despite the extensive development of this technique over the last years, one of the questionable point is the accuracy of remote sensing products, which is in general variable in space and times, and often not well known Nevertheless, the integration of remote sensing in hydrological sciences has recently made important progresses (Wagner et al., 2009).
In this research project, the employ of satellite data for hydrology applications has been evaluated. Among the many important areas of remote sensing application in surface hydrology, in this project the following ones have been considered: the water surface monitoring and the soil moisture estimation.
The capability to map inland water surface is important in many practical cases, from the reservoir management, through area planning, hydraulic modeling to flood monitoring. In recent years, the need to properly map water bodies has then gained a growing interest, in a world-wide perspective because of the increasing global water shortage problem. Often, this information is difficult to obtain using traditional survey techniques due to the lack of ground measurements or because areas could be inaccessible such as in the case of flood events. Moreover accurate information of water bodies areal extension is also important for flood prediction and monitoring (Smith, 1997; Baumann, 1999). In recent years, remotely sensed data collected by radar and optical satellites have been used for flood extent evaluation over regions characterized by different climate, land cover conditions and topography (Brivio et al., 2002). As general approach, a multi-source satellite images technique is used for water body extraction since this allow to overcome the limits connected to both active and passive satellite sensors.
Among different methods developed to extract water bodies, threshold method is the simplest one (Zhang et al., 2006). Despite its simplicity, it has been noticed that the extraction accuracy, related to the use of this method, could be affected by the definition of the threshold.
In this PhD research a straightforward threshold method has been applied to active and passive sensors images, respectively SAR and TM/ETM+ images, acquired over an artificial reservoir selected as case study. The Occhito lake has been chosen because of in-situ data related to the water surface extension is available and also the dynamic of the basin is know. To evaluate the accuracy of the water body extraction, results obtained from the applied method have been compared to in-situ water extension measurements as provided by the dam owner.
The second part of this research project concerns soil moisture estimation. Soil moisture plays a key role in numerous hydrological processes as it drives the water and energy exchanges between soil surface, vegetation and atmosphere. The need for soil moisture observations and the limited availability of field measurements has led to more research in the field of remote sensing. Despite the high spatial variability of this variable, different studies have demonstrated that many satellite sensors are able to retrieve soil moisture information of the surface layer at catchment scale. Long-term availability and continuity of satellite system is also of great concern in Earth Observation (Wagner et
3 al., 2007) especially when dealing with climatology and modeling applications. Operational hydrology, instead, gives strong requirements in terms of availability, timeliness and reliability of remote sensing products.
Among the various remote sensing techniques, approaches based on the microwave measurements offer the most direct way of retrieving remote sensing as they take advantage of the strong relationship between the soil moisture content and dielectric constant of the soil (Ulaby et al., 1982). In recent years the great interest in microwaves techniques for soil moisture application led to the development of dedicated missions based on microwave sensors such as the case of the Soil Moisture and Ocean Salinity (SMOS) satellite (launched on November 2009) and Soil Moisture Active Passive (SMAP) mission (whose launch is foreseen in 2013). Beforehand, for years satellite hydrology relied on systems designed primarily for other applications such as for oceanography or meteorology (Barrett et al., 1998). This is the case of the C-band radar Scatterometer that has been originally designed for wind retrieval over the ocean. In recent years it has been demonstrated that C-band Scatterometer data may also be useful for soil moisture monitoring over land surface (Wagner et al., 1998). One of the advantage of the Scatterometer data is the long dataset availability, of great interest for climatic and modeling applications.
The first European Scatterometer was launched in 1991 by the European Space Agency (ESA) on board the ERS-1 satellite. It has been followed by ERS-2 Scatterometer launched in 1995 and currently into operation. The ERS Scatterometer mission has being providing so far over than 19 years of backscattering measurements of the Earth surface with a spatial resolution of 50 km. Since 2006 a follow-on of the ERS Scatterometer, the Advanced Scatterometer (ASCAT), is operational on board the METOP satellite. ASCAT technical characteristics are nearly identical to its precursor but it has an enhanced spatial (both 25km and 50 km) and temporal resolution. These satellite will guarantee, in the next future, more than 20 years of observations.
A first multi-year, global soil moisture data set from ERS Scatterometer has been derived by Wagner et al. from the Vienna University of Technology (Wagner et al., 2003). The soil moisture data is retrieved from the radar backscattering using a change detection method: the lowest and the highest backscattering measurements of the time series analyzed over a certain area represent, respectively, the driest and wettest
soil moisture conditions. The soil moisture values can, therefore, range between 0% and 100%. Different studies have been based on this soil moisture dataset (Paris Anguela et al, 2008; Laguardia et al., 2008; Liu et al., 2008) for comparison with in-situ measurements or model outputs finding a quite good agreement. Since 2008 this method is operationally applied to ASCAT data to provide near-real-time soil moisture products. The soil moisture dataset generated by Wagner et al. (2003) is based on the ERS Scatterometer products operationally distributed to the users since the beginning of the mission in 1991. But since then many events impacted the Scatterometer mission that have affected the quality of the data (Crapolicchio et al., 2004).
The need of high quality and of homogenous long term observations is fundamental not only for soil moisture estimation but for many kinds of applications as also stated in the key guidelines of the Global Climate Observing Systems. These requirements, together with the need of enhanced spatial resolution, leaded ESA to develop the Advanced Scatterometer Processing System (ASPS) with the main aim to reprocess the entire ERS Scatterometer mission and provide the users community with enhanced quality and spatial resolution products (Crapolicchio et al., 2004).
This part of the work has been carried out at Serco S.p.A in the framework of the ASPS project. In this contest different activities has been performed, as described in this thesis, with the main aim to generate the new ASPS products. This activity represents an important contribution to the available Scatterometer datasets as it allowed to provide the scientific community with new enhanced ERS C-band Scatterometer data. This is confirmed by the fact that the generation and distribution of these new enhanced products have been long requested from scientists that work with Scatterometer measurements. To achieve the goal, first of all a calibration analysis is has been completed in order to improve the radiometric quality of the ASPS data. The main objective of this part of research is to compute the best calibration constants and evaluate a new improved antenna pattern profile to be used for the reprocessing project. Other analysis and tests are then necessary to properly define the correct ASPS configuration before the reprocessing campaign start. Within the ASPS reprocessing activity new ERS Scatterometer products with a spatial resolution of 25 km and improved radiometric quality have been generated. To analyze these new products in the perspective of soil moisture applications, the backscattering
5 measurements derived in the ASPS products are compared to in-situ volumetric soil moisture data and the relationship between radar backscattering and soil moisture measurements is investigated under different conditions.
1.2
O
UTLINE OF THE THESISFundamentals of the remote sensing principles and techniques are widely illustrated in Chapter 2. Explanation of the electromagnetic spectrum and the ranges useful for satellite applications are provided together with the description of active and passive systems.
In Chapter 3 the satellite sensors used to carry out this research project are reported in order to understand the acquisition principles and the physical background. SAR sensors on board the ERS-2 and ENVISAT satellites and TM/ETM+ on board Landsat missions have been used to perform the analysis related to the surface water estimation and described in this chapter. The second part of the chapter is dedicated to the description of the ERS Scatterometer with reference also to the backscattering processing and to the geophysical parameter retrieval. Chapter 4 reports the analysis concerning the water body extraction. The Occhito Lake, selected as the case study, and related water extension ground measurements are illustrated. The threshold method applied to both SAR and TM/ETM+ images is then explained. The water extraction results obtained are further compared to in-situ ground measurements.
The second part of the PhD research, concerning the ASPS project and soil moisture analysis, are then described. In chapter 5 the ASPS project is explained in terms of objectives and facility architectural design. All the investigations performed before the Scatterometer reprocessing project start have been explained. These mainly include the calibration analysis performed to improve the radiometric quality of the Scatterometer data. Furthermore the ASPS facility configuration and the quality control performed on the data are showed.
Once the new ASPS products have been generated, they are analyzed in the perspective of the soil moisture applications. In Chapter 6 some in-situ volumetric soil moisture datasets have been selected and detailed. Then the backscattering coefficient stored in the ASPS products are compared to in-situ soil moisture observation considering different conditions: spatial resolution, azimuth angles and season of the year. Finally Chapter 7 illustrates concluding remarks.
7
2
REMOTE SENSING PRINCIPLES AND
TECHNIQUES
Generally Remote sensing is defined as “the science (and to some extent, art) of acquiring information about the Earth's surface without actually being in contact with it. This is done by sensing and recording reflected or emitted energy and processing, analyzing, and applying that information”.
Remote sensing systems, particularly those on board satellite platforms, provide repetitive and consistent views of the Earth and represent an invaluable instrument for monitoring the Earth system and the effect of human activities on our planet.
Some of the important applications of remote sensing techniques are:
- environmental assessment and monitoring
- global changes detection
- retrieval of global parameters for large-scale modeling.
The importance and the interest in remote sensing for Earth monitoring can be explained by the many advantages given by this technique, summarized as follows:
• Synoptic View: Remote sensing systems represent a rapid method of acquiring up-to-date information simultaneously over a large geographical area. This facilitates the study of various features of the Earths’ surface in their spatial relation to each other and helps to delineate the required features and phenomena. Furthermore often regional phenomena which are invisible from the ground are clearly visible through satellite acquisitions.
• Repetivity: Satellite sensors provide frequent and repetitive coverage of the Earth and of the area of interest. These time series are very useful for studying process dynamics, area monitoring or change detection analysis;
• Accessibility: The remote sensing technique is a practical way to obtain data from inaccessible regions where it is not possible to do a ground survey (i.e. , e.g. Antarctica, Amazonia).
• Time Conservation: Since information over a large area can be gathered quickly, the techniques save time and human effort;
• Cost Effective: Remote sensing especially when conducted from space, is an intrinsically expensive activity. Nevertheless, cost-benefit analysis demonstrates its financial effectiveness, and speculative or developmental remote sensing activity can be justified in this way. It is a cost-effective technique as repetitive fieldwork is not required and also a large number of users can share and use the same data.
The use of satellite techniques for the Earth monitoring presents some limitations. Satellite measurements are not direct sensing the geophysical phenomenon. So to use them it is useful to have some knowledge of the theory on how the instrument makes the measurements and the technique used to retrieve the geophysical phenomenon. The use of the satellite data requires also knowing the residual measurements uncertainty, which can be obtained after a proper calibration and validation activity. That uncertainty could be large for specific application and this has to be considered when using satellite products. In this perspective, international board in charge of the calibration and validation of satellite data, named CEOS (Committee of Earth Observation Satellites), has established a Quality Assurance Framework for Earth Observation (QA4EO). QA4EO has the aim to guarantee, for each delivered remote sensing product, the availability of a quality indicator (QI) based on documented quantitative assessment of its traceability to international community agreed reference standards (http://qa4eo.org).
Some remote sensing acquisitions must be corrected geometrically and geo-referenced in order to be useful as maps, not only as pictures.
Distinct phenomena can be confusing if they look the same to the sensor, leading to classification error. Example: artificial & natural grass in green light (but infrared light can easily distinguish them).
9 Often Phenomena which were not meant to be measured (for the application at hand) can interfere with the image and must be accounted for. Examples for land cover classification: atmospheric water vapor, sun vs. shadow (these may be desirable in other applications).
Resolution of satellite imagery could be too coarse for some applications such as detailed mapping and for distinguishing small contrasting areas.
2.1
E
LECTROMAGNETICR
ADIATIONAll sensors onboard remote sensing platforms use the electromagnetic radiation to acquire information. The sensors contain detectors to record specific wavelengths within the Electromagnetic Spectrum (EMS). The EMS ranges from the shorter wavelengths (including gamma and x-rays), through ultraviolet (UV) at 100nm, visible, infrared (IR) and microwave to the longer wavelengths (including broadcast radio waves) (Figure 2.1).
Figure 2.1 Electromagnetic Spectrum
There are several regions of the electromagnetic spectrum often called bands, or spectral bands which are useful for remote sensing. The ultraviolet (UV) portion of the spectrum has the shortest wavelength useful for the remote sensing. The visible spectrum is defined sharply between 0.4 and 0.7 µm (400 to 700 nm) The shortest visible wavelength is violet and the longest one is red. The next portion of the spectrum includes three different categories of infrared (IR) wavelength: near-IR,
mid-IR and thermal IR. At much longer wavelengths (1mm to 1m) is the microwave portion of the spectrum. The differentiation between near-IR and thermal-IR and between the latter and microwave is used rather loosely.
Most common remote sensing systems operate in one or several of the visible, IR or microwave portions of the spectrum. The choice of bands to use is governed firstly by the atmospheric transmission spectrum and secondly by the source of the e.m. energy in relation to the application.
2.1.1 Interaction with the Atmosphere
Before the radiation used for remote sensing reaches the Earth’s surface it passes through the Atmosphere where it may be absorbed or scattered by the constituent particles and gases in the atmosphere.
The scattering occurs when particles or large gas molecules (atmospheric components) interact with the electromagnetic radiation modifying its original path. The direction of scattering is unpredictable. The amount of scattering depends on the wavelength, the abundance of particles and the distance covered by the radiation. For remote sensing purposes the scattering is important only in the visible and near infrared regions.
Three types of scattering are possible:
Rayleigh Scattering: results from constituents that are much smaller than the radiation wavelengths. It takes place in the upper atmosphere mostly due to molecular gases (N2 O2, CO2 and water vapor). This effect increases with shorter wavelengths and is the cause of the blue skylight and even of red sunsets as seen from the earth.
Mie Scattering: occurs when the particles in the atmosphere are of the same size as the radiation wavelengths. It is mostly due to dust, smoke and water vapor and mainly affects the longer wavelength in the lower portion of the atmosphere.
Non-selective Scattering: when the particles are much larger than the radiation wavelengths a non-selective (wavelength-independent) scattering occurs. This is the case of water droplets and large dust particles.
The absorption in the atmosphere is mainly caused by water vapor, carbon dioxide and then ozone and mainly affects the visible and
11 infrared bands. Each type of molecule absorbs electromagnetic energy in a very specific region of the spectrum. As a result, only the wavelength regions outside the main absorption bands of the atmospheric gases can be used for remote sensing. These regions are known as the Atmospheric Windows.
By comparing the characteristics of the two most common energy/radiation sources (the sun and the earth) with the atmospheric windows available to us, we can define those wavelengths which can be most effectively used for remote sensing (Fig.2.2).
Figure 2.2: Diagram of atmospheric windows—wavelengths at which electromagnetic radiation penetrates the Earth's atmosphere.
The Faraday Rotation for polarimetric sensor operated in the microwave range. Ionosphere and Earth Magnetic field play a major role to rotate the polarized signal from the Earth surface. This, for example, has an impact for sensor operated at L-band and used to retrieve Ocean salinity (Le Vine et al., 2002).
2.1.2 Radiation-Matter Interaction
The EMR that is not absorbed or scattered in the atmosphere reaches the Earth’s surface and is splitted into 3 modes of energy-interaction response:
- Transmittance (t): a fraction of the radiation penetrates into certain surfaces materials (i.e. water) and if the material is transparent and thin in one dimension it normally passes through with some diminution
- Absorptance (α): a fraction of the radiation is absorbed within the medium; a portion of this energy is re-emitted usually at longer wavelengths and some remains to heat the object;
- Reflectance (ρ): a part of the radiation reflects at specific angles depending on the surface roughness and the angle of incidence of the rays. Reflected light is what we know as colour (chlorophyll in plants reflects green).
Because they involve ratios (to irradiance), these three parameters are dimensionless numbers (between 0 and 1), but are commonly expressed as percentages. Following the Law of Conservation of Energy:
1
= +
+ρ t
α
Figure 2.3: Example of Reflected, Absorbed, and Transmitted Radiation The relative amount of reflection, absorption and transmission depends on the wavelength radiation and the material.
Depending on their application, these interactions may be the source of the signal to acquire or may be the source of the signal, or may confound the desired signal. Below are some examples:
Reflection as the signal: This is probably the most common remote sensing situation. The reflected radiation is what our eyes use to see objects, causes near-infrared film to record vegetation, and allows radar images of the earth to be created.
Absorption as the signal: Atmospheric gases, such as ozone, will absorb at specific wavelengths. By measuring sunlight passing through the
13 atmosphere to the ground and calculating how much energy was lost by absorption, the concentration of a specific gas can be estimated.
Absorption as a confounding signal: Often absorption of light will introduce uncertainty in the desired measurement. Almost all remote sensing of the earth's surface from space is confounded by atmospheric absorption. For the visible part of the spectrum, absorption is only a serious problem when looking at relatively dark objects, such as the ocean, or if there are clouds. In these cases, the desired signal may be reduced to the noise level of the sensor, making interpretation impossible. For other parts of the spectrum, absorption may be so high that remote sensing at those wavelengths will not work, and only a few "atmospheric windows" through the atmosphere are available.
For any material, the amount of solar radiation that it reflects, absorbs and transmits changes with the wavelengths. By plotting the reflectance (%) against the wavelength the spectral signature is obtained for this object. Thus, two features that are indistinguishable in one spectral range may be very different in another portion of the spectrum. For example, water and vegetation may reflect somewhat similarly in the visible wavelengths but are almost always separable in the infrared. This is an important property of the matter that allows identifying different substances or classes by their individual spectral signature.
2.2
R
EMOTES
ENSINGS
YSTEMSRemote sensing systems can be organized according to different classifications.
In terms of spectral regions used for the acquisition, sensors can be classified into:
• Visible and reflective infrared • Thermal infrared
• Microwave
With respect to the type of energy resources they can be divided as: - Passive sensors: that measure the energy reflected (when the illumination source is external) or the radiation emitted by the scene observed;
- Active sensors: that illuminate the scene and measure the backscattered signal, as the radars do. These sensors create their own energy and are not dependent on the sun’s energy or the thermal properties of the earth. Advantages for active sensors include the ability to obtain measurements anytime, regardless of the time of day or season. Together with the type of sensor to be used (mainly dependent of the type of the scene to observe), one of the parameters to be considered when selecting the system to use is the resolution. The resolution is defined as the ability of the entire remote sensing system to render a sharply defined image.
For any remote sensing the resolution is specified in terms of spectral resolution, radiometric resolution, spatial resolution and temporal resolution, which are described as follows:
• Spatial resolution: refers to the size of the smallest possible feature or object that can be detected as a separate object. Or as the minimum distance the two point features on ground should have in order to be distinguished as separate objects. It is important to highlight that higher resolution systems generally have smaller coverage areas.
• Radiometric Resolution: refers to the smallest change in radiation intensity level that can be discriminated by the sensing system. The finer the radiometric resolution of a sensor, the more sensitive it is to detecting small differences in reflected or emitted energy.
• Spectral resolution: describes the ability of a sensor to define fine wavelength intervals. The finer the spectral resolution, the narrower the wavelengths range for a particular channel or band. On the basis of the spectral resolution, the system can be classified as panchromatic (single wavelength band with a large bandwidth), multispectral (several narrow bandwidth bands) and hyperspectral (hundreds of very narrow bandwidth bands). • Temporal resolution: is the pass frequency of the satellite above
the same point of the Earth surface; It is specified as the number of days in which the satellite re-visits the exact same area with the same viewing angle.
15 All these characteristics are taken into account when choosing the data for a specific application. Indeed some users may require frequent and repetitive coverage with low spatial resolution (i.e. meteorological applications) while others may need a high resolution with non frequent coverage (i.e. mapping purposes).
2.2.1 Passive sensors
Passive sensors measure radiation naturally reflected or emitted by the Earth and the constituents of its atmosphere.
The fundamental basis of passive remote sensing is that any object above absolute zero (0°K or -273 °C) continuously emits radiation.
A blackbody is defined as an idealized, perfectly opaque, material that absorbs all the incident radiation at all frequencies, reflecting none [Ulaby et. al., 1982]. It converts all incident radiant energy into heat energy. Because no light is reflected or transmitted, the object appears black when it is cold. A blackbody is also a perfect emitter, since energy absorbed by a material would increase its temperature if no energy were emitted.
For a given temperature and wavelength, no other body can emit more energy that a black body.
The spectral characteristics of the thermal emission from a black body at temperature T are described by the Planck’s law:
] 1 ) / [exp( ) , ( 2 5 1 − = T C C T M
λ
λ
λ
(Eq. 2.1) With:M = the spectral radiant exitance (sometimes called emittance) in Wm-2
µm-1
λ = wavelength in µ
T = absolute temperature in Kelvin C1 = 3.74 x 10
-16 W m2
C2 = 1.44 x 10 -2
Integrating the equation X over all wavelengths (from λ=0 to λ=∞) , the total emittance of a black body can be found:
4
T
M =σ (Eq. 2.2)
This is called the Stefan-Boltzman law and σ is Stefan-Boltzman Constant and equal to 5.669 x 10⁻⁸ W m-2 K-4.
Figure 2.4: Radiant energy of the blackbody in each temperature (Planck’s law).
Analyzing the curves in Fig.2.4 it can be noted that the spectral radiant emittance distribution is continuous with a single maximum for each temperature. As the temperature increases, the maximum shifts to the shorter wavelength and all over the spectral range the radiant exitance value is higher than that for lower temperatures.
The relation between the spectral peak for each temperature and the wavelength is given by the Wien’s Displacement Law:
3 maxT =C
λ
(Eq. 2.3)This law gives for each temperature the wavelength at which the emittance is maximum. If λmax is expressed in µm and T in ˚K, C3 is
17 Equation 2.1 is valid for a perfect emitter such as the blackbody. Real materials, usually referred as grey bodies, emit less than a blackbody does and do not necessarily absorb the entire energy incident upon them. The emission of a real surface is defined with respect to the blackbody and is described by its spectral emissivity, ε(λ):
) , ( ) , ( K blackbody K material M M o o λ λ
ε
= (Eq. 2.4)Emissivity is dimensionless with the value ranging from 0 to 1 (0 for an on radiating source a 1 for a blackbody). The spectral emissivity is nearly independent of temperature but it is a function of the type of the material. Significant changes in spectral emissivity can be expected due to change of state (melting, vaporization), oxidation or any other changes that modify the arrangement of atomic and molecular components.
2.2.2 Source of EM radiation for remote sensing
For remote sensing the sun is the most important source of electromagnetic radiation. It emits as a blackbody radiator whose temperature is about 6000K (Fig. 2.5). Its radiation covers ultraviolet, visible, IR and radio frequencies and the maximum (according to the Wien’s Displacement) is around 0.55µm within the visible region.
Figure 2.5: Emission spectra at different temperatures.
At the Earth’s surface, the sun energy subtends a solid angle of about 7 x 10⁻⁵ sr, and so the irradiance is reduced by a factor of about 10-5 (dashed
surface is modified when passing through the atmosphere due to absorption and scattering phenomena as already mentioned in Par. 2.1.1 (Atmospheric windows).
The Earth’s temperature, instead, is about 300K (Fig. 2.5). From the Wien’s displacement law, this means the maximum spectral radiance existence from earth features occurs at a wavelength of about 9.7µm. Because this radiation is correlated with the Earth temperature it is called ‘thermal infrared’ energy.
The visible portion of the spectrum, to which our eyes are most sensitive, corresponds to both an atmospheric window and the peak energy level of the sun. Note also that heat energy emitted by the Earth corresponds to a window around 10 µm in the thermal IR portion of the spectrum, while the large window at wavelengths beyond 1 mm is associated with the microwave region.
Figure 2.6: Atmospheric windows and Emission spectra at different wavelenght.
Hence, the choice of the portion of the spectrum to be used for remote sensing applications is ruled by the atmospheric transmission spectrum and by the source of the radiation.
When the sun is present we can observe earth features by measuring the reflected solar energy. Indeed most remote sensing systems are designed to collect reflected radiation: if land or sea features are to be observed by the reflection of incident solar radiation then the high frequency of solar
19 radiations spectrum should be used. Alternatively, if the self-emission of radiation by the sea or land is to be measured, sensors at lower frequency need to be used. The general division between reflected and emitted energy is about 3 µm: below this, reflected solar energy prevails, above it, the emission of the Earth becomes the dominant source for passive remote sensing (Fig, 2.7).
Figure 2.7: Reflected solar radiation and emitted thermal radiation of an average object
The spatial resolution of passive sensors mainly depends on their Instantaneous Field of View (IFOV). The IFOV (Fig.2.8-left panel) is the angular cone of visibility of the sensor (A) and determines the area on the Earth's surface which is "seen" from a given altitude at one particular moment in time (B). The size of the resolution cell is then obtained by multiplying the IFOV by the distance from the ground to the sensor (C). In case of a scanning sensor with constant IFOV (Fig,2.8-right panel) the ground area represented by pixels at the nadir will have a larger scale then those pixels which are off-nadir. This means that spatial resolution will vary from the image centre to the swath edge. IFOV is a combination of geometric, mechanical and electronic properties of the imaging system. Geometric properties include satellite orbital altitude, detector size, and the focal length of the optical system (Simonett 1983).
Figure 2.8: Instantaneous field of view
2.2.3 Active Sensors
Some sensors, such as radar systems, supply their own source of energy to illuminate features of interest. These systems are therefore defined as Active systems, in contrast to passive system that sense the energy naturally available.
RADAR stands for RAdio Detection And Ranging. RADAR systems are active sensors which provide their own source of electromagnetic energy. It consists fundamentally of a transmitter, a receiver, an antenna, and an electronic system to process and record the data. The transmitter emits radiation in a series of pulses at regular intervals which are focused by the antenna into a beam. The radar beam illuminates the surface obliquely at a right angle to the motion of the platform. When the energy reaches the target, some of the energy is reflected back towards the sensor.
Radars typically work at microwave frequencies that are able le to penetrate through clouds and most rain and can operate independently from the light of the sun. In Tab. 1 the common Radar Bands used for remote sensing applications are showed.
21
Band Frequency Wavelenght (most common)
X 8 to 12 GHz 2.5 to 4.0 cm (3.0 cm)
C 4 to 8 GHz 4 to 8 cm (6.0)
L 1 to 2 GHz 15 to 30 cm (24.0)
P 0.3 to 1 GHz 30 to 100 cm (65 cm)
Table 2.1: Typical radar working frequencies.
2.2.3.1
Radar Equation
The radar generates a short (microseconds) high power Radio Frequency (RF) pulse of electromagnetic energy. The radar then switches into receiving mode, and waits for the echo to return. The time delay is interpreted in terms of distance to the target.
The fundamental relation between the characteristics of the radar, the target, and the received signal is called the radar equation. The geometry of scattering from an isolated radar target (scatterer) is shown in the Fig.2.9, along with the parameters that are involved in the radar equation (Ulaby et al., 1982).
When Pt is the power transmitted by an antenna, Gtis the gain of the antenna (representing its directional characteristics), R is the distance between the transmitter and the target, the power density of the transmitted beam at the target or scatterer (power/unit area incident on it) is: 2 4 t t t s R G P S π = (Eq.2.5) Where:
PtGt = is the power per unit solid angle transmitted by the antenna in the
direction of the scatterer 1/4πRt
2 = is the reduction in the power density associated with
spreading of the power over a sphere of radius R surrounding the antenna.
The power intercepted by the scatterer can be obtained by multiplying the power density Ss for the effective area of the scatterer Ars:
rs sA S = rs P (Eq. 2.6)
The effective receiving area of the scatterer is a function of its orientation relative to the incoming beam.
Some of the power received by the scatterer is absorbed in losses; it becames an antenna re-radiating with its own antenna pattern the rest of the energy in various directions. The fraction absorbed is f , so the a
fraction reradiated is 1- f and the total power reradiated by the a
scatterer is ) f (1 P Pts = rs − a (Eq. 2.7)
The power is re-irradiated by the scatterer in all the directions but only a fraction is in the direction of the receiver. The fraction of power at the receiver can be hence described as
2 r ts ts r R 4 1 G P S