121
orbit of ∼500 km altitude make it possible to address several important properties of the particle populations in the inner magnetosphere. We review the on board trigger logic and study the acceptance of the AGILE instrument for particle detection. We find that the AGILE effective geometric factor (acceptance) isℜ≃ 50 cm2sr for particle energies in the range 10–100 MeV. Particle event reconstruction allows to
determine the particle pitch angle with the local magnetic field with good accuracy. We obtain the pitch angle distributions for both the AGILE “pointing” phase (July 2007 to October 2009) and the “spinning” phase (November 2009 to present). In spinning mode, the whole range (0–180 degrees) is accessible every 7 min. We find a pitch angle distribution of the “dumbbell” type with a prominent depression near 𝛼=90∘ which is typical of wave-particle resonant scattering and precipitation in the inner magnetosphere. Most importantly, we show that AGILE is not affected by solar particle precipitation events in the magnetosphere. The satellite trajectory intersects magnetic shells in a quite narrow range (1.0 ≲ L ≲ 1.2); AGILE then has a high exposure to a magnetospheric region potentially rich of interesting phenomena. The large particle acceptance in the 10–100 MeV range, the pitch angle determination capability, the L shell exposure, and the solar-free background make AGILE a unique instrument for measuring steady and transient particle events in the inner magnetosphere.
1. Introduction
The Astrorivelatore Gamma a Immagini LEggero (AGILE) mission is a space program of the Italian space agency (Agenzia Spaziale Italiana (ASI)) focused on gamma ray astrophysics [Tavani et al., 2009]. The AGILE satellite was launched in 2007 from the Indian base of Shriharikota in a quasi-equatorial orbit (inclination of 2.5∘, altitude 520–500 km). The mission is currently at its ninth year of successful operations in orbit. The AGILE scientific instrument and satellite are extensively described in Tavani et al. [2009].
The instrument for gamma ray detection in the energy range 30 MeV–30 GeV is based on state-of-the-art solid state detectors as described below. Gamma ray detection involving electron/positron pair creation within the silicon tracker of AGILE implies a proper instrument segmentation and trigger logic to distinguish between particle events and gamma ray events of astrophysical origin. AGILE has an efficient on board data processing devoted to the particle/photon discrimination; it is interesting to note that because the special topologies of charged particle events within the silicon tracker, a class of events that can be due to incoming charged particles need to be accepted and telemetered to the ground for additional processing. AGILE then accepts a significant number of “particle events” that are regularly transmitted to the ground in the standard scientific telemetry. For astrophysical applications, these particle events are considered a background in need of proper filtering. In this paper, we study the properties of this particle “background” with energy between 10 and 100 MeV that can be considered as an interesting signal for magnetospheric studies.
The AGILE mission characteristics are unique for particle detection in the lower magnetosphere. An opti-mized silicon tracker is capable of detailed particle tracking with a resolution of 40 μm; it is equipped with a calorimeter at the bottom and a segmented anticoincidence (AC) for veto purposes. Charged particle tracks can be then identified and topologically configured with good accuracy. As discussed below, the accep-tance to particle events is unprecedentedly large (currently ∼50 cm2sr) for space instruments of its type. magnetosphere
Correspondence to:
A. Argan,
Citation:
Argan, A., G. Piano, M. Tavani, and A. Trois (2016), AGILE as a particle detector: Magnetospheric measurements of 10–100 MeV electrons in L shells less than 1.2, J. Geophys. Res. Space Physics, 121, 3223–3239, doi:10.1002/2015JA022059.
Received 22 OCT 2015 Accepted 23 MAR 2016
Accepted article online 28 MAR 2016 Published online 23 APR 2016
©2016. American Geophysical Union. All Rights Reserved.
In particular, secondary protons from the so-called CRAND (cosmic ray albedo neutron decay) process are produced by primary neutrons𝛽 decays in the magnetosphere. This spectral behavior confirms the trend inferred from the previous observations of Alpha Magnetic Spectrometer (AMS)-Shuttle Flight [Alcaraz et al., 2000] and MARYA [Koldashov et al., 1995] and discussed in Longo et al. [2002] in regard to the charged parti-cle flux profile along the AGILE orbit. A similar relative hadrons-to-leptons ratio of the inner magnetosphere particles has been observed in the 10 keV–10 MeV energy range by several space experiments (including Solar Anomalous and Magnetospheric Particle EXplorer (SAMPEX) and CORONAS-F) during a 30 year period [Grigoryan et al., 2008]. The sub-ERB particle radiation is characterized by a flux modulation coherent with the solar cycle [Li et al., 2001; Malakhov et al., 2015]. Besides this long-term variation, a transient variability has been observed. This behavior is associated to acceleration mechanisms by resonant interactions in the iono-sphere/magnetosphere transition region (see Morioka et al. [2001] for a discussion of inner magnetosphere data; for a general theoretical treatment see also Summers et al. [1998]).
The paper is organized as follows. In section 2 we first summarize the main features of the instrument. In section 3 the AGILE on board data handling and trigger conditions are specified. In section 4 we present our ground pipeline for event classification. The main characteristics of the AGILE orbit and its particle environ-ment are presented in section 5. The AGILE particle acceptance, as derived from data, is discussed in section 6. Several cases of extended particle detections, with the determination of pitch angle distributions in both “pointing” and “spinning” satellite modes, are presented in section 7. The spinning mode of the AGILE satellite is the most interesting for the purpose of studying the average properties of the particle pitch angle distri-bution. Section 8 presents a discussion of our results and the conclusions. AppendixAprovides details of the Monte Carlo simulation of the particle event properties. AppendixBshows the particle response of AGILE to a major solar flare (7 March 2012).
2. The AGILE Satellite and Operations
The AGILE scientific instrument and satellite are extensively described in Tavani et al. [2009]. We summarize here their main characteristics. AGILE was successfully launched on 23 April 2007 from the Shriharikota base in India in a quasi-equatorial orbit. The main scientific goals of the instrument are the detection and imaging of gamma rays in the range 30 MeV–30 GeV simultaneously with the detection of hard X-rays (20–60 keV) and photons in the range 400 keV–200 MeV [Tavani et al., 2009]. An anticoincidence (AC) system surrounds the whole instrument for charged particle veto. The instrument core is a tower of three detectors of lateral area of about 40 × 40 cm2and height of about 40 cm. The surrounding AC system and mechanical structure set the
external dimensions of the instrument to approximately a 60 × 60 × 60 cm3cube. The instrument weight is
about 120 kg including the associated electronic units placed in the satellite body. An efficient data handling system completes the instrument. Figure 1 shows a schematic view of the instrument. Several papers describe the AGILE instrument detectors in detail [Perotti et al., 2006; Barbiellini et al., 2001; Prest et al., 2003; Feroci et al., 2007; Labanti et al., 2006].
The Gamma Ray Imaging Detector (GRID), operating in the energy range ∼30 MeV–30 GeV, is made up of three units: a silicon-tungsten tracker, a Cesium iodide minicalorimeter, and an anticoincidence system. The on board trigger logic (based on the combined use of AC, tracker, and minicalorimeter (MCAL) data) is designed to achieve an optimal gamma ray detection in the instrument field of view (FOV, ∼3 sr) and an efficient par-ticle background discrimination [Argan et al., 2004, 2008]. In addition, given the instrument characteristics, the on board data handling can also sustain storing and transmitting a relatively large of events classified as
Figure 1. Schematic view of the AGILE instrument [from Tavani et al., 2009]. The core of the instrument is provided by
the silicon tracker for gamma ray and particle detection in the 10 MeV–10 GeV energy range. On top of it, a very light hard X-ray detector (Super-Agile) is positioned. At the bottom of the Tracker, a Minicalorimeter of CsI(Tl) bars provides additional energy information on the Tracker events and an independent detection device for photons in the range 1–100 MeV. A segmented anticoincidence system made of 12 lateral panels and one top panel of plastic scintillators surrounds the whole detector.
“particles” for a later treatment on the ground. A hard X-ray imager (Super-AGILE) is placed on top of the gamma ray detector and is sensitive in the 18–60 keV band [Feroci et al., 2007]. The minicalorimeter, operating in the “burst mode”, is part of the GRID, but it also represents an independent instrument, which is able to detect transient events (Gamma Ray Burst (GRBs) and Terrestrial Gamma-ray Flash (TGFs)) in the 400 keV–100 MeV energy range with excellent timing capabilities.
The silicon tracker (ST) is the AGILE gamma ray imager, characterized by an on-axis total radiation length near 0.8 X0. It is based on gamma ray conversion into electron-positron pairs [Barbiellini et al., 2002; Prest et al., 2003]. The ST is made up of 12 trays, each consisting of two silicon layers for the X and Y coordinate tracking. Each layer is made up of 4 × 4 silicon tiles with an area of 9.5 × 9.5 cm2, microstrip pitch of 121𝜇m, and
410 μm thickness. The first 10 trays are equipped with a Tungsten layer of 245 μm (0.07 X0), positioned in
the bottom part of the tray, to enhance the pair conversion probability. Two more trays are inserted at the bottom of the tracker without the Tungsten layers, in order to satisfy the onboard trigger logic, which requires a signal from at least three (contiguous) planes. The analog read out of the silicon microstrips leads to an unprecedented tracking accuracy. The ST on board trigger logic has been implemented for a proper rejection of the particle/albedo photon background and a preliminary on board reconstruction of the event track. Super-AGILE is a compact hard X-ray imager of AGILE [Feroci et al., 2007], based on a coded-mask system consisting of a silicon detector plane and a thin tungsten mask positioned 14 cm above it. The minicalorimeter (MCAL), located below the ST, is characterized by a (on-axis) radiation length of 1.5 X0. It consists of 30 Caesium
Iodide (CsI(Tl)) bars arranged in two planes [Labanti et al., 2006, 2009]. The AC system surrounds the top and lateral sides of the AGILE detectors and is aimed at an efficient detection of charged particles [Perotti et al., 2006]. The AC system is made up of segmented plastic scintillators (three units for each lateral face, each 0.6 cm thick, and a top layer 0.5 cm thick) whose signals are read by photomultipliers laterally placed.
3. On Board Data Handling
The onboard data handling (DH) provides efficient data processing for both gamma rays and particles [Argan et al., 2004, 2008]. The AGILE-GRID trigger logic, based on different stages of event reconstruction, leads to
Figure 2. Typical S events in the AGILE tracker. They are interpreted as charged particles (mostly electrons) with lateral
incidence from below. Between the legends of each panel a schematic view of the AC elements is shown (a square indicates a hit element associated to the track). The lower part of each panel shows theXYandZYviews of a track.Xe Z axes are orthogonal to the AGILE boresight axis (Y). For bothXYandZYprojections of each track we have information about number of hit tracker planes (PLANES_X, PLANES_Z), number of hit silicon microstrips (STRIP_X, STRIP_Z), number of triggered readout Application Specific Integrated Circuit (ASICs) (TA1_X, TA1_Z), number of hit MCAL elements (CALO_X, CALO_Y), and values of the R parameter (R_X, R_Z).
a preliminary tracking and event identification. These onboard algorithms are characterized by a very fast response, with a total dead time for single event acquisition≲200 μs. The AGILE-GRID time tagging accuracy is ∼2 μs. The onboard processing generally reduces the particle and albedo photon background by a factor of ∼102. The rate of particle background acquisition on board and transmitted to the ground is then several
events per second. Detection of charged particles involving tracker events is in the kinetic energy range from a few MeV to higher energies. As we will discuss below, this particle flux in the AGILE orbit is dominated by elec-trons and posielec-trons in the range 10–100 MeV. The proton/ion contributions in this energy range are estimated to be about 10% of the total.
4. Data Processing and Event Classification
The AGILE-GRID on board trigger is optimized for detection of gamma rays in the energy range 30 MeV–30 GeV. The off-line ground processing of the GRID is aimed at further reduce the particle and albedo photon background rate. However, as outlined in this section, both the special data selection adopted on board and the AGILE telemetry allow to store first on board and then transmit to the ground a considerable number of particle events characterized by a lateral incidence of charged particles. An important constraint for track selection in the AGILE-GRID is the minimal requirement of particle hits in at least three out of four contiguous planes (“3-out-of-4” trigger condition). This requirement de facto selects charged particles with minimal energy of about 3–5 MeV depending on incidence.
The event classification of the GRID events is as follows.
1. G events. Tracker events compatible with gamma rays of incidence in the nominal instrument FOV (with or without lateral AC hits).
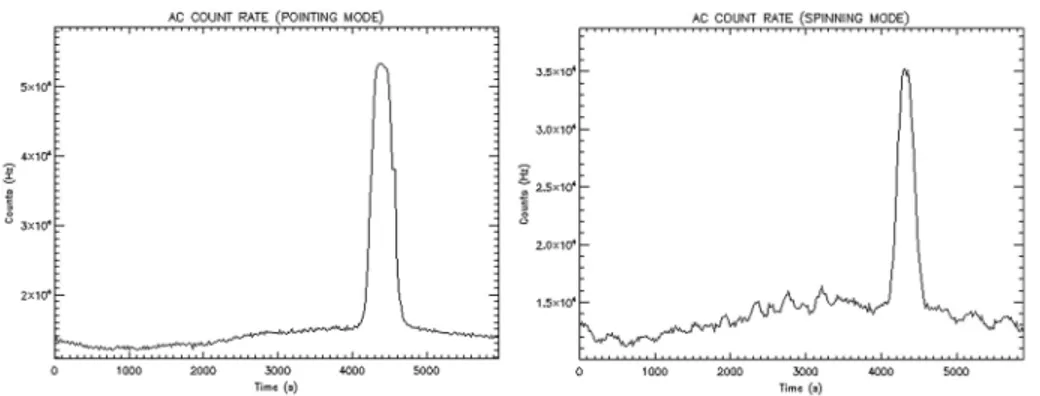
Figure 3. AGILE AC particle count rate as a function of time for typical orbits. (left) Data obtained in pointing mode.
(right) Data in spinning mode. Count rate measurements are obtained by integrating top and lateral AC panels. The time origin corresponds to the satellite passage over the ground station in Malindi (Kenya). In both panels, the sharp peak in the count rate (4100 s≲ t ≲4700 s) is related to the SAA.
2. P events. Tracker events that are not recognized as gamma rays and are classified as particles by the ground event reconstruction pipeline.
3. S events. A subclass of “P” events, characterized by (1) a single hit of a lateral AC panel; (2) no hits in the last tracker plane; (3) no associated hits in the MCAL; (4) a ratio R of the number of hits in the tracker divided by the number of hit tracker planes constrained by the condition R< 1.3; and (5) contiguity between the hit AC panel and the reconstructed track. Points (2) and (3) prevent from considering bottom-incoming secondary particles from electromagnetic showers produced in the spacecraft. Primary bottom-incoming particles, mostly electrons and positrons, when interacting with the dense material of the spacecraft, can generate showers by recursive physical processes that later propagate into the AGILE-GRID. In this case AGILE would detect a strong signal from the MCAL, with an associated bottom-incoming event in the ST, emerging from the last plane. Our conditions have been conceived to reject these secondary events, even if they reduce the angular acceptance for “S” events related to the bottom side of the instrument (𝜃 ∼180∘). Furthermore, point (4) is responsible for a strong track selection, rejecting events with irregular track topology, and reducing the contamination of𝛾 ray events (for typical events, gamma ray photons have R=2, and ideal single tracks have R = 1, see Figure 2). This condition allows the detection of primary charged particle events and increases the rejection of multitrack secondary particles.
The standard AGILE event reconstruction strategy is based on a Kalman filter algorithm that reconstructs tracks starting from the top of the AGILE-GRID. This approach is based on the primary interest in photon events impinging on the instruments from the top of the GRID. This strategy works well for photon events of the
Figure 4. Strength of the geomagnetic field (absolute value) as function of time for a typical AGILE orbit in pointing
Figure 5. Characterization of the physical properties of the AGILE orbit for a typical 1 day interval. (top) Magnetic field
strength values from the International Geomagnetic Reference Field (IGRF) model (black curves) and from the AGILE magnetometers (red curves). (middle) Values of the magnetic L shell. (bottom) Geomagnetic field inclination angle (“geomagnetic dip angle”).
“G” class. However, for particle events of the P class, the majority of events passing the selection conditions are impinging on the instrument from the bottom or lateral sides of the GRID.
Thus, for general P events we are not able to disentangle between top-incoming and bottom-incoming events, and the standard event reconstruction produces a𝜃 distribution with angles between 0 and 90∘. Nevertheless, for the S event subclass—characterized by a most regular track topology and one single triggered AC panel (see Figure 2)—we are able to distinguish the top-incoming from the bottom-incoming particles (by simply combining the information about the track inclination and the adjacent hit AC panel). For the S class events, we can use a reverted bottom-up Kalman algorithm reconstructing tracks from the bottom of the tracker. Based on this special approach to the GRID event reconstruction, we are able to properly reconstruct the incoming direction for both bottom-incoming and top-incoming charged particle events.
5. The AGILE Orbit and Its Particle Environment
The AGILE orbit is interesting from several points of view. The satellite orbits the Earth with a quasi-circular orbit of current average altitude near 500 km with small eccentricity. The orbital inclination is i=2.7∘ and is ideal for its relatively low-particle background. The AGILE orbit, being quasi-equatorial, has many virtues and peculiarities. It is characterized by
1. An optimal low background of charged particles with a small modulation throughout the orbit—if we exclude the SAA, where the particle rate is strongly enhanced (see Figure 3).
2. A relatively small orbital phase interval affected by the SAA (see Figure 3).
3. A moderate modulation of the local magnetic field in the range 0.2–0.32 G (see Figures 4 and 5). 4. A narrow range of magnetic L shells, with 1.0≲L≲1.2 (see Figure 6).
The prominent magnetic characteristics of the AGILE orbit are reported in Figure 5. As shown in Figure 5 (top), the onboard measurements of the magnetic field intensity is fully consistent with the theoretical expectations (IGRF model) along the satellite orbit. The satellite explores the very inner quasi-equatorial magnetosphere, with a limited range of variability of the observed geomagnetic L shells (1.0 ≲ L ≲ 1.2, Figure 5 (middle)) and geomagnetic dip angle (Figure 5 (bottom)).
The quasi-equatorial orbit near 500 km of altitude ensures an ideal particle background for both gamma ray and particle studies. It is quite stable and not subject to modifications induced by external factors (such as
Figure 6. (top) Exposure time map of the geomagnetic L shells monitored by AGILE. The color bar indicates the seconds
during which AGILE was in a given L shell during its orbital motion. (bottom) L shell histogram; seconds of observations for a given L shell. The observation time for both the plots is 14 April to 5 May 2015 (orbits 41220–41520).
solar activity and flares); furthermore, the particle background increase at the SAA is limited to a small portion of the orbit, contrary to other satellites with large orbital inclinations with respect to the equator. As we show in the AppendixB, the particle flux in the AGILE orbit is not affected by solar activity as checked, as an example, with the major solar flares with coronal mass ejection on 7 March 2012. This latter feature is important to ensure the stability of the particle overall flux in the orbit.
The direct exposure to magnetic L shells is also noticeable: Figure 6 shows that AGILE is directly exposed to low L shells connected to the ground with low and intermediate latitude terrestrial regions. These regions are known for the prominence of their atmospheric and lithospheric activities. AGILE monitors quasi-continuously
Figure 7. Definition of angles in the AGILE-GRID frame. (a)𝜃B: the angle between the local magnetic field and the AGILE boresight axis. (b)𝜃: the angle between the incoming particle track and the AGILE boresight axis (top incoming on-axis particles have𝜃 = 0). (c) Pitch angle: angle between the particle track and the local geomagnetic field.
the inner magnetospheric region with the largest particle acceptance ever obtained in space in this region. AGILE has then a unique exposure to a quite active Earth area.
6. Particle Acceptance
The effective acceptanceℜ of the AGILE-GRID for particle detection can be obtained from pointing and spin-ning data. Its value can be expressed in general asℜ = Aeff× Ω, where Aeffis the AGILE-GRID effective area and Ω is the angular acceptance in steradian. The first step is the calculation of incoming directions for the events. In this context it is useful to clearly define the angles𝜃B,𝜃 and 𝛼 (pitch angle), in the AGILE-GRID reference frame. Figure 7 reports the graphic definition of these angular quantities. Figure 8 shows the distribution of reconstructed directions (off-axis angle𝜃) for the S events for both pointing and spinning modes. These measured𝜃 distributions are of crucial importance and show the effective acceptance of the AGILE-GRID instrument for charged particles. The particle acceptance is therefore most effective in the range of angles 120∘< 𝜃 ≤ 180∘ peaking at 𝜃 ≃130∘. This result confirms the effectiveness of the AGILE gamma ray on board trigger logic that rejects most of the charged particles of incidence from above (i.e., for𝜃 below 70∘). A “tail” of particles survives the on board trigger logic as shown by the residual events in the range 0∘< 𝜃 <90∘ as shown in Figure 8. This latter residual component is ∼19% by number of the total. These results are fully confirmed by our simulations (see Appendix A2). In the following, we assume that the S event distribution shown in Figure 8 represents the effective acceptance of the AGILE-GRID to particles with outside incidence. Figure 9 provides a useful representation of the most effective geometries for particle detection by AGILE as a function of the local magnetic field geometry. It turns out that the most efficient particle detection by AGILE is from a 2 sr cone pointing in the opposite direction with respect to the instrument axis. In Figure 9 the
Figure 8. Distribution of reconstructed directions of S events withE⩽ 100MeV in the AGILE tracker as a function of off-axis angle𝜃(defined as angle with respect with the boresight of the gamma ray instrument. (left) Distribution for 1 week integration in pointing mode (orbits 1585–1683; 13–20 August 2007). (right) Distribution for 1 week integration in spinning mode (orbits 15000–15098; 21–28 March 2010).
Figure 9. Schematic representation of the favorable geometries for particle detection by the AGILE-GRID with respect to
the local magnetic field. The green arrows indicate the direction of precipitating particles, and the light blue arrows the counter-streaming particles. The AGILE-GRID acceptance cone is indicated in yellow. Four different geometries are relevant: (A) AGILE pointing against the precipitating particles in the upper magnetic hemisphere; B AGILE pointing coaligned with the direction of precipitating particles in the upper magnetic hemisphere; (C) AGILE pointing coaligned with the direction of precipitating particles in the lower magnetic hemisphere; and D AGILE pointing against the precipitating particles in the lower magnetic hemisphere.
AGILE-GRID acceptance cone is marked in yellow color. Figure 9 represents the four possible configurations for particle detection: (A) AGILE pointing against the precipitating particles in the upper magnetic hemisphere; (B) AGILE pointing coaligned with the direction of precipitating particles in the upper magnetic hemisphere; (C) AGILE pointing coaligned with the direction of precipitating particles in the lower magnetic hemi-sphere; (D) AGILE pointing against the precipitating particles in the lower magnetic hemisphere. The optimal geometries for the AGILE-GRID particle detection is for cases (B) and (C).
We can obtain the AGILE particle acceptance ℜ by comparing measured particle rates with theoretical charged particle flux along the AGILE orbit. The overall particle background flux (mainly electrons and positrons) between 10 and 100 MeV is assumed to be ∼6.6 × 10⁻²particles s−1cm−2sr−1. This estimation
is based on AMS-Shuttle Flight [Alcaraz et al., 2000] and MARYA data [Koldashov et al., 1995] (see the discus-sion about the theoretical AGILE particle background calculation in Longo et al. [2002]). These results have been recently confirmed by the PAMELA and ARINA observations [Adriani et al., 2009, 2014, 2015]. We then calculated the AGILE acceptance (10 MeV⩽ E ⩽ 100 MeV), both for P and S events, by simply dividing the corresponding measured rates by the expected flux:
ℜ =measured rate
incoming flux . (1)
For P events, the mean rate for 1 week integration in pointing (orbits 1585–1683; 13–20 August 2007) is ∼2.38 particles/s, corresponding to a particle acceptance of ℜ≈36.0 cm2 sr; the mean rate for 1 week integration in spinning (orbits 15000–15098; 21–28 March 2010) is ∼2.43 particles/s, which gives an accep-tance ofℜ ≈ 36.8 cm2sr. For S events, the mean rate for 1 week integration in pointing (orbits 1585–1683;
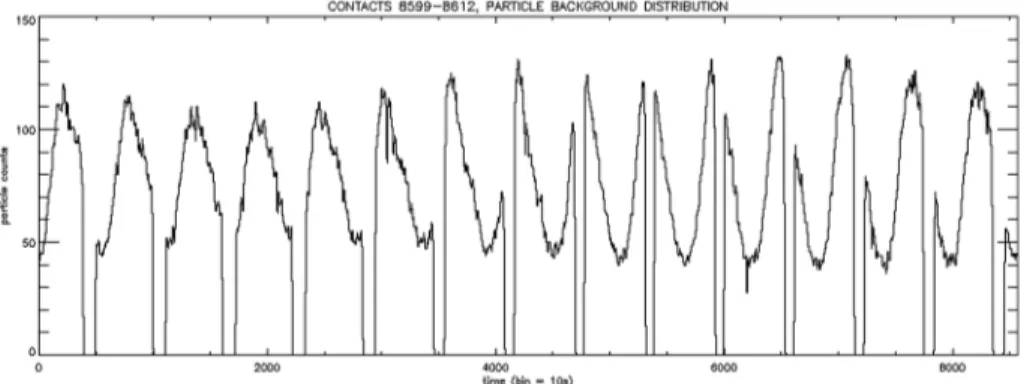
Figure 10. A 1 day light curve of particle event counts (smoothed data) detected by the AGILE-GRID for the orbits
8599–8612 in pointing mode. Gaps in the data stream are due to nonacquisition during South Atlantic anomaly passages.
(left) Distribution of𝜃B, the angle between the AGILE-GRID axis and the local magnetic field. (right) Distribution of the particle pitch angle for S events with reconstructed energyE⩽ 100MeV.
13–20 August 2007) is ∼ 1.8 × 10⁻²particles/s, corresponding to a particle acceptance ofℜ ≈ 0.27 cm2sr;
the mean rate for 1 week integration in spinning (orbits 15000–15098; 21–28 March 2010) is ∼1.7 × 10⁻²particles/s, which gives an acceptance ofℜ ≈ 0.25 cm2sr. Thus, we can conclude that the mean values
of the AGILE particle effective acceptance during the period July 2007–June 2014 isℜP ≈ (36 ± 7) cm2sr
andℜS≈ (0.26 ± 0.05) cm2sr for P and S events, respectively. We calculated that the numerical values of the
acceptance are characterized by a 20% relative uncertainty, by propagating the corresponding errors related to the expected particle flux and the measured rates.
In July 2014, AGILE entered in a new data-taking configuration based on a spinning mode observation with the onboard albedo filtering disabled. The application of the “albedo filter” logic rejected on board all events with reconstructed directions within 70∘ from the Earth center. In the new configuration AGILE has the albedo filtering disabled and therefore is detecting an enhanced particle rate: for P events, the mean rate has a typical value of ∼3.3 particles/s, corresponding to a particle acceptance ofℜ ≈ (51 ± 10) cm2sr. As discussed below,
this particle acceptanceℜ turns out to be the largest among space instruments currently capable of studying particle magnetospheric events.
Figure 10 shows a typical 1 day light curve of AGILE-GRID particle events in pointing mode. The count rate is modulated across the orbit because of particle acceptance and background variations and is subject to changes due to orbital precession. The particle light curve shows time-dependent peaks and minima that sweep across the orbital phase with a pattern caused by the dependence of the GRID particle acceptance as a function of the local magnetic field geometry with respect to the instrument configuration.
7. Particle Detection: Results
7.1. Pointing ModeFigures 11 and 12 show the𝜃Band particle pitch angle distributions for S events for two typical pointings of the AGILE satellite during the period July 2007–October 2009. Given the quasi-fixed value and geometry of
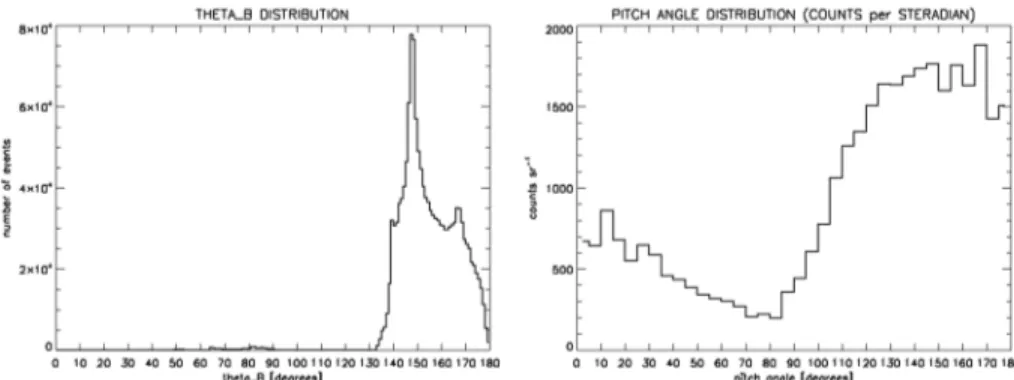
Figure 12. Distributions for the AGILE orbits 2320–2420, 4–11 October 2007 (pointing mode data taking). (left)
distribution of𝜃B, the angle between the AGILE-GRID axis and the local magnetic field. (right) Distribution of the particle pitch angle for S events with reconstructed energyE⩽ 100MeV.
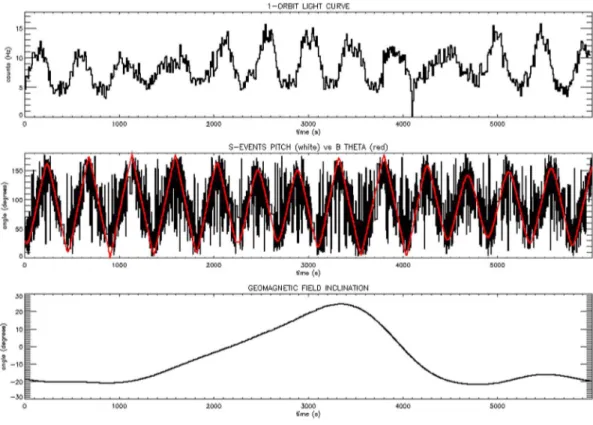
Figure 13. Characterization of relevant physical properties for a typical AGILE orbit (36320) in spinning mode.
(top) Particle count rate light curve as a function of time. The 7 min modulation is evident. (middle) Evolution of the particle pitch angles (black curves) and𝜃B(red curves) as a function of time. The temporal evolution of the pitch angle and𝜃Bis fully consistent with the angular distributions observed in pointing mode (Figures 11 and 12). (bottom) Geomagnetic field inclination angle (geomagnetic dip angle).Considering that most of the observed particles are precipitating (see Figures 14 and 15), in the southern magnetic hemisphere (negative magnetic dip angle) the maximum count rate occurs when𝜃Bis close to∼180∘(configuration C in Figure 9) and the minimum is observed when𝜃Bis close to∼0∘(configuration D in Figure 9). On the other hand, in the northern magnetic hemisphere (positive magnetic dip angle) the maximum count rate occurs when𝜃Bis close to∼0∘(configuration B in Figure 9) and the minimum is observed when𝜃Bis close to∼180∘(configuration A in Figure 9).
the local magnetic field with respect with the AGILE-GRID axis, the resulting pitch angle distribution reflects the convolution of the instrument acceptance and local magnetic field directions. Figure 11 shows the distri-butions of the angle𝜃B(between the AGILE-GRID boresight axis and direction of the local magnetic field) and of the particle pitch angles for the pointing during the period 13–22 August 2007. Figure 12 refers to another pointing for the period 4–11 October 2007. In pointing mode, the range of pitch angles accessible by AGILE
Figure 14. Distributions for a typical 1 week integration in spinning mode (orbits 15000–15098; 21–28 March 2010).
(left) Distribution of𝜃B, the angle between the AGILE-GRID axis and the local magnetic field. (right) Distribution of the particle pitch angle for S events with reconstructed energyE⩽ 100MeV.
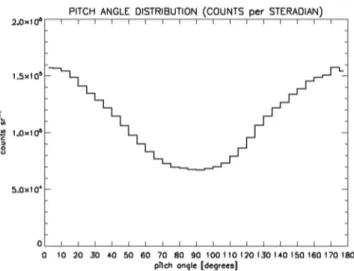
Figure 15. Pitch angle distributions of P events (reconstructed energyE⩽ 100MeV) detected by the AGILE-GRID for a typical 1 week integration in spinning mode (orbits 15000–15098; 21–28 March 2010). The resulting distribution shows an evident dumbbell profile, consistent with the corresponding S event distribution in Figure 14 (right).
is somewhat limited by the geometry and particle acceptance efficiency. As we show in the next section, in spinning mode AGILE can access to the whole pitch angle range within one satellite revolution (lasting 7 min).
7.2. Spinning Mode
AGILE in spinning mode operates with the satellites rotating every 7 min around the normal to the solar panel plane. Solar panels are kept with the surface perpendicular to the Sun direction with a good accuracy. The 7 min rotation introduces a modulation of the particle count signal as the satellite sweeps among the favorable and unfavorable geometries (A)–(D) of Figure 9. In spinning mode, the AGILE instrument can measure the particle magnetic pitch angle distribution in the whole range (0–180∘) with no limitations. Furthermore, as clearly indicated in Figure 9 the instrument has access to precipitating particles with large exposure. Figure 13 shows the particle count rate modulation, pitch angle and𝜃B, and geomagnetic inclination angle as a function of time for a typical orbit in spinning mode.
The AGILE capability of obtaining results for the complete range of pitch angles is demonstrated in Figure 14. In spinning mode the satellite is exposed to the largest possible range of the angle𝜃B; the resulting particle
pitch angle distribution covers the whole range.
Figure 15 shows the (solid angle) normalized pitch angle distribution in spinning mode for P events for a typical 1 week integration (21–28 March 2010), which is characterized by a “dumbbell ”shape, consistent with the analogous distribution for S events (Figure 14, right). This is a relevant result from the point of view of magnetospheric studies. It is obtained with a large-acceptance detector in very stable environmental conditions.
8. Discussion and Conclusions
The interest for measurements of the particle pitch angle distribution in the inner Earth magnetosphere at altitudes near 500 is high, given the paucity of measurements in this altitude range. In particular, measure-ments in the equatorial regions can be important for the possible role played by wave-particle resonance in low L magnetic shells.
AGILE is capable of measuring the properties of particle precipitation and the pitch angle distribution in the energy range of 10–100 MeV. In the AGILE quasi-equatorial LEO orbit the particle background in this energy range is dominated by electrons and positrons with a 10% proton contribution. The particle acceptance of AGILE is quite high in relative terms and is currently ∼5 cm2sr.
We studied the properties of the particle distributions during the two main operational phases of AGILE: the “pointing mode” (during the period mid-2007/end of 2009) and the “spinning mode” (since 2010). The pointing mode results depend on a restricted range of accessible magnetic field geometries with respect to the AGILE instrument axis. The resulting pitch angle distribution is interesting but limited in range.
plasma wave turbulence is active or not, respectively. A typical case is shown by Horne et al. [2003] present-ing the case of a significant change from pancake to dumbbell electron distributions in the range 0.1–2 MeV during the 9–15 October 1990 storm. However, it is known that dumbbell distributions can be detected in steady conditions. The inner belt measurements by Morioka et al. [2001] show that in the magnetic equator region with low L (L ∼ 2) the dumbbell distribution of 0.3–2.5 MeV electrons appears to be relatively stable, contrary to what measured at higher magnetic latitudes. This feature can be interpreted as caused by plasma wave-particle interaction acting in quasi-stable way in the magnetic equator region independently of external solar-driven storms. Recent measurements of 2–3 MeV electrons by a CubeSat detector in the inner magnetic regions with L ∼ 1.3 confirm this trend [Li et al., 2001].
Our measurements obtained in the magnetic equator for the even more internal L shell regions with L≲ 1.2 confirm that the electron pitch angle distribution in the energy range 10–100 MeV has a clearly dumbbell shape.
Plasma wave/particle interactions in the magnetic shells observed by AGILE suggest a terrestrial origin of these electromagnetic perturbations (e.g., wave generation in thunderstorms or by other terrestrial means). The AGILE satellite is therefore ideally equipped to monitor the very inner region magnetosphere at the magnetic equator. Moreover, the AGILE orbit is fully shielded by the external geomagnetic shells from direct solar activity (see Appendix B). Terrestrial phenomena inducing transient wave generation and particle precipitation changes can be efficiently detected by AGILE.
Appendix A: Charged Particle Simulations
We carried out two sets of Monte Carlo simulations of charged particles interacting with the AGILE instruments in order to analyze the detection efficiency and the tracker reconstruction capability. First, we simulated a plane front of electrons at selected energies hitting the AGILE-GRID from a given direction. This calculation is useful to test the reconstruct capability of S events. We subsequently made a simulation run with electrons of isotropic distribution to study the angular acceptance of the instrument for S events.
A1. Simulation of Monochromatic Electrons
We simulated 2 × 10⁵monochromatic electrons with E = 100 MeV, from a fixed incoming direction in the
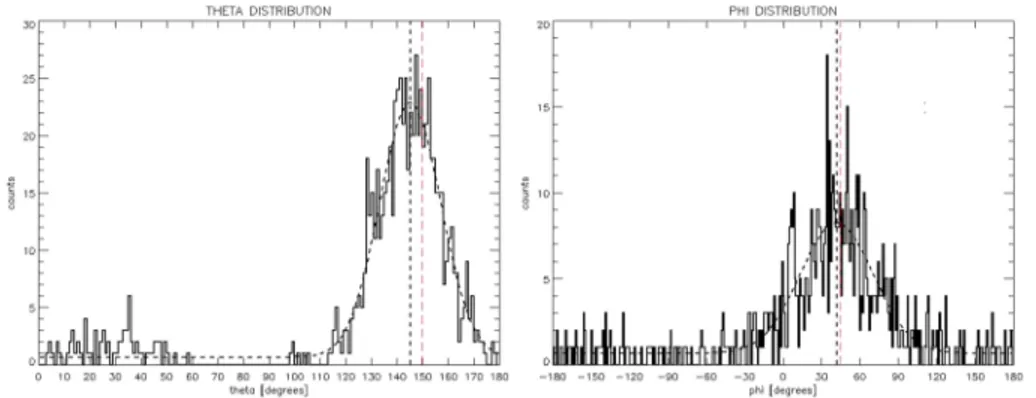
instrument reference frame,𝜃 = 150∘, 𝜙 = 45∘. We then applied to these bottom-incoming particles our selection and reconstruction strategy for the S events. The results of this procedure are shown in Figure A1. Between the simulated events only a small fraction has been selected as S particles (785, ∼0.4% of the total). Therefore, between the selected S events, 712 events (∼91% of the total) have been properly reconstructed as bottom-incoming particles, around the nominal incidence directions of the simulated particles. This test demonstrates that our strategy of event reconstruction is able to properly determine the incoming direction of the S events.
A2. Simulation of Electrons With an Isotropic Angular Distribution
We simulated ∼109 spatially isotropic electrons distributed with a hard power law spectrum (spectral
index = 1.6) between 10 and 100 MeV. The spectral distribution is based on theoretical models of the parti-cle background along the AGILE orbit [Longo et al., 2002]. Again, we applied to the simulated electrons the selection and reconstruction strategy for the S events. The angular distribution of the reconstructed events is shown in Figure A2. This distribution is consistent with the observed S events detected both in point-ing and spinnpoint-ing modes (see Figure 8). Most of the simulated events are reconstructed as bottom-incompoint-ing particles (∼83%), a result in agreement with the detected S event data (bottom-incoming particles ≈ 81%).
Figure A1. Distribution of the reconstructed incidence angles for the simulated S events. The red dashed lines indicate
the nominal incidence angles of the simulated events,𝜃 = 150∘,𝜙 = 45∘. (left)𝜃distribution, with a Gaussian fit (short dashed line), center:𝜃 = 145∘, full width at half maximum (FWHM) = 28∘. (right)𝜙distribution, with a Gaussian fit (short dashed line), center:𝜙 = 42∘, FWHM = 67∘.
Furthermore, the main angular component peaks at ∼130∘ both in the simulated and observed S events. This analysis confirms the characteristic shape of the AGILE-GRID acceptance for S events that we usually found for real data: AGILE—because of its onboard trigger and veto logic—turns out to be an efficient detector for bottom-incoming charged particles (in addition to top-incoming𝛾 rays).
Appendix B: AGILE and Solar Flares
The AGILE orbit is in the inner part of the Earth magnetosphere, crossing the geomagnetic L shells between 1.0 and 1.2 (see Figure 6). For this reason, we tested the direct effect of solar flaring activity on the particle rate monitored by AGILE. Figures B1 and B2 show the time evolution of particle, X-ray, and𝛾 ray fluxes during a very strong solar flare occurred on 7 March 2012. This intense flare was clearly detected in𝛾 rays above 100 MeV by Fermi-Large Area Telescope (LAT), and later associated to a bright spot in the Sun surface visible in extreme UV band. This event produced a major coronal mass ejection [Ajello et al., 2014] that was detected by several polar satellites (e.g., PAMELA, see below). The AGILE-GRID cannot directly detect𝛾 rays from the Sun because of solar panel’s constraints [Tavani et al., 2009] and could not observe the gamma ray flux from this solar flare above 100 MeV. However, the solar flare was promptly detected by the AGILE Anticoincidence system. Figure B1 shows data from the Geostationary Operational Environmental Satellite (GOES) satellite (top) dis-playing a bright flare in the X-ray band together with Fermi-Gamma-ray Burst Monitor (GBM) and LAT data (middle), and AGILE AC data (bottom). Figure B2 shows electromagnetic and proton fluxes of GOES as well as the AGILE data. The proton flux reached its maximum ∼1 day after the electromagnetic prompt emission.
Figure B1. Early phase of the 7 March 2012 solar flare detected by the satellites GOES, Fermi, and AGILE. (first panel) Soft
X-ray light curve measured by GOES detectors; (second panel) normalized hard X-ray count rate measured by the GBM detector on board of the Fermi satellite. Note that the solar flare enters in the instrument FOV about 2000 s after its onset determined by GOES detectors, as determined by the NaI detector (green curve). (third panel) Evolution of the gamma ray light curve measured by the Fermi-LAT (blue curve) and of the derived proton spectral index (red data). Plots adapted from Ajello et al. [2014]. (bottom) Counts light curve measured by the AGILE Anticoincidence (AC) system. The solar flare event enters in the AGILE-AC FOV approximately 2300 s after the onset determined by the GOES detectors.
Figure B2 (second panel) shows the AGILE count rate for one lateral AC panel exposed to the Sun. As the AGILE satellite started to be exposed to the solar flare, we detected a bright increase of the AC rate consistent with the X-ray flare (during the first ∼5 ks the AC panel was fully saturated by the strong signal rate). In this case, the AC count rate is determined not by charged particles but by mostly hard X-rays from the Sun inducing Compton scattering in the AC plastic scintillators.
Figure B2 (third panel) shows the AGILE-GRID particle rate detected in the tracker system: no enhanced parti-cle rate is observed during the solar flare (the observed variability is the ordinary count rate modulation along the AGILE orbit). On the other hand, the PAMELA satellite found a clear increase of the particle flux, coincident with the proton flux enhancement seen by the GOES detectors (Figure B2, bottom panel). It is important to note that the GOES satellites are in geostationary orbits (altitude ∼36000 km) and PAMELA has a polar orbit. Thus, both of the latter satellites orbit in the outer part of the magnetosphere, under the direct influence of
Figure B2. Late phase of the solar flare of 7 March 2012, detected by the satellites GOES, AGILE, and PAMELA. (first
panel) Soft X-ray and proton fluxes as detected by GOES detectors. Plot adapted from Ajello et al. [2014]. (second panel) Evolution of the count rate measured by the AGILE AC system (gaps are related to the SAA, during which the data acquisition in inhibited). (third panel) Counts light curve of the particle events measured by the AGILE-GRID (gaps are related to the SAA, during which the data acquisition is inhibited). (bottom panel) Particle flux evolution measured by the PAMELA satellite (courtesy of M. Martucci and P. Picozza).
the Sun. The particle flux detected by GOES and PAMELA is directly influenced by geomagnetic storms trig-gered by solar flares. Thus, the constant level of the AGILE-GRID particle rate clearly shows that the AGILE orbit is well shielded by the outer magnetosphere, without any measured variation of the particle rate triggered by direct solar activity.
References
Adriani, O., et al. (2009), Secondary electron and positron fluxes in the near-Earth space observed in the ARINA and PAMELA experiments, Bull. Russ. Acad. Sci. Phys., 73, 364–366, doi:10.3103/S1062873809030253.
Adriani, O., et al. (2014), The PAMELA mission: Heralding a new era in precision cosmic ray physics, Phys. Rep., 544, 323–370, doi:10.1016/j.physrep.2014.06.003.
Acknowledgments
Research partially supported by the ASI grants I/042/10/0 and I/028/12/0. The AGILE data are available at the ASI Science Data Center (ASDC) website: http://www.asdc.asi.it/mmia/index. php?mission=agilemmia. We thank the anonymous reviewers for their constructive comments and helpful suggestions on an earlier version of the manuscript. We thank M. Martucci and P. Picozza for providing data of the PAMELA satellite presented in AppendixB.
Cattaneo, P. W., et al. (2012), Characterization of a tagged𝛾-ray beam line at the DAΦNE beam test facility, Nucl. Instrum. Methods Phys. Res., Sect. A, 674, 55–66, doi:10.1016/j.nima.2012.01.049.
Cattaneo, P. W., and P. Rappoldi (2013), On-ground calibration of AGILE-GRID with a photon beam: Results and lessons for the future, Nucl. Phys. B Proc. Suppl., 239, 241–244, doi:10.1016/j.nuclphysbps.2013.05.036.
Cocco, V., F. Longo, and M. Tavani (2002), Simulation of the AGILE gamma-ray imaging detector performance: Part II, Nucl. Instrum. Methods Phys. Res., Sect. A, 486, 623–638, doi:10.1016/S0168-9002(01)02160-X.
Del Monte, E., et al. (2003), Radiation damage studies of XAA1.2 ASIC chip for the SuperAGILE experiment onboard AGILE, Proc. SPIE, 4851, 1029–1039, doi:10.1117/12.479579.
Feroci, M., et al. (2007), SuperAGILE: The hard X-ray imager for the AGILE space mission, Nucl. Instrum. Methods Phys. Res., Sect. A, 581, 728–754, doi:10.1016/j.nima.2007.07.147.
Giuliani, A., V. Cocco, S. Mereghetti, C. Pittori, and M. Tavani (2006), The AGILE on-board Kalman filter, Nucl. Instrum. Methods Phys. Res., Sect. A, 568, 692–699, doi:10.1016/j.nima.2006.05.275.
Grigoryan, O. R., M. I. Panasyuk, V. L. Petrov, V. N. Sheveleva, and A. N. Petrov (2008), Spectral characteristics of electron fluxes atL< 2under the Radiation Belts, Adv. Space Res., 42, 1523–1526, doi:10.1016/j.asr.2007.12.009.
Horne, R. B., N. P Meredith, R. M. Thorne, D. Heynderickx, R. H. A. Iles, and R. R. Anderson (2003), Evolution of energetic electron pitch angle distributions during storm time electron acceleration to megaelectronvolt energies, J. Geophys. Res., 108(A1), 1016, doi:10.1029/2001JA009165.
Koldashov, S. V., V. V. Mikhailov, and S. A. Voronov (1995), Electron and positron albedo spectra with energy more than 20 MeV, in Proceedings of the 24th International Cosmic Ray Conference, Rome, Italy, Aug. 28–8 Sept., vol. 4, edited by N. Iucci and E. Lamanna, pp. 993–996, Int. Union Pure Appl. Phys., Rome.
Labanti, C., et al. (2006), The mini-calorimeter of the AGILE satellite, Proc. SPIE, 6266, 62663Q, doi:10.1117/12.673294.
Labanti, C., M. Marisaldi, F. Fuschino, M. Galli, A. Argan, A. Bulgarelli, G. Di Cocco, F. Gianotti, M. Tavani, and M. Trifoglio (2009), Design and construction of the Mini-Calorimeter of the AGILE satellite, Nucl. Instrum. Methods Phys. Res., Sect. A, 598, 470–479, doi:10.1016/j.nima.2008.09.021.
Li, X., D. N. Baker, S. G. Kanekal, M. Looper, and M. Temerin (2001), Upper limit on the inner radiation belt MeV electron intensity, Geophys. Res. Lett., 28, 3827–3830, doi:10.1029/2001GL013586.
Li, X., D. N. Baker, S. G. Kanekal, M. Looper, and M. Temerin (2001), Long term measurements of radiation belts by SAMPEX and their variations, J. Geophys. Res., 120, 1215–1228, doi:10.1002/2014JA020777.
Longo, F., V. Cocco, and M. Tavani (2002), Simulation of the AGILE gamma-ray imaging detector performance: Part I, Nucl. Instrum. Methods Phys. Res., Sect. A, 486, 610–622, doi:10.1016/S0168-9002(01)02159-3.
Malakhov, V. V., et al. (2015), Time variations of proton flux in Earth inner radiation belt during 23/24 solar cycles based on the PAMELA and the ARINA data, J. Phys. Conf. Ser., 632, 012069, doi:10.1088/1742-6596/632/1/012069.
Maurin, D., F. Melot, and R. Taillet (2014), A database of charged cosmic rays, Astron. Astrophys., 569, A32, doi:10.1051/0004-6361/201321344.
Morioka, A., H. Misawa, Y. Miyoshi, H. Oya, M. Iizima, and T. Nagai (2001), Pitch angle distribution of relativistic electrons in the inner radiation belt and its relation to equatorial plasma wave turbulence phenomena, Geophys. Res. Lett., 28, 931–934, doi:10.1029/2000GL011886.
Perotti, F., M. Fiorini, S. Incorvaia, E. Mattaini, and E. Sant’Ambrogio (2006), The AGILE anticoincidence detector, Nucl. Instrum. Methods Phys. Res., Sect. A, 556, 228–236, doi:10.1016/j.nima.2005.10.016.
Prest, M., G. Barbiellini, G. Bordignon, G. Fedel, F. Liello, F. Longo, C. Pontoni, and E. Vallazza (2003), The AGILE silicon tracker: An innovative
𝛾-ray instrument for space, Nucl. Instrum. Methods Phys. Res., Sect. A, 501, 280–287, doi:10.1016/S0168-9002(02)02047-8.
Summers, D., R. M. Thorne, and F. Xiao (1998), Relativistic theory of wave-particle resonant diffusion with application to electron accelera-tion in the magnetosphere, J. Geophys. Res., 103, 20,487–20,500, doi:10.1029/98JA01740.
Tavani, M., et al. (2009), The AGILE mission, Astron. Astrophys., 502, 995–1013, doi:10.1051/0004-6361/200810527.
Xiao, F., Q. Zong, and L. Chen (2009), Pitch-angle distribution evolution of energetic electrons in the inner radiation belt and slot region during the 2003 Halloween storm, J. Geophys. Res., 114, A01215, doi:10.1029/2008JA013068.