UNIVERSITY OF CATANIA
FACULTY OF MEDICINE AND SURGERY
PRECLINICAL AND CLINICAL PHARMACOLOGY
Ph.D. - XXV CYCLE
Director of PhD Program: Prof. R. Bernardini
___________________________________________________________________________
Dr. Sanfilippo Filippo
________________________________________________
PAIN OUT INTERNATIONAL:
Treatment of postoperative pain in Catania’s
area. Patient’s perspective
- Observational Clinical Study –
________________________________________________
Ph. D. Thesis
Director:
Prof. R. Bernardini
Tutor:
Prof. A. Gullo
International Manager:
Dr. R. Zaslansky
_____________________________________________________ ACCADEMIC YEAR 2011 – 20122
1. INTRODUCTION
pag. 4
1.1 Postoperative Pain 1.2 The need for a change
2.
MATERIALS
&
METHOODS
pag.
7
2.1 Pain Out Project
2.2 Catania’s Hospitals network
2.3 Data organization, endpoints and statistical analysis
3. RESULTS
pag. 14
3.1 General Population 3.2 General Surgery
3.2.1 Thyroidectomy
3.3 Gynaecology
3.3.1 Hysterectomies and other uterine intervention (open abdominal surgery) 3.3.2 Caesarean Section
3.4 Orthopaedics
3.4.1 Hip and lower limb orthopaedic surgery
3.5 Urology
4. DISCUSSION
pag. 40
4.1 Evaluation of the scores of the overall population 4.2 Pharmacological considerations on the overall data
4.2.1 Overall pharmacological approach to postoperative pain 4.2.2 Patient Controlled Analgesia
4.2.3 Surgical wound infiltration 4.3 Limitations
4.4 Subgroup analysis
4.4.1 Remifentanil and worse outcome 4.4.2 Differences Among Hospitals
4.4.2a Public vs Private Italian Healthcare System (HIS) 4.4.2b Hospitals of the Public IHS
4.4.3 Opioid adjunct for spinal anaesthesia in Caesarean Section 4.4.4 Peripheral nerve block in hip and lower limb orthopaedic surgery 4.4.5 Future targets and analysis
5. CONCLUSION
pag. 57
6. ACKOWLEDGEMENTS
pag. 59
7. REFERENCES
pag. 60
4
1. INTRODUCTION
1.1 Postoperative pain
Post-operative pain (PP) is an inevitable consequence of surgery. About 234.2 million major surgical procedures are undertaken every year worldwide; more than 40 million patients undergo surgery every year in Europe (about 1 in 18 people) and about 75 million in US (1). Moreover, it is
likely that the improvement in early diagnosis and the advances in anaesthesiological and surgical technologies will largely contribute to increase the indications and thus the amount of procedures performed worldwide. Of course the surgical act is meant to provide benefits. Nevertheless, as results of the intervention itself and generally of the hospitalization process, patients are exposed not only to intraoperative risks, but to perioperative events as well, which may even cause death. Among the perioperative risk factors contributing to mortality and morbidity, PP is well recognized not only as affecting patient’s comfort and being a source of distress for families, but is also well known as an important contributor to the onset of metabolic, respiratory, cardiovascular and psychological alterations (2). Some physiological responses to acute pain and
stress are mediated by the neuroendocrine system activation and the increased sympathetic tone. As consequence, patients develop tachycardia, increased myocardial oxygen consumption, immunosuppression, hypercoagulability, persistent catabolism and many others metabolic alterations (3). Moreover pain causes functional limitations such as delayed ambulation, impaired
pulmonary mechanics and respiratory function (4). The surgical manoeuvres produce tissue and
nerve lesions and the mechanical insult triggers a series of local and systemic inflammatory responses. The magnitude and the duration of this stress response are related to the anatomical site and to the extension of damaged tissue, as well as to the pre-existing patient’s co-morbidities. By prolonging the stress response, pain can contribute to several of postoperative complications, such as myocardial infarction and pulmonary embolism. Consequently, the modulation of the stress response plays a pivotal role in the recovery process and efforts should be made in order to mitigate it.
Pain definitely worsens the extent and the length of the stress response after surgery and therefore it is not surprising that a poor PP management increases the incidence of complications
(5). Moreover, it does increase also the costs of care and can lead to disabling chronic pain (6-7).
Hence the importance of an adequate and efficient treatment of PP in order to significantly reduce the onset of complications and the consumption of resources (8)
Adequate analgesia has become an even more important outcome with the implementation of the Joint Commission on Accreditation of Healthcare Organizations (JCAHO) standards for pain management,effective since January 2001 (9) Recognition of pain as the fifth vital sign suggests that
its management must be assessed regularly duringtreatment and, when indicated, be addressed in dischargeplanning, using standardized, internally developed guidelines (10).
On the other side, notwithstanding the strength of this background and regardless the continuous improvement of pharmaceutical strategies and implementation of ad-hoc protocols, PP is still under-estimated and under-treated (11).
1.2 The need for a change
The impact of PP is very high for patients and their families as well as for healthcare professionals and the Healthcare Systems worldwide. Clinicians document (12) and patients
continue to fear PP (13). A recent U.S. survey found as many as 40% to 60% of patients
experience moderate, severe, or extreme pain (14-15). Another study of 10,008 patients reported the
incidence of severe pain as 5% in the recovery room and 5.3% 24 hours postoperatively (16).
According to the data provided by the IASP (International Association for Study on Pain) more than 50% of patients who undergo a surgical operation complain from moderate to severe level of pain (11)
. About 40% of patients in the United States report inadequate pain relief despite
receiving treatment (17) and regional, national and Europe-wide surveys have already documented
that hospitalized patients receive a suboptimal treatment for pain (18-19).
Although a progressive improvement in staff’s knowledge and attitudes, regardless the increasing pharmaceutical strategies and the implementation of ad-hoc protocols, and even if routine assessment of pain is becoming a worldwide accepted standard (principally in the United States
(20) and in some Western European countries (18, 21)), endpoints such as PP incidence and intensity
have not shown to move forward.
The attention offered by the Health Systems towards this issue seems to be variable and generally suboptimal. Even if routine pain documentation is now considered essential for improving quality of pain management and it is recommended by clinical practice guidelines as the ‘5th vital sign’ and used as a quality indicator (9, 22-23), it does not always well correlate with reduction of pain
scores (24-25). This findings support the contention that routine pain assessment alone is not a
6
Therefore, the need to sharpen awareness among Trusts and healthcare professionals is imminent, altogether with the provision of new approaches and protocols, tailored on the specific surgical intervention as well as on patient’s characteristics. So, there is a need for a different strategy aiming to establish the best therapeutic alternatives and then making those options easily accessible, e.g. through web based diffusion. Several projects are now creating registries, providing data about national or international management of PP (26). Transferring data from the
clinical practice to a web-based database (thereby forming a medical registry) may help providing performance feedbacks. Hopefully, a worldwide registry may then favour a continuous upgrading in the management of PP (27).
2. MATERIALS & METHODS
2.1 Pain Out ProjectIn order to trigger attention on PP and improve patients’ postoperative outcome, PAIN-OUT PROJECT - an observational study - has been ideated and funded by the European Union’s 7th
Framework Program (http://www.pain-out.eu). Its aim is to provide clinicians with evidence-based approaches for the management of pain after surgery (24, 26). The project is thought to
gradually develop into the following three modules:
1. the creation of a Registry for Feedback and Benchmarking, 2. the development of a Clinical Decision Support System,
3. the share of an Electronic Knowledge Library, a friendly-user and easily accessible tool at doctor’s hand and patient’s bedside.
As soon as the targets of the PAIN-OUT project will be fully accomplished, the impact on the patients’ outcome could be outstanding. Ideally, treatment choices will be empowered and disparities in the treatment of PP all over the world will decrease. Pain Out data could also allow the comparison of the quality of PP treatment among different countries and Healthcare Systems as well as an evaluation of the impact of intra-operative techniques and their effect on PP.
The first step of POP has been the development of a preliminary pilot study (24), held between
May and October 2008. Fourteen collaborating centres in 13 countries participated and after the analysis of the results, showing the feasibility of international data collection, the official project was inaugurated in the first trimester 2009, with minor changes to the questionnaire (see below) that have been developed in order to make some question clearer (January 2011).
The creation of a database (first module of Pain Out Project) is based on the development of a web-based structure allowing real-time data collection and insertion from the different participating centres. A peculiarity of this project is the shift of the endpoints from clinician’s assessment to patient’s viewpoint, assessed through an anonymous questionnaire.
For the purpose of the study, data collection consists of the compilation of two separate charts. The first one, entirely filled by the investigator, is shown in Appendix 1 and contains different sections: screening criteria, patient’s demographics and medical history, the surgical procedure performed, information about the pre-medication, the anaesthesia technique, the pain treatment
8
The second chart (see Appendix 2, in its second and last version) is the anonymous questionnaire, voluntarily completed by the patient on postoperative day 1 and at least 6 hours after return in the ward. Its initial version was updated with minor changes in January 2011 and contains questions exploring the impact of postoperative pain from different points of view and patients are asked to answer giving a score from 0 to 10 to most of the questions (quantitative scale), or simply responding “YES” or “NOT” (qualitative assessment) to the remaining ones. The questionnaire used by the Pain Out study in order to assess outcomes of adult patients related to post-operative pain treatment is based on the recently revised APS's (American Pain Society's) POQ-R (Patient Outcomes Questionnaire-Revised) (28).
Initially, PAIN OUT was conceived only for data collection after general surgery and orthopaedics procedures, with selected European centres involved. However, due to the growing interest by other qualified centres and in order to empower the database, a second non EU-funded branch – so called PAIN OUT INTERNATIONAL – was “activated” for those worldwide centres willing to participate, while the original branch is known as PAIN OUT EUROPE. Pain Out International does not have a formal date for its beginning but generally it started in the first half of 2010. The inclusion criteria of the original branch are shown in Table 1. The only difference in the inclusion criteria between the two PAIN OUT stems regards the surgical specialties involved, being no restriction applied for the non-funded PAIN OUT INTERNATIONAL. Nowadays, there are 53 centres collecting data within the PAIN OUT INTERNATIONAL and Catania belongs to this non EU-funded branch of the study. There is no target number for the ongoing worldwide data collection, which will continue throughout.
Orthopaedic or general surgery Age >18 years
Ability to provide data on post-operative day 1, at least six hours after return in the ward. Willingness to participate in the survey
Ability to fill in a questionnaire in the local language, unaided
Table 1. Inclusion criteria for PAIN OT EUROPE.
2.2 Catania’s Hospitals network
Catania was one of the first centres to join the POI branch of the study, by starting the data collection on the 1st April 2010 with the aim to initiate a long and durative international
disparities in the treatment within the territory and for the possibility to determine improvements in the local pharmacological protocol by providing feedbacks.
We preventively planned the first data analysis after 2 years with the data collected till the 31st
March 2012, although still continuing the collection of data afterwards. By involving different Trusts in Catania’s area we aimed to achieve the recruitment of a fairly high number of cases. In particular we ideally targeted to reach 3000-5000 cases within two years.
After approval of the local Ethic Committee, we started a series of meetings with the aim to provide detailed explanation of the Standard Operating Procedures (SOPs) and to discuss the possible doubts on the way to collect and then correctly insert the data into the database. In those meetings we involved the trainees/residents of the School of Anaesthesia and Intensive Care of the University of Catania, which were in charge of the data collection, and the local supervisors (senior anaesthetists) designated for each one of the Hospitals involved. The principal investigator and his main collaborators were always telephonically contactable for enquiries and uncertainty regarding the data. In turn, a strict contact and e-mail exchange was and still is maintained with the International Manager for any further doubt. The residents’ rotation was organized in order to cover the participating Hospitals as much as possible.
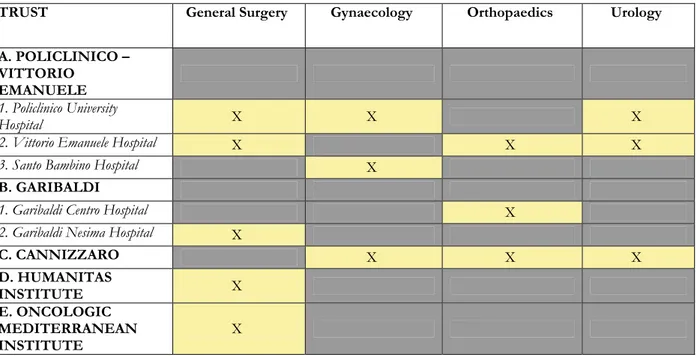
We chose to collect data for procedures involving general surgery, orthopaedics, gynaecology and urology. Five Trusts of the city (for a total of 8 Hospitals) eagerly agreed to be involved in the study. The distribution of the participating surgical units among the different Trusts/Hospitals is shown in Table 2. Three of the Trusts involved (Policlinico-Vittorio Emanuele, Garibaldi and Cannizzaro) belong to the Italian National Health System; on the other side, Oncologic Mediterranean Institute (OMI) and Humanitas Institute are both part of the “private” Italian
Healthcare System (IHS - however often providing care in a regimen of financial
convention/agreement with the public IHS).
In case of a decreasing number of trainees available for data collection, the responsibility for their allocation was held by the Principal Investigator and Director of the School of Anaesthesia and Intensive Care himself. We preventively accepted the possibility of suppression of some of the participating Units in the data collection as the number of residents is progressively falling due to decreasing economic resources.
10
TRUST General Surgery Gynaecology Orthopaedics Urology A. POLICLINICO –
VITTORIO EMANUELE
1. Policlinico University
Hospital X X X
2. Vittorio Emanuele Hospital X X X
3. Santo Bambino Hospital X
B. GARIBALDI
1. Garibaldi Centro Hospital X
2. Garibaldi Nesima Hospital X
C. CANNIZZARO X X X D. HUMANITAS INSTITUTE X E. ONCOLOGIC MEDITERRANEAN INSTITUTE X
Table 2. Scheme of the five Trusts (A-E) involved in the collection of data in Catania. In two of these Trusts (Policlinico-Vittorio Emanuele and Garibaldi) more than one hospital contributed to data collection. Each Trust participated by covering one or more surgical specialties as shown in columns.
2.3 Data organization, endpoints and statistical analysis
From a local perspective, the main aim of this observational study is to perform a descriptive analysis of PP treatment in our territory. We realized that a general description of the entire population may have had few interesting conclusions as too many different factors make the population highly inhomogeneous. For this reason, we preventively agreed to focus more deeply on few subgroups selected according to the intervention performed. However, the number of Hospitals involved, the different surgical specialties, the high variability in patients’ demographics made difficult to preliminarily set any surgical sub-populations amenable of analysis.
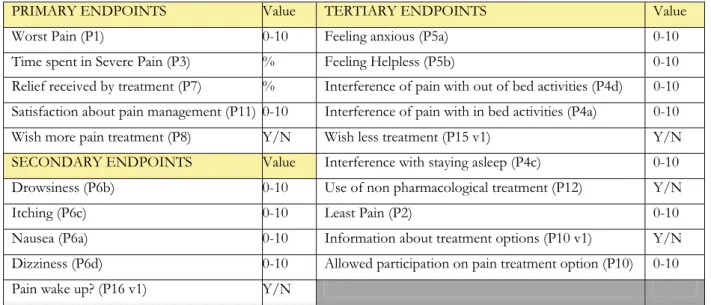
For this reason we subsequently screened our data, both for single surgical interventions (i.e. thyroidectomy or appendicectomy) and for typology of intervention, such as surgery involving a particular anatomical region (i.e. lower limbs surgery or abdominal laparotomy). We preventively chose to analyse only those sub-population that reached at least 100 cases recorded in the database. In case of more than one Hospital contributing to this amount of cases, we deliberately decided to consider valid only the contribution of those centres collecting at least 25 cases. Of course, we set as endpoints the results of some questions of the anonymous questionnaire (Appendix 2). We preventively divided our endpoints in primary, secondary and tertiary as shown in Table n 3.The endpoints were calculated for the entire population and thus for each subgroup. When analyzing subgroups of patients we generally restricted the analysis to the primary and
secondary endpoints. Only in the analysis comparing different hospitals we included the calculation of the score of three tertiary endpoints (use of non pharmacological treatment, information received about PP treatment options and allowance to participate in the decision among these options). We excluded from analysis those patients that responded to less than two primary endpoints of the questionnaire and those ones for which there was no entry regarding both the intra-operative technique and the postoperative drugs given. We found some cases with reported worst pain score lower than the minimum pain and we obviated to this incongruity by inverting those values. Demographic parameters were only considered if thought to be meaningful. Unfortunately, the year of birth is somewhat imprecise as the project is continuing along the years and we do not have at the present time the resources and time to find out the exact age of each patient. Moreover, data were not inserted on the same day of collection, so the calculation of the age would be still inaccurate even if considering it in view of the day when data were inserted on the web-mask. We did not consider patient’s weight, because unlikely to influence PP treatment in small subgroup analysis and because the accuracy of patient’s weight in the preoperative period could be inaccurate as well.
PRIMARY ENDPOINTS Value TERTIARY ENDPOINTS Value
Worst Pain (P1) 0-10 Feeling anxious (P5a) 0-10
Time spent in Severe Pain (P3) % Feeling Helpless (P5b) 0-10
Relief received by treatment (P7) % Interference of pain with out of bed activities (P4d) 0-10
Satisfaction about pain management (P11) 0-10 Interference of pain with in bed activities (P4a) 0-10
Wish more pain treatment (P8) Y/N Wish less treatment (P15 v1) Y/N
SECONDARY ENDPOINTS Value Interference with staying asleep (P4c) 0-10
Drowsiness (P6b) 0-10 Use of non pharmacological treatment (P12) Y/N
Itching (P6c) 0-10 Least Pain (P2) 0-10
Nausea (P6a) 0-10 Information about treatment options (P10 v1) Y/N
Dizziness (P6d) 0-10 Allowed participation on pain treatment option (P10) 0-10
Pain wake up? (P16 v1) Y/N
Table 3. Questions considered as possible endpoints of the analysis. In brackets is shown the number of each question as per questionnaire (second and last version, see appendix 2). If specified “v1” the number of the question refers to the first version of the questionnaire (before the update in January 2011) and does not exist anymore in the last version.
The secondary endpoint – Did pain wake you up? – was changed when the questionnaire was updated to the last “version”. In particular the variable was changed from a qualitative (Y/N) into a quantitative question (interference of pain on sleep activity, 0/10). This does not allow merging the answers assessing this issue. As most of the cases collected in our centres refer to the “version 1” of the questionnaire, we still preferred to address the impact of pain on the capacity to stay asleep overnight by using the first version and the qualitative measurement – Did pain
12
For the purpose of our analysis we preventively considered the following scenarios:
1. comparison among the different centres (for the same surgical procedure and/or
typology of intervention);
2. comparison between the Hospitals belonging to the Italian public and the private IHS
(general surgery only potentially allowing this analysis);
3. comparison of the influences on endpoints between different intra-operative and/or
postoperative drugs used and combination of them;
With regards to the latter point, one of the main aims of this project is to provide a descriptive analysis about the drugs and techniques used for postoperative pain relief in the territory of Catania. Whenever the sample size allowed it, we considered a comparison of the outcomes within subgroups of a population:
a. assessing the impact of wound infiltration with a local anaesthetic;
b. estimating the differences associated to different intraoperative techniques and patient’s
outcome;
c. evaluating if any post-operative treatment is associated with better results [Non Steroidal
Anti-Inflammatory drugs (NSAIDs) only; Opioid, full and/or partial, only; techniques of loco-regional anaesthesia; combination of the previous]
With regards to the intraoperative period, the study design does not allow to discover the timing and purpose of drug administration. This somewhat complicates the analysis especially for fentanyl and morphine, as it remains unclear if those drugs were used for the induction/maintenance of anaesthesia and/or to prevent postoperative pain before recovery. We reasonably assumed that fentanyl has been used for the induction/maintenance of anaesthesia, while morphine has its main role as drug given to prevent postoperative pain after the emergence of anaesthesia. This assumption has been repeatedly confirmed with the centres involved in the study. However, it cannot be denied that few cases may have followed a different approach. Morphine has always been confirmed by the local supervisors (senior anaesthetist) as not used for induction of anaesthesia in all the centres participating to the study. Nevertheless, the same centres confirmed that in some cases a small dose of fentanyl bolus could have been used before the emergence of anaesthesia with the aim to provide postoperative pain relief.
In Catania’s Hospitals network, the system of Post-Anaesthesia Care Unit is not well developed. For this reason, we decided to merge the data recorded in the period spent in the RRA with those acquired from the time spent in the ward.
For those drugs available in per os, intramuscular (IM) and intravenous (IV) administration, we intentionally did not consider the route of administration, focusing only on the qualitative analysis according to the administration of each drug (1=given; 0=not given; empty data not available). Moreover, the amount of drugs given was not considered because the timing from the end of the surgical procedure would have certainly been different among patients and difficult to assess with precision in our analysis. We considered in our analysis three main classes of drugs: Opioids, Non Steroidal Anti-Inflammatory drugs (NSAIDs, including paracetamol) and Local anaesthetics. A screening log is not part of Pain Out methods. The data screening and reorganization with the subsequent statistical analysis were performed through SPSS Statistics 19.0 and PRISMA software. The data were downloaded directly from the central database and the International Manager and subsequently the PAIN OUT Publication Board was informed about our ideas for analysis. The Projects for publication have not been forwarded yet to the Publication Board. The normality of quantitative variables was tested by Kolmogorov-Smirnov test. Quantitative variables are expressed as mean ± standard deviation (SD). The differences between groups were assessed by parametric tests (T-student or ANOVA) for variables with normal distribution, while non-parametric tests (Mann-Whitney for two samples and Kruscal-Wallis with Dunn’s test for multiple comparisons) were performed in case of non normal distribution. Categorical variables were expressed as frequencies and percentages (%) and they were analyzed using the Chi-square test with Yates correction for the verification of null hypothesis. All tests were two tailed and a p < 0.05 was considered statistically significant for all analyses.
14
3. RESULTS
3.1 General population
Until the 31st March 2012 there were 54 other centres collecting data in the Pain Out Study (from
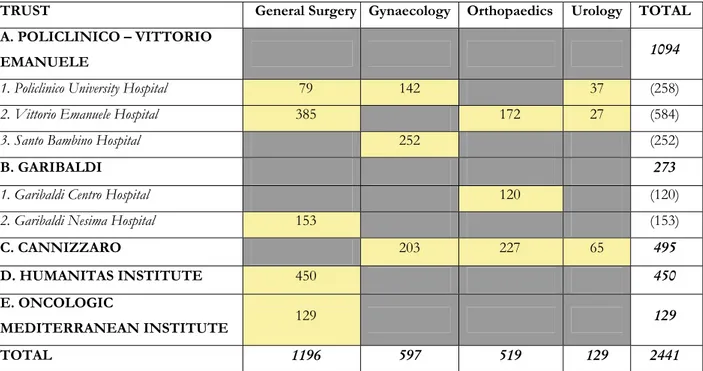
both branch, Europe and International) and the total number of recruited patients at that time was 27727. The total number of patients recruited in Catania in the same frame of 2 years has been 2706, accounting for 9.76% of the overall data. The questionnaire was filled in by 2441 patients (265 missing). The distribution of those patients among the participating Hospitals and surgical specialties is shown in Table 4.
TRUST General Surgery Gynaecology Orthopaedics Urology TOTAL A. POLICLINICO – VITTORIO
EMANUELE 1094
1. Policlinico University Hospital 79 142 37 (258)
2. Vittorio Emanuele Hospital 385 172 27 (584)
3. Santo Bambino Hospital 252 (252)
B. GARIBALDI 273
1. Garibaldi Centro Hospital 120 (120)
2. Garibaldi Nesima Hospital 153 (153)
C. CANNIZZARO 203 227 65 495
D. HUMANITAS INSTITUTE 450 450
E. ONCOLOGIC
MEDITERRANEAN INSTITUTE 129 129 TOTAL 1196 597 519 129 2441
Table 4. Distribution of the questionnaires filled in by patients, among the participating Hospitals and surgical specialties in Catania.
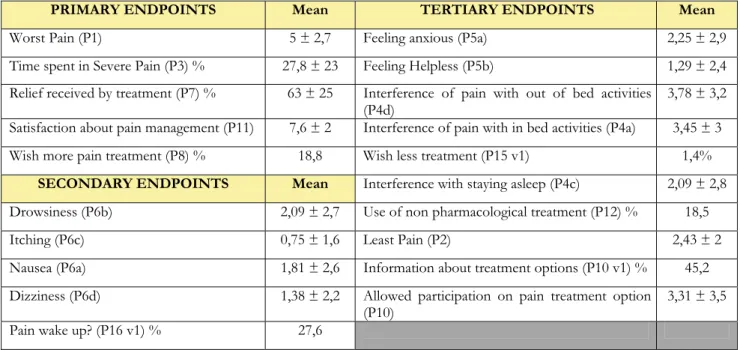
The mean year of birth was 1959, the male gender represents the 28.3% of the entire population and the mean weight was 71.1 Kg. Height was recorded for less than half of the population so we intentionally did not report the average value. The results of the general analysis of the answers to the questionnaire are shown in Table 5.
PRIMARY ENDPOINTS Mean TERTIARY ENDPOINTS Mean
Worst Pain (P1) 5 ± 2,7 Feeling anxious (P5a) 2,25 ± 2,9
Time spent in Severe Pain (P3) % 27,8 ± 23 Feeling Helpless (P5b) 1,29 ± 2,4
Relief received by treatment (P7) % 63 ± 25 Interference of pain with out of bed activities
(P4d) 3,78 ± 3,2
Satisfaction about pain management (P11) 7,6 ± 2 Interference of pain with in bed activities (P4a) 3,45 ± 3
Wish more pain treatment (P8) % 18,8 Wish less treatment (P15 v1) 1,4%
SECONDARY ENDPOINTS Mean Interference with staying asleep (P4c) 2,09 ± 2,8
Drowsiness (P6b) 2,09 ± 2,7 Use of non pharmacological treatment (P12) % 18,5
Itching (P6c) 0,75 ± 1,6 Least Pain (P2) 2,43 ± 2
Nausea (P6a) 1,81 ± 2,6 Information about treatment options (P10 v1) % 45,2
Dizziness (P6d) 1,38 ± 2,2 Allowed participation on pain treatment option
(P10) 3,31 ± 3,5
Pain wake up? (P16 v1) % 27,6
Table 5. Results of the primary, secondary and tertiary endpoints in the overall population of the study in the territory of Catania
The variety of interventions, patients characteristics and intra-operative anaesthetic techniques used does not fit well with a general analysis and thus with the interpretation of the results, perhaps not allowing a lot of conclusions. However, we found several interesting results analysing the general population:
a. The patient controlled analgesia (intravenous or epidural) was never been used in our territory b. The surgical wound infiltration (which theoretically applies to most of the interventions) was recorded for only 116 patients, 4.3% of the overall population.
c. The most frequently used postoperative drugs for pain relief were five: diclofenac (n=316, 12.9%), ketorolac (n=919, 37.6%), paracetamol (n=814, 33.3%), morphine (n=453, 18.6%) and tramadol (n=524, 21.5%). Local anaesthetics during the period spent in the RRA or in the ward were used in 41 patients only. The qualitative analysis of the use of NSAIDs shows that ketorolac prescription is significantly higher than paracetamol (p=0.002) and diclofenac (p<0.0001) and that paracetamol is more frequently used than diclofenac (p<0.0001). The year of birth of the patients receiving diclofenac (1966 ± 17) was significantly higher than those patients receiving ketorolac (1959 ± 16, p<0.0001) or paracetamol (1960 ± 17, p<0.0001).
In order to provide more specific findings and description of pain management in our territory, we focused our analysis on those subpopulations of each surgical specialty that provided a
16
3.2 General Surgery
Patients undergoing general surgery represent 49% of the entire population and were distributed in five different Hospitals (four Trusts). Among this population we analysed the subgroup of patients undergoing thyroidectomy.
3.2.1 Thyroidectomy
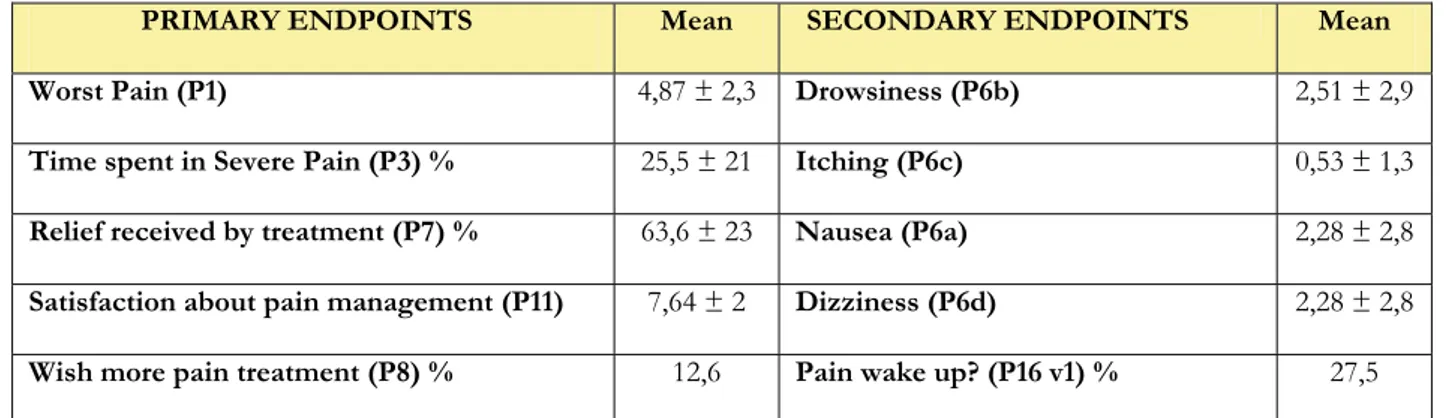
We collected data on 349 surgical patients having a partial or complete excision of the thyroid. This population was distributed among 5 different Hospitals, three of them (two Trusts) belonging to the public IHS and two being part of the private IHS (Table 6). As per methods, we intentionally excluded 22 patients who did not respond to any of the primary endpoints. Policlinico Hospital was deliberately excluded as collecting data on 10 thyroidectomies only. Table 6 also shows the distribution of the remaining 317 patients. Ten patients underwent to unilateral excision of the thyroid gland (OPCODE1C=06.2), while the remaining ones had a complete thyroidectomy (OPCODE1C=06.4). Of this group, 20,6% were male, mean weight was 69,9 ± 13,1 and mean year of birth 1959. The endpoints are shown in Table 7.
ITALIAN HEALTHCARE
SYSTEM N HOSPITAL N
Public 168 Vittorio Emanuele 126
Garibaldi Nesima 42
Private 149 Humanitas Institute 84
Oncologic Mediterranean Institute 65
TOTAL 317 TOTAL 317
Table 6. Distribution of the thyroidectomies according to the public or private Healthcare System and among Hospitals. Policlinico Hospital was excluded as collecting only 10 cases.
PRIMARY ENDPOINTS Mean SECONDARY ENDPOINTS Mean Worst Pain (P1) 4,87 ± 2,3 Drowsiness (P6b) 2,51 ± 2,9
Time spent in Severe Pain (P3) % 25,5 ± 21 Itching (P6c) 0,53 ± 1,3
Relief received by treatment (P7) % 63,6 ± 23 Nausea (P6a) 2,28 ± 2,8
Satisfaction about pain management (P11) 7,64 ± 2 Dizziness (P6d) 2,28 ± 2,8
Wish more pain treatment (P8) % 12,6 Pain wake up? (P16 v1) % 27,5
Table 7. Primary and secondary endpoints in 317 patients undergoing thyroidectomy (expressed as percentage or as mean and standard deviation)
We considered a first-line analysis dividing the patients per hospital (Table 8) and thus per different Healthcare System (public vs private IHS, Table 9).
DEMOGRAPHICS Vittorio Emanuele (N=126) A Garibaldi Nesima (N=42) B Humanitas Institute (N=84) C Oncological Mediterranean Institute (N=65) D
P value Dunn’s or
Chi-square test (p value)
Male Sex % 18,3 26,2 20,2 21,9 ns
PRIMARY ENDPOINTS A B C D
Worst Pain (P1) 5,25± 2 4,48 ± 2,1 4,96 ± 2,3 4,22 ± 2,7 0.013 A–D <0.05
Time spent in Severe Pain (P3) % 29,4 ± 19 26 ± 14 21,1 ± 20 23,7 ± 25 <0.001 A–C <0.01
A–D <0.05
Relief received by treatment (P7) % 62 ± 17 56,4 ± 26 66,6 ± 25 67,8 ± 26 0.019 ns
Satisfaction about pain management
(P11) 6,81 ± 1,6 8,04 ± 1,29 8,37 ± 2,1 8,16 ± 2,6 <0.0001 A-B <0.001 A-C <0.001
A-D <0.001
Wish more pain treatment (P8) % 16,9 14,3% 7,4% 9,5 ns
SECONDARY ENDPOINTS Drowsiness (P6b) 2,16 ± 2,5 0,55 ± 1,3 3,23 ± 3,3 3,56 ± 3 <0.0001 A-B <0.001 A-D <0.05 B-C <0.001 B-D <0.001 Itching (P6c) 0,94 ± 1,5 0,14 ± 0,6 0,41 ± 1,1 0,13 ± 0,7 <0.0001 A-B <0.001 A-C <0.001 A-D <0.001 Nausea (P6a) 2,48 ± 2,4 1,55 ± 1,8 2,36 ± 3 2,28 ± 3,46 0.059 ns Dizziness (P6d) 2,1 ± 2,5 0,55 ± 1,2 2,99 ± 3 2,83 ± 3,3 <0.0001 A-B <0.001 B-C <0.001 B-D <0.001
Pain wake up? (P16 v1) % 37,5 7,1 26,8 26,2 <0.05 A-B <0.001
B-C <0.05 B-D <0.05 TERTIARY ENDPOINTS
Information about treatment options
(P10 v1) % 57,9 45,2 42 26,2 A-D <0.0005 A-C <0.05
Allowed participation on treatment
option (P10) 3,96 ± 2,6 3,69 ± 3,3 3,8 ± 3,6 2,9 ± 3,9 0.054 A-D <0.05
Use of non pharmacological treatment
(P12) % 11,9 9,5 16,3 37,7 A-D <0.0005 B-D <0.05
C-D <0.01 Table 8. Demographics, primary, secondary and three tertiary endpoints in patients undergoing thyroidectomy divided per Hospital. Hospitals are also indicated
18
DEMOGRAPHICS Public Healthcare
System (N=168) Private Healthcare System (N=149) p value
Male Sex % 20,2 20,9 0.99
PRIMARY ENDPOINTS
Worst Pain (P1) 5,06 ± 2 4,65 ± 2,5 0.091
Time spent in Severe Pain (P3) % 28,5 ± 18 22,2 ± 23 <0.0001 Relief received by treatment (P7) % 60,6 ± 20 67,1 ± 25 0.0028 Satisfaction about pain management (P11) 7,12 ± 1,6 8,28 ± 2,3 <0.0001 Wish more pain treatment (P8) % 16,3 8,3 0.053
SECONDARY ENDPOINTS
Drowsiness (P6b) 1,76 ± 2,4 3,37 ± 3,2 <0.0001 Itching (P6c) 0,74 ± 1,4 0,29 ± 1 0.0003 Nausea (P6a) 2,24 ± 2,3 2,33 ± 3,2 0.11
Dizziness (P6d) 1,71 ± 2,4 2,92 ± 3,1 0.0017 Pain wake up? (P16 v1) % 28,3 26,5 0.86
TERTIARY ENDPOINTS
Information about treatment options (P10 v1) % 54,8 35,2 <0.001 Allowed participation on treatment option (P10) 3,84 ± 2,8 3,42 ± 3,7 0.057
Use of non pharmacological treatment (P12) % 11,3 25,5 0.002 Table 9. Demographics, primary, secondary and three tertiary endpoints in patients undergoing thyroidectomy divided according to the Italian Healthcare System, public or private. Mann-Whitney or Chi-square (with Yates correction) test performed and p values are shown in the last column.
With regards to the intraoperative technique, all the cases were performed under general anaesthesia. In 208 interventions (65,6%), remifentanil i.v. was used intraoperatively. Table 10 shows the results of subgroups analysis according to whether remifentanil was used or not for intraoperative anaesthesia.
DEMOGRAPHICS Use of Remifentanil
(N=208) Remifentanil not used (N=109) p value
Male Sex % 19,2 23,1 0.50
PRIMARY ENDPOINTS
Worst Pain (P1) 5,14 ± 2,1 4,34 ± 2,1 0.002 Time spent in Severe Pain (P3) % 25,9 ± 20 24,8 ± 21 0.47
Relief received by treatment (P7) % 63,9 ± 21 62,9 ± 26 0.79
Satisfaction about pain management (P11) 7,42 ± 2 8,1 ± 2,1 0.0004 Wish more pain treatment (P8) % 13,3 11,2 0.73
SECONDARY ENDPOINTS
Drowsiness (P6b) 2,63 ± 2,9 2,26 ± 2,9 0.14
Itching (P6c) 0,74 ± 1,4 0,12 ± 0,7 <0.0001 Nausea (P6a) 2,46 ± 2,7 1,94 ± 2,9 0.009 Dizziness (P6d) 2,52 ± 2,8 1,81 ± 2,7 0.0032 Pain wake up? (P16 v1) % 33,6 18,4 0.012 Table 10. Demographics, primary and secondary endpoints in patients undergoing thyroidectomy divided according to the use of intraoperative remifentanil. Mann-Whitney or Chi-square (with Yates correction) test performed and p values are shown in the last column.
The analysis of the intraoperative drugs administration is shown in Table 11. For those patients not receiving remifentanil, fentanyl was administered in all cases. For the reason discussed in the material and methods, since fentanyl was assumed as not given intraoperatively for postoperative pain relief, the analysis was not performed. The group of patients receiving remifentanil had a significantly higher intraoperative use of NSAIDs (p<0.0001). Of the 9 patients receiving morphine in the remifentanil group, 8 had tramadol as well, while morphine was never used in combination with tramadol in the non-remifentanil group. The analysis regarding the administration of non-remifentanil/non-fentanyl opioids for pain relief shows a significantly higher use in the remifentanil group (n=184/208 vs n=38/109, p<0.001).
INTRAOPERATIVE DRUG
ADMINISTRATION Use of Remifentanil(N=208) Remifentanil Not used (N=109) Chi squaretest Fentanyl (N=276) 167 109 NA Morphine (N=11) (4%) 9 (2%) 2 p=0.41 Tramadol (N=219) (88%) 183 (33%) 36 p<0.001 Paracetamol (N=92) (26%) 55 (34%) 37 p=0.20 Diclofenac (N=2) (1%) 2 0 p=0.78 Ketorolac (N=241) (84%) 175 (61%) 66 p<0.001 Table 11. Analysis of the intraoperative Opioids and Non Steroidal Anti-Inflammatory Drugs given in two subpopulations: those receiving anaesthesia with remifentanil and those not. Chi-square test (with Yates correction) is shown in the last column.
NA = Not assessed by statistical analysis
For what concerns the postoperative period, the data regarding the administered drugs for pain relief were not available for 89 patients (28% of the subgroup of thyroidectomy). At least one NSAID (diclofenac, ketorolac, paracetamol) was administered to 131 patients of the remifentanil group (63%) and to 68 of the non-remifentanil group (62.4%, p=0.99). An opioid drug (morphine and/or tramadol) was administered to 63 patients of the remifentanil group (30.3%) and to 50 of the non-remifentanil group (45.9%, p=0.009). The differences in the use of each postoperative drug among the two subpopulations are shown in Table 12.
20
POSTOPERATIVE DRUG
ADMINISTRATION Use of Remifentanil (N=208) Remifentanil Not used (N=109) Chi square test Morphine (N=11) (1%) 3 (7%) 8 p=0.016 Tramadol (N=103) (29%) 60 (39%) 43 p=0.073
Paracetamol (N=72) (21%) 43 (27%) 29 p=0.29
Ketorolac (N=125) (38%) 79 (42%) 46 p=0.54
Diclofenac (N=19) (9%) 19 0 p=0.003 Table 12. Analysis of the postoperative use of Opioid and Non Steroidal Anti-Inflammatory Drugs in two subpopulations of patients undergoing thyroidectomy: those receiving anaesthesia with remifentanil and those not. Chi-square test (with Yates correction) is shown in the last column.
We have records of 308 patients regarding the use of non-pharmacological methods for PP relief. Table 13 shows the differences.
DEMOGRAPHICS Non-pharmacological methods not used
(N=254) Use of non-pharmacological methods (N=54) p value Male Sex % 22 11,5 0.10 PRIMARY ENDPOINTS Worst Pain (P1) 4,7 ± 2,2 5,69 ± 2,4 0.0017 Time spent in Severe Pain (P3) % 24,4 ± 18 31,3 ± 27 0.17 Relief received by treatment (P7) % 64,4 ± 22 58,8 ± 24 0.12 Satisfaction about pain management (P11) 7,65 ± 2 7,57 ± 2,1 0.68
Wish more pain treatment (P8) % 12 13,7 0.73 SECONDARY ENDPOINTS
Drowsiness (P6b) 2,2 ± 2,8 3,59 ± 2,9 0.0004 Itching (P6c) 0,56 ± 1,3 0,44 ± 1,1 0.50 Nausea (P6a) 2,34 ± 2,7 1,93 ± 2,8 0.15 Dizziness (P6d) 2,13 ± 2,8 2,64 ± 2,6 0.093 Pain wake up? (P16 v1) % 23,8 47,4 0.0028 Table 13. Demographics, primary and secondary endpoints in patients undergoing thyroidectomy divided according to the use of non-pharmacological methods for postoperative pain relief. Mann-Whitney or Chi-square (with Yates correction) test performed and p values shown in the last column.
3.3 Gynaecology
Gynaecological patients represent 24.4% of the entire population and were distributed in three different Hospitals (two Trusts; Table 2). Among this group of surgical patients we analysed the following populations: 1) Hysterectomies and other uterine procedures (open abdominal surgery); 2) Caesarean Sections.
3.3.1 Hysterectomies and other uterine procedures (open abdominal surgery)
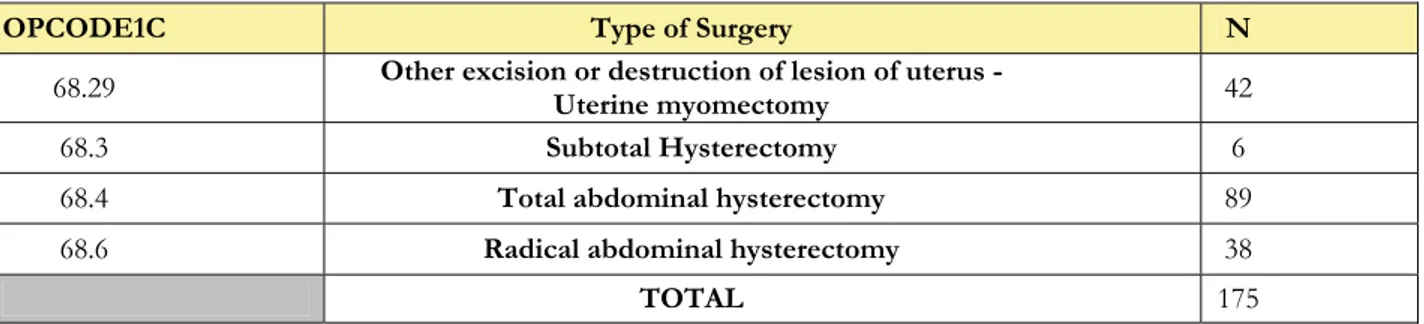
We collected data on 214 gynaecological patients undergoing open abdominal procedure involving a partial or total excision of the uterus (OPCODE1C = 68.29, 68.3, 68.4, 68.6). Thirteen patients did not fill in the questionnaire and were removed from analysis as well as 2 patients for which there was no information about intra-operative technique and postoperative drugs used. The remaining population was distributed among 6 Hospitals (Table 14). As per methods, we deliberately excluded a total of 19 patients recruited in centres not achieving the established cut-off (n≥25). Of the residual 180, we also intentionally excluded 5 patients receiving intraoperative regional anaesthesia (without any general anaesthesia) in order to analyze a more homogeneous sample. The type of intervention performed in the remaining 175 cases is shown in Table 15.
Table 14. Distribution of the open abdominal uterine surgery among the Hospitals collecting data.
Table 15. Distribution of the analyzed sample according to the open abdominal uterine surgery performed
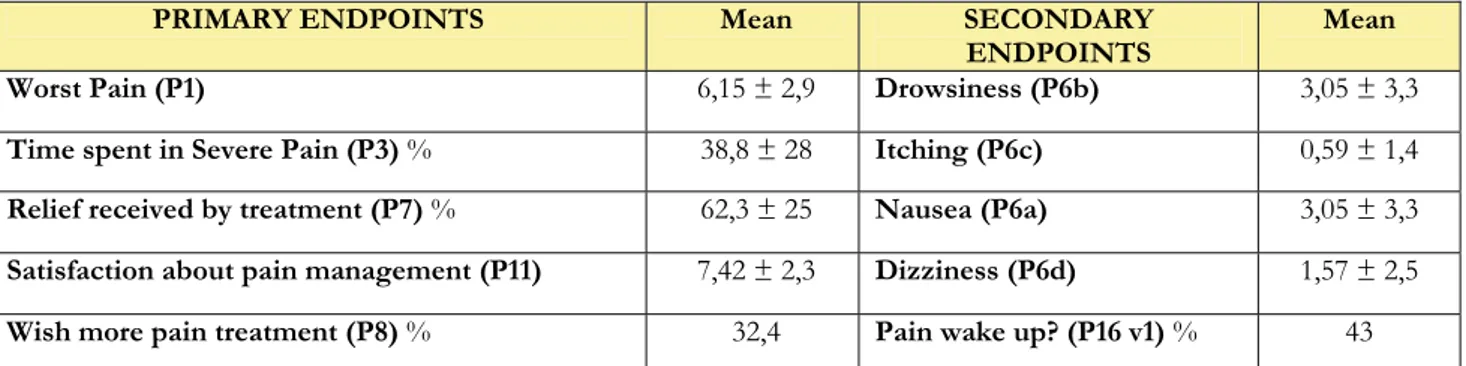
The mean weight is 67,5 ± 13,2 Kg and mean year of birth 1962 ± 11. The endpoints are shown in Table 16. HOSPITAL N Vittorio Emanuele 2 S. Bambino 34 Policlinico 53 Cannizzaro 93 Humanitas 16
Oncologic Mediterranean Institute 1
TOTAL 199
OPCODE1C Type of Surgery N
68.29 Other excision or destruction of lesion of uterus -Uterine myomectomy 42
68.3 Subtotal Hysterectomy 6
68.4 Total abdominal hysterectomy 89
68.6 Radical abdominal hysterectomy 38
22
PRIMARY ENDPOINTS Mean SECONDARY
ENDPOINTS Mean Worst Pain (P1) 6,15 ± 2,9 Drowsiness (P6b) 3,05 ± 3,3
Time spent in Severe Pain (P3) % 38,8 ± 28 Itching (P6c) 0,59 ± 1,4
Relief received by treatment (P7) % 62,3 ± 25 Nausea (P6a) 3,05 ± 3,3
Satisfaction about pain management (P11) 7,42 ± 2,3 Dizziness (P6d) 1,57 ± 2,5
Wish more pain treatment (P8) % 32,4 Pain wake up? (P16 v1) % 43
Table 16. Primary and secondary endpoints in 175 patients undergoing open uterine surgery under general anaesthesia.
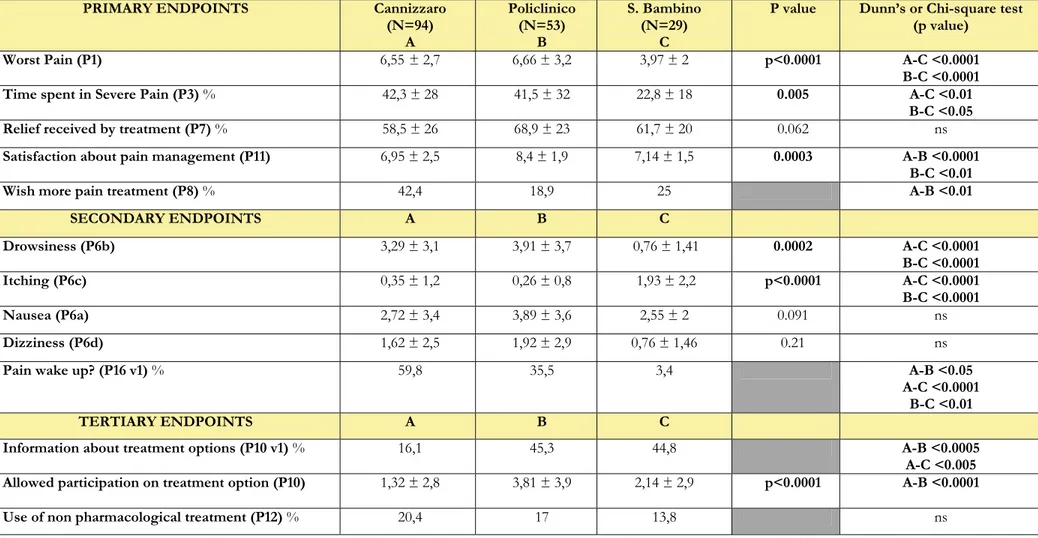
PRIMARY ENDPOINTS Cannizzaro (N=94) A Policlinico (N=53) B S. Bambino (N=29) C
P value Dunn’s or Chi-square test
(p value)
Worst Pain (P1) 6,55 ± 2,7 6,66 ± 3,2 3,97 ± 2 p<0.0001 A-C <0.0001
B-C <0.0001
Time spent in Severe Pain (P3) % 42,3 ± 28 41,5 ± 32 22,8 ± 18 0.005 A-C <0.01
B-C <0.05
Relief received by treatment (P7) % 58,5 ± 26 68,9 ± 23 61,7 ± 20 0.062 ns
Satisfaction about pain management (P11) 6,95 ± 2,5 8,4 ± 1,9 7,14 ± 1,5 0.0003 A-B <0.0001
B-C <0.01
Wish more pain treatment (P8) % 42,4 18,9 25 A-B <0.01
SECONDARY ENDPOINTS A B C Drowsiness (P6b) 3,29 ± 3,1 3,91 ± 3,7 0,76 ± 1,41 0.0002 A-C <0.0001 B-C <0.0001 Itching (P6c) 0,35 ± 1,2 0,26 ± 0,8 1,93 ± 2,2 p<0.0001 A-C <0.0001 B-C <0.0001 Nausea (P6a) 2,72 ± 3,4 3,89 ± 3,6 2,55 ± 2 0.091 ns Dizziness (P6d) 1,62 ± 2,5 1,92 ± 2,9 0,76 ± 1,46 0.21 ns
Pain wake up? (P16 v1) % 59,8 35,5 3,4 A-B <0.05
A-C <0.0001 B-C <0.01
TERTIARY ENDPOINTS A B C
Information about treatment options (P10 v1) % 16,1 45,3 44,8 A-B <0.0005
A-C <0.005
Allowed participation on treatment option (P10) 1,32 ± 2,8 3,81 ± 3,9 2,14 ± 2,9 p<0.0001 A-B <0.0001
Use of non pharmacological treatment (P12) % 20,4 17 13,8 ns
Table 17. Primary, secondary and three of the tertiary endpoints in patients undergoing open abdominal uterine surgery divided per Hospital. Hospitals are also indicated with letters A to C for the multiple comparisons through the Dunn’s and Chi-square tests with Yates correction. The p values for multiple comparisons are shown only when significantly different.
24
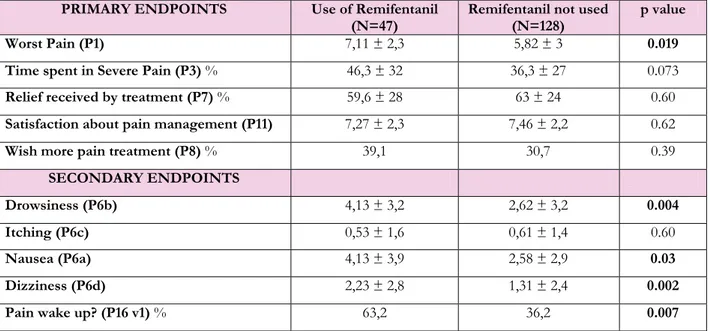
In order to understand the differences among the hospital we considered again to screen the population according to the intraoperative use of remifentanil (Table 18). We detected 47 patients with documented use of remifentanil (26,9%) and 128 without it (73,1%). Table 19 shows the drugs administered during the intraoperative period for postoperative pain relief. Again, as per methods, fentanyl analysis was not performed.
PRIMARY ENDPOINTS Use of Remifentanil
(N=47) Remifentanil not used (N=128) p value Worst Pain (P1) 7,11 ± 2,3 5,82 ± 3 0.019 Time spent in Severe Pain (P3) % 46,3 ± 32 36,3 ± 27 0.073
Relief received by treatment (P7) % 59,6 ± 28 63 ± 24 0.60
Satisfaction about pain management (P11) 7,27 ± 2,3 7,46 ± 2,2 0.62
Wish more pain treatment (P8) % 39,1 30,7 0.39
SECONDARY ENDPOINTS
Drowsiness (P6b) 4,13 ± 3,2 2,62 ± 3,2 0.004 Itching (P6c) 0,53 ± 1,6 0,61 ± 1,4 0.60
Nausea (P6a) 4,13 ± 3,9 2,58 ± 2,9 0.03 Dizziness (P6d) 2,23 ± 2,8 1,31 ± 2,4 0.002 Pain wake up? (P16 v1) % 63,2 36,2 0.007 Table 18. Primary and secondary endpoints in patients undergoing open abdominal uterine surgery divided according to the use of intraoperative remifentanil. Mann-Whitney or Chi-square (with Yates correction) test performed and p values are shown in the last column.
Among the group treated with remifentanil, one patient received both morphine and tramadol intraoperatively. The comparison regarding the intraoperative use of non-remifentanil/non-fentanyl opioids showed a trend towards lower use in the remifentanil group if compared with patients not receiving remifentanil (n=27/47 vs n=94/128, p=0.065). This result seems to be driven by the larger use of tramadol in the non-remifentanil group. Four patients in the remifentanil group and 9 in the non remifentanil group received both ketorolac and paracetamol and there was no difference in intraoperative NSAIDs use among the two groups (respectively, n=33/47 vs n=97/128, p=0.58).
INTRAOPERATIVE DRUG
ADMINISTRATION Use of Remifentanil (N=47) Remifentanil not used (N=128) Chi squaretest Fentanyl (N=128) (17%) 8 (94%) 120 NA Morphine (N=80) (49%) 23 (45%) 57 p=0.73
Tramadol (N=42) (11%) 5 (29%) 37 p=0.02 Paracetamol (N=100) (53%) 25 (59%) 75 P=0.64
Ketorolac (N=43) (26%) 12 (24%) 31 P=0.98
Table 19. Analysis of the intraoperative use of Opioids and Non Steroidal Anti-Inflammatory Drugs in two subpopulations: those receiving anaesthesia with remifentanil and those not. Chi-square test (with Yates correction) is shown in the last column.
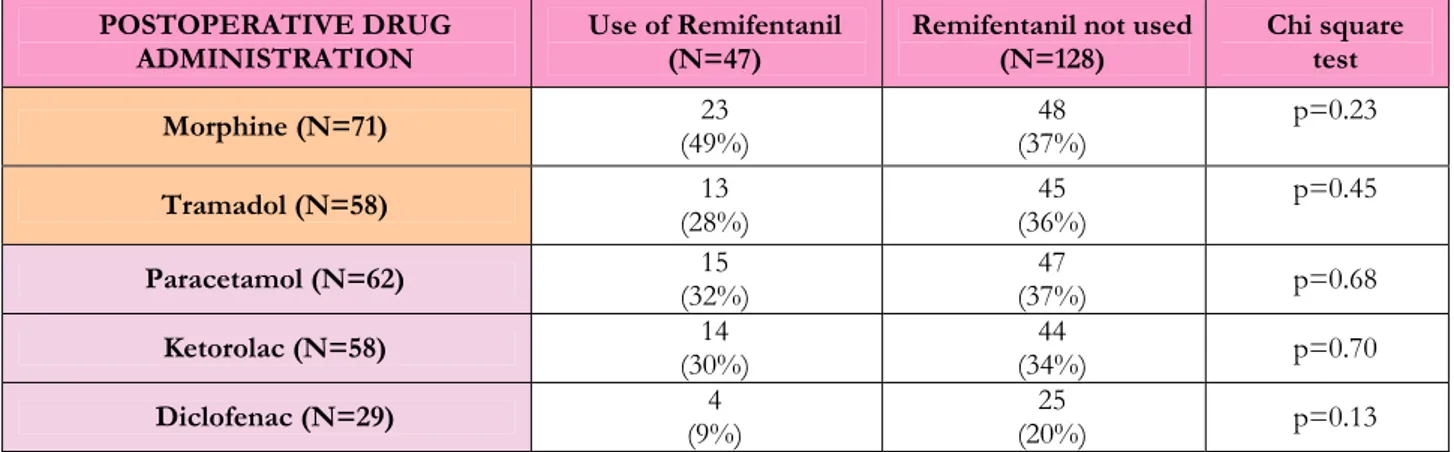
Considering again the two groups of patients receiving or not remifentanil, the analysis of the drugs used for postoperative pain relief is shown in Table 20. Two patients in the remifentanil group and one in the non-remifentanil group received both morphine and tramadol; there was no difference in opioid use in the postoperative period among the two groups (respectively, n=34/47 vs n=92/128, p=0.88). In three cases of the remifentanil group and 16 of the non-remifentanil group a combination of different NSAIDs was used in the postoperative period, showing a trend towards higher NSAIDs use in the non-remifentanil group (respectively, n=30/47 vs n=99/128, p=0.11).
POSTOPERATIVE DRUG
ADMINISTRATION Use of Remifentanil (N=47) Remifentanil not used (N=128) Chi square test Morphine (N=71) (49%) 23 (37%) 48 p=0.23 Tramadol (N=58) (28%) 13 (36%) 45 p=0.45 Paracetamol (N=62) (32%) 15 (37%) 47 p=0.68
Ketorolac (N=58) (30%) 14 (34%) 44 p=0.70
Diclofenac (N=29) (9%) 4 (20%) 25 p=0.13
Table 20 Analysis of the postoperative use of Opioids and Non Steroidal Anti-Inflammatory Drugs in two subpopulations: those receiving anaesthesia with remifentanil and those not. Chi-square test (with Yates correction) is shown on the last column.
The wound was infiltrated in only 3 patients, thus not allowing further analysis.
Regardless of the intraoperative technique, we have evidence of pain treatment for 166 patients (94.9%) during the period spent in the RRA and in the ward. In 9 cases (5.1%) the information on the postoperative period were not available. One patient received postoperative treatment with epidural analgesia and was excluded from the analysis. Of the remaining 165, we found a total of 87 patients (52.7%) receiving a combination of Opioid and NSAIDs for postoperative pain treatment. An opioid-only based postoperative analgesia was used in 36 patients (21.8%) and NSAIDs-opioid-only approach was recorded for 42 patients (25.5%). The results of primary and secondary endpoints among these three groups are shown in Table 21.
26
PRIMARY ENDPOINTS Opioid + NSAIDS(N=87)
A Opioid only (N=36) B NSAIDs only (N=42) C P value Dunn’s or Chi-square test (p value)
Worst Pain (P1) 5,42 ± 2,8 6,77 ± 2,9 6,81 ± 2,9 0.006 A-B <0.05
A-C <0.05
Time spent in Severe Pain (P3) % 32,4 ± 26 42,1 ± 31 44,3 ± 28,6 0.053 ns
Relief received by treatment (P7) % 66,6 ± 23 58,3 ± 26 58,7 ± 24 0.10 ns
Satisfaction about pain management (P11) 7,93 ± 1,9 7,11 ± 2,4 6,83 ± 2,6 0.046 ns
Wish more pain treatment (P8) % 20,9 50 38,1 A-B <0.005
A-C 0.06 SECONDARY ENDPOINTS A B C Drowsiness (P6b) 2,94 ± 3,2 3,44 ± 3,5 2,74 ± 3,2 0.69 ns Itching (P6c) 0,78 ± 1,7 0,44 ± 1 0,33 ± 1 0.32 ns Nausea (P6a) 2,78 ± 3,3 3,17 ± 3,3 2,79 ± 3,1 0.84 ns Dizziness (P6d) 1,36 ± 2,3 2 ± 3 1,27 ± 2 0.62 ns
Pain wake up? (P16 v1) % 39,7 47,8 39,5 ns
Table 21. Primary and secondary endpoints in patients undergoing open abdominal uterine surgery divided according to the postoperative use of opioids and/or Non Steroidal Anti-Inflammatory Drugs (NSAIDs) for pain relief. Groups are also indicated with letters A to C for the multiple comparisons through the Dunn’s and Chi-square (with Yates correction) tests. The p values for multiple comparisons are shown only when significantly different.
3.3.2 Caesarean Section (CS)
We collected data and questionnaire of 146 classical CS (OPCODE1C = 74.0), 144 of them belonging to the same Hospital (S. Bambino) and 2 collected in Cannizzaro Hospital. As per general method of the analysis, we intentionally excluded the latter 2 cases. The mean year of birth in this population is 1979, and mean weight is 79.5 Kg. Table 22 shows the results of the questionnaire for primary and secondary endpoints.
PRIMARY ENDPOINTS Mean SECONDARY ENDPOINTS Mean Worst Pain (P1) 3,89 ± 1,9 Drowsiness (P6b) 0,4 ± 1 Time spent in Severe Pain (P3) % 19,5 ± 14 Itching (P6c) 1,61 ± 2,1 Relief received by treatment (P7) % 66,4 ± 23 Nausea (P6a) 1,49 ± 1,8 Satisfaction about pain management (P11) 7,6 ± 1,6 Dizziness (P6d) 0,4 ± 1,1 Wish more pain treatment (P8) % 9 Pain wake up? (P16 v1) % 7 Table 22. Primary and secondary endpoints of patients undergoing caesarean section in S. Bambino Hospital
The intraoperative technique used was always a regional anaesthesia with central nerve block (likely spinal) and the different pharmacological combinations used are shown in Table 23. In 4 cases the local anaesthetic drugs used were not reported, despite we have evidence of 3 of these patients receiving an opioid administration for regional anaesthesia (morphine, n=2; fentanyl, n=1). For one patient both Bupivacaine and Levo-Bupivacaine were recorded as intraoperative drugs administered in regional anaesthesia (with morphine) associated to a subcutaneous wound infiltration. In this last case it is not possible to find out which local anaesthetic was used for anaesthesia and which one for wound infiltration.
Drug used for spinal anaesthesia N
Bupivacaine only 1 Bupivacaine + Morphine 100 Bupivacaine + Fentanyl 32 Levo-Bupivacaine + Fentanyl 6 Unclear 5 Total 144
28
We compared the outcomes between the two more representative groups in which Bupivacaine was used with the adjunct of morphine or fentanyl. The results did not show any difference in the endpoints (Table 24).
PRIMARY ENDPOINTS Bupivacaine + Morphine
(N=100) Bupivacaine + Fentanyl (N=32) p value Worst Pain (P1) 3,87 ± 1,9 4,16 ± 2 0.35 Time spent in Severe Pain (P3) % 18,6 ± 15 22,2 ± 14 0.13 Relief received by treatment (P7) % 68,2 ± 23 63,7 ± 22 0.22 Satisfaction about pain management
(P11) 7,65 ± 1,6 7,47 ± 1,6 0.46
Wish more pain treatment (P8) % 9 12,5 0.57 SECONDARY ENDPOINTS
Drowsiness (P6b) 0,4 ± 1 0,37 ± 0,8 0.84 Itching (P6c) 1,74 ± 2,3 1,41 ± 1,7 0.91 Nausea (P6a) 1,37 ± 1,8 1,78 ± 1,9 0.27 Dizziness (P6d) 0,36 ± 1 0,56 ± 1,3 0.43
Pain wake up? (P16 v1) % 7,7 9,4 0.67 Table 24. Primary and secondary endpoints within the two subgroups of caesarean sections, according to
the intraoperative drugs used for spinal anaesthesia. Mann-Whitney or Chi-square (with Yates correction) test performed and p values are shown in the last column.
The qualitative analysis of the drugs used for pain relief during the postoperative period has shown some difference between the patients receiving intrathecal morphine or fentanyl. We performed this analysis in the two groups in Table 24 (morphine and bupivacaine-fentanyl) and the results are shown in Table 25. There was a significantly higher number of patients in the group of intrathecal bupivacaine-fentanyl receiving a postoperative opioid administration (n=25/32 vs n=6/100, p<0.001). On the other side there was no differences in the patients treated with postoperative NSAIDs (n=99/100 vs n=31/32, p=0.98) Twenty-three patients in the group of bupivacaine-morphine were treated with only one drug for pain relief (23%) while only 6% (n=2/32) of those receiving bupivacaine-fentanyl had only one drug for pain relief (p=0.065). The use of non-pharmacological tools for pain relief was not different between the two groups (bupivacaine-morphine = 23% vs bupivacaine-fentanyl = 26%, p=0.93).
POSTOPERATIVE DRUG
ADMINISTRATION Bupivacaine + Morphine(N=100) Bupivacaine + Fentanyl (N=32) Chi square Morphine (N=1) (1%) 1 0 p=0.56
Tramadol (N=30) (5%) 5 (78%) 25 p=<0.001
Diclofenac (N=95) (87%) 87 (25%) 8 p=<0.001 Paracetamol (N=108) (78%) 78 (94%) 30 p=0.08
Ketorolac (N=5) (4%) 4 (3%) 1 p=0.76 Table 25. Postoperative drug administration for pain relief in the two subgroups of caesarean sections, according to the intra-operative drugs used for spinal anaesthesia. Chi-square test (with Yates correction) is shown in the last column.
When extending the analysis to all the patients receiving intrathecal morphine or fentanyl (regardless of the local anaesthetic used), so adding 10 more patients (3 in the morphine group and 7 in the fentanyl group), we did not find any significant change of results compared with those shown in Table 25.
The surgical wound was infiltrated in 26 patients (18%) and the analysis of this subgroup compared to the one not receiving infiltration with local anaesthetic shows some significant differences (Table 26).
PRIMARY ENDPOINTS Wound Infiltration
(N=26) No wound infiltration (N=118) p value Worst Pain (P1) 4,27 ± 1,3 3,81 ± 2 0.34 Time spent in Severe Pain (P3) % 26,6 ± 14 18 ± 14 0.0033 Relief received by treatment (P7) % 51,6 ± 23 69,7 ± 22 0.0005 Satisfaction about pain management (P11) 7,5 ± 1,1 7,62 ± 1,6 0.45
Wish more pain treatment (P8) % 7,7 9,3 0.79 SECONDARY ENDPOINTS
Drowsiness (P6b) 0,54 ± 1,1 0,37 ± 1 0.58 Itching (P6c) 2,31 ± 1,9 1,46 ± 2,1 0.021 Nausea (P6a) 1,5 ± 1,5 1,49 ± 1,9 0.69 Dizziness (P6d) 0,35 ± 1 0,41 ± 1,1 0.84
Pain wake up? (P16 v1) 0 8,5 0.26
Table 26 Primary and secondary endpoints in the two subgroups of caesarean sections, according to the infiltration (single shot) of the surgical wound with local anaesthetics. Mann-Whitney or Chi-square (with Yates correction) test performed and p values shown in the last column.
30
Table 27 shows the combination of Opioids and NSAIDs used in the postoperative period for pain relief. For two patients there was no information available regarding the postoperative analgesia. Of those one-hundred and forty patients receiving NSAIDs during the postoperative period, 36 were treated with an opioid as well.
NSAIDS OPIOID N Y 2 Y Y 36 Y N 104 N N 2 144
Table 27 Postoperative combination of Opioids and NSAIDs used in the for pain relief after caesarean section.
We compared the group of patients receiving NSAIDs only with those receiving a combination of NSAIDs and Opioid medication (Table 28).
PRIMARY ENDPOINTS NSAIDs and Opioid
(N=36) NSAIDs only (N=104) p value Worst Pain (P1) 3,91 ± 1,7 3,87 ± 2 0.69 Time spent in Severe Pain (P3) % 21,9 ± 12 18,5 ± 15 0.11 Relief received by treatment (P7) % 59,7 ± 23 68,6 ± 23 0.036 Satisfaction about pain management (P11) 7,44 ± 1,6 7,65 ± 1,5 0.42
Wish more pain treatment (P8) % 11,1 7,7 0.66 SECONDARY ENDPOINTS
Drowsiness (P6b) 0,44 ± 1,2 0,39 ± 1 0.41 Itching (P6c) 1,39 ± 2,1 1,70 ± 2,1 0.49 Nausea (P6a) 1,47 ± 1,7 1,49 ± 1,8 0.89 Dizziness (P6d) 0,5 ± 1,3 0,37 ± 1 0.86
Pain wake up? (P16 v1) % 8,3 6,8 0.95 Table 28. Primary and secondary endpoints in the two subgroups of caesarean sections, according to the
postoperative treatment. NSAIDs = Non-Steroidal Anti-Inflammatory Drugs.
Thirty-two patients used of non-pharmacological methods for pain relief (cooling, 100%), six did not specify and 107 did not use non-pharmacological methods. By analysing the endpoints among those patients using or not non-pharmacological methods, we did not find any significant differences (Table 29). The percentages of patients receiving Opioids and/or NSAIDs are not different among these two groups.
PRIMARY ENDPOINTS Non-pharmacological methods not used
(N=107)
Use of non-pharmacological
methods (N=32) p value Worst Pain (P1) 3,77 ± 2 4,5 ± 1,3 0.053 Time spent in Severe Pain (P3) % 17,9 ± 14 25,9 ± 15 0.003 Relief received by treatment (P7) % 70,2 ± 22 50,9 ± 22 <0.0001 Satisfaction about pain management (P11) 7,59 ± 1,6 7,42 ± 1,2 0.32
Wish more pain treatment (P8) % 8,4 12,5 0.73 SECONDARY ENDPOINTS
Drowsiness (P6b) 0,32 ± 0,8 0,75 ± 1,6 0.18 Itching (P6c) 1,39 ± 1,9 2,59 ± 2,5 0.012 Nausea (P6a) 1,53 ± 1,8 1,5 ± 2 0.80 Dizziness (P6d) 0.35 ± 1 0,62 ±1,3 0.18
Pain wake up? (P16 v1) % 9,4 0 0.16 Table 29. Primary and secondary endpoints in the two subgroups of caesarean sections, using or not
32
3.4 Orthopaedics
Data on patients undergoing orthopaedic procedures were recorded in three Hospitals (Vittorio Emanuele, Garibaldi Centro and Cannizzaro) and represent 21.3% of the entire Pain Out data collected. Among this group we did not find any surgical population with the target of 100 interventions. However we decided to analyze the subgroup of patients undergoing an open procedure involving the hip or the lower limb (excluding the ankle and the foot).
3.4.1 Hip and lower limb orthopaedic surgery
We included in this subgroup only those interventions involving an internal fixation of fracture or a joint replacement/revision (hip or knee). Those receiving an open reduction of fracture without internal fixation were excluded as well as those cases where the anatomical region involved was not specified. Foot and ankle were excluded as deemed to be exposed to interventions with lower predicted postoperative pain.
According to the ICD-9 we collected data of patients recorded with the following OPCODE1C: 79.35, 79.36, 81.51, 81.52, 81.53, 81.54, 81.55. The number and type of intervention per Hospital are reported in Table 30.
Table 30. Distribution of data among the Hospitals according to type of orthopaedic surgery (involving hip or lower limb).
The mean year of birth is 1952, 48% are male and mean weight is 78 Kg. Table 31 shows the results of the questionnaire for primary and secondary endpoints.
OPCODE1C Type of Surgery Vittorio
Emanuele Garibaldi Centro Cannizzaro N
79.35 Femoral Open reduction of fracture with
internal fixation 8 12 10 30
79.36 Tibial and/or fibular Open reduction of
fracture with internal fixation 29 10 13 52
81.51 Total hip replacement 9 18 12 39
81.52 Partial hip replacement 1 0 0 1
81.53 Revision of hip replacement 1 0 3 4
81.54 Total knee replacement 14 10 2 26
81.55 Revision of knee replacement 2 1 0 3
PRIMARY ENDPOINTS Mean SECONDARY ENDPOINTS Mean Worst Pain (P1) 5.57 ± 2,8 Drowsiness (P6b) 1,95 ± 2,6
Time spent in Severe Pain (P3) % 34,1 ± 25 Itching (P6c) 0,87 ± 1,9
Relief received by treatment (P7) % 64,6 ± 25 Nausea (P6a) 2,28 ± 2,8
Satisfaction about pain management (P11) 7,37 ± 2,2 Dizziness (P6d) 1,29 ± 2,4
Wish more pain treatment (P8) % 28,6 Pain wake up? (P16 v1) % 41,8
Table 31. Primary and secondary endpoints in 155 patients undergoing orthopaedic surgery (involving hip or lower limb).
34
DEMOGRAPHICS Vittorio Emanuele
(N=64) A Garibaldi Centro (N=51) B Cannizzaro (N=40) C
P value Dunn’s or
Chi-square test (p value)
Male sex % 44,2 51 50 ns
PRIMARY ENDPOINTS A B C
Worst Pain (P1) 4,94 ± 2,8 5,55 ± 2,8 6,64 ± 2,5 0.009 A-C <0.01
Time spent in Severe Pain (P3) % 26,6 ± 22 33,3 ± 25 47,9 ± 26 0.0002 A-C <0.001
B-C <0.05
Relief received by treatment (P7) % 66,2 ± 24 65,9 ± 26 60 ± 26 0.41 ns
Satisfaction about pain management (P11) 7,7 ± 2 7,43 ± 2,2 6,75 ± 2,3 0.11 ns
Wish more pain treatment (P8) % 17,5 33,3 40 A-C <0.05
SECONDARY ENDPOINTS A B C Drowsiness (P6b) 2,08 ± 2,8 1,42 ± 2,1 2,4 ± 2,8 0.52 ns Itching (P6c) 0,52 ± 1,2 1,64 ± 2,7 0,45 ± 1,2 0.0017 A-B <0.01 B-C<0.01 Nausea (P6a) 1,36 ± 2,2 1,14 ± 2,1 1,35 ± 3,1 0.32 ns Dizziness (P6d) 0,76 ± 1,7 1,6 ± 2,5 0,85 ± 1,8 0.06 ns
Pain wake up? (P16 v1) % 27,6 45,2 61,7 A-C <0.005
TERTIARY ENDPOINTS A B C
Information about treatment options (P10 v1) % 70,3 41,2 5 A-B <0.005
A-C <0.0001 B-C <0.0005
Allowed participation on treatment option (P10) 3,68 ± 3,6 3,59 ± 3,5 0,62 ± 1,8 0.001 A-C <0.001
B-C <0.001
Use of non pharmacological treatment (P12) % 39 34 22 ns
Table 32. Demographics, primary, secondary and two of the tertiary endpoints in patients undergoing orthopaedic surgery (involving hip or lower limb) and divided per Hospital. Hospitals are also indicated with letters A to C for the multiple comparisons through the Dunn’s and Chi-square with Yates correction tests. The p values for multiple comparisons are shown only when significantly different.