Department of Agriculture, Forestry, Nature, Energy Science and Technology
(DAFNE)
CIHEAM-Mediterranean Agronomic Institute of Bari
(MAIB)
H
YPERSPECTRAL
D
ISCRIMINATION OF
F
IRE
B
LIGHT
I
NFECTION IN
A
PPLE AND
P
EAR, AND
M
OLECULAR
T
YPING
OF
S
OME
M
EDITERRANEAN
I
SOLATES OF ITS
C
AUSAL
A
GENT
Erwinia amylovora
A dissertation submitted in fulfillment of the requirement for the degree of
Doctor of Philosophy
Plant Protection -Cycle XXVII- S.S.D. AGR/12
by
Yaseen
ALNAASAN
Coordinator and supervisor: Professor Leonardo VARVARO
Co-Supervisor: Anna Maria D’ONGHIA
Advisers:
Franco SANTORO
Franco
VALENTINI
Alfredo
FABI
I
disease of mainly apple and pear, and more than 200 commercially, ornamentally, and ecologically important rosaceous plant species grown in Italy and in other regions in the world. The lack of commercially effective control compounds, other than antibiotics which became prohibited almost worldwide, and the fast spread of fire blight make the disease prevention extremely important. Currently, the best fire blight management strategy is a combination of strict quarantine measurements, sanitation, cultural practices, chemical and biological sprays, and most importantly the vigilant regular monitoring. However, large-scale monitoring is difficult due to the huge number of trees to be inspected. E. amylovora is a genetically monomorphic pathogen, though its different stains have different pathogenicity, severity, and antibiotic resistance. Studying the genetic diversity of E. amylovora is therefore extremely important to track the infection sources, map the distribution of the severe strains, study the evolutionary, and improve resistant varieties against this quarantine pest.
The first aim in this study was to discriminate between healthy and fire blight-infected apple and pear plants using their hyperspectral reflectance, and to develop classification models capable of detecting the infection even in the asymptomatic plants. Multivariate analysis showed that hyperspectral data can effectively discriminate between healthy and infected (symptomatic and asymptomatic) apple and pear. Two classification models, Partial Least Squares-Discriminant Analysis (PLS-DA) and Artificial Neural Networks (ANNs), were developed in this study. These non-parametric models successfully classified the studied plants into healthy and fire blight-infected with high accuracy not only in the glasshouse but also in the open field.
The second aim in this dissertation was to genotype different strains of E. amylovora, collected from apple and pear in different regions mainly Mediterranean, using an updated set of polymorphic Variable Number of Tandem Repeats (VNTR) loci. Three new polymorphic loci were identified in the current study and added to other six loci, defined previously, to establish a set of nine VNTR loci to be used in a Multiple-Locus VNTR Analysis (MLVA). The improved MLVA approach recognized 38 haplotypes and seven Clonal Complexes from the studied strains, and demonstrated the high genetic diversity among the Mediterranean strains and among the Italian strains in particular suggesting the multiple introduction events of the disease.
Keywords: Erwinia amylovora, Hyperspectral remote sensing, non-parametric classification
models, Spectral Vegetation Indices, Partial Least Squares-Discriminant Analysis, Artificial Neural Networks, Variable Number of Tandem Repeats, Multiple-Locus VNTR Analysis.
II
malattia principalmente di pero e melo, e di più di 200 specie di piante rosacee importanti dal punto di vista commerciale, ornamentale, ed ecologico, che crescono in Italia ed in altre regioni nel mondo. La mancanza sul mercato di formulati di controllo efficaci, diversi dagli antibiotici che sono diventati proibiti quasi in tutto il mondo, e la veloce diffusione del colpo di fuoco rende la prevenzione della malattia estremamente importante. Attualmente, la miglior strategia di gestione del colpo di fuoco è una combinazione di severe misure di quarantena, sanitizzazione, pratiche colturali, spray chimici e biologici, e maggiormente importante il regolare monitoraggio. Tuttavia, un monitoraggio su larga scala è difficile a causa dell’enorme numero di alberi da ispezionare. E. amylovora è un patogeno geneticamente monomorfico, sebbene differenti ceppi mostrino differente patogenicità, severità e resistenza agli antibiotici. Studiare la diversità genetica di E. amylovora è quindi estremamente importante per tracciare i punti di origine dell’infezione, mappare la distribuzione di ceppi dannosi, studiare l’evoluzione e migliorare le varietà resistenti verso questo patogeno da quarantena.
Il primo obiettivo in questo studio è stato quello di discriminare piante di melo e pero fra sane e colpite da colpo di fuoco utilizzando la loro riflettanza iperspettrale, e sviluppare modelli di classificazione capaci di rilevare l’infezione anche in piante asintomatiche. L’analisi multivariata ha mostrato che i dati iperspettrali possono effettivamente discriminare tra meli e peri sani ed infetti (sintomatici ed asintomatici). Due modelli di classificazione, Partial Least Squares-Discriminant Analysis (PLS-DA) e Artificial Neural Networks (ANNs), sono stati sviluppati in questo studio. Questi modelli non parametrici hanno classificato con successo le piante studiate in sane e colpite da fuoco batterico con elevata accuratezza non soltanto in serra ma anche in pieno campo.
Il secondo obiettivo in questa tesi è stato di genotipizzare differenti ceppi di E. amylovora, isolate d melo e pero in diverse regioni principalmente Mediterranee, utilizzando un set aggiornato di loci Variable Number of Tandem Repeats (VNTR) polimorfiche. Tre nuovi loci polimorfici sono stati identificati nel presente studio ed aggiunti ad altri sei loci, precedentemente definiti, per stabilire un insieme di nove loci VNTR da usare in una Multiple-Locus VNTR Analysis (MLVA). Il migliorato approccio MLVA ha riconosciuto 38 aplotipi e sette complessi clonali per i ceppi studiati, ed ha dimostrato l’elevata diversità genetica tra gli isolati Mediterranei e quelli Italiani che in particolare suggeriscono eventi multipli di introduzione della malattia.
III
I wish to thank, first of all, the International Center for Advanced Mediterranean Agronomic Studies (CIHEAM) represented by the Mediterranean Agronomic Institute of Bari (MAIB) and Tuscia University represented by the Department of Agriculture, Forestry, Nature, and Energy Science and Technology (DAFNE) for giving me this precious opportunity and for their scientific efforts and contributions.
This dissertation would have remained a dream without the help and the support of my supervisors and advisers. Professor Leonardo VARVARO, the former director of the DAFNE department
,
for being my friend, guide, and philosopher. Anna Maria D’ONGHIA, the head of the Integrated Pest Management department in MAIB, for her continuous help and wise leadership. Franco SANTORO, Franco VALENTINI, and Alfredo FABI for their real help in developing the hyperspectral analysis part of the dissertation and for their encouragements. Angelo MAZZAGLIA, Giorgio M. BALESTRA, and their team for without their help in developing the molecular part I would have been lost.My deepest gratitude to Zurich University for Applied Science (ZHAW) represented by Fabio REZZONICO, University of Belgrade represented by Professor Aleksa OBRADOVIC, and Emilia-Romagna Regional Phytosanitary Services represented by Alessandra CALZOLARI for providing us with the required DNA material and for the field support. Many thanks to Prof. Ines DELFINO from the Department of Ecological science and Biology (DEB) in Tuscia University and Davide BALLABIO from the department of Earth and Environmental Science (DISAT) in University of Milano-Bicocca for their statistical advice. Big thanks also to Mr. Angelo FABBRI and Mr. Michele MANTOVANI the owners of studied orchards for their help and support. Sincere thanks to my friends Doriano VITTORI, Maria C. TARATUFOLO, Peter MOUBARAK, Giuseppe CAVALLO, Serena CIARRONI, Clelia TOSI, Rocco CARACCIOLO, Marsilio RENZI, Raied ABOU KUBAA, Farid AMMOURI, and Vincenzo TAGLIAVENTO for their precious help, continuous encouragement, and friendship.
IV
To the true angels in my life; my parents, Ibrahim and Ilham, brothers and sisters, and my dear wife Diana who have always stood by me throughout my PhD years;
To my lovely friends and colleagues everywhere;
To every researcher who works sincerely to contribute in the effort that makes our plant a better place to live in;
V
Riassunto ... II List of figures ... VII List of tables ... X List of abbreviations ... XI
Introduction ... 1
1.1. Fire blight and its causal agent... 2
1.2. Host range ... 8
1.3. Symptoms and signs ... 9
1.4. Fire blight monitoring ... 10
1.5. Fire blight detection and management ... 12
1.6. Epidemiology ... 15
1.7 Historical review of Erwinia amylovora... 15
Chapter 2 ... 18
Abstract ... 19
2.1. Introduction ... 20
2.1.1. Precision Agriculture ... 20
2.1.2. Spectral signature and Spectral Vegetation Indices (SVIs) ... 24
2.2. Materials and methods ... 28
2.2.1. Glasshouse trials ... 28
2.2.2. Field trials ... 32
2.2.3. Data analysis ... 37
2.3. Results and discussions ... 48
2.3.1. Artificial inoculation and laboratory tests ... 48
2.3.2. Hyperspectral discrimination ... 50
2.3.3. Classification models ... 60
2.4. Conclusions ... 81
Chapter 3 ... 83
VI
3.1.2. Multiple-Locus Variable Number of Tandem Repeats Analysis (MLVA) ... 86
3.2. Materials and methods ... 88
3.2.1. Bacterial strains and DNA quantification ... 88
3.2.2. VNTR loci mining and primer designing ... 90
3.2.3. PCR amplification and capillary electrophoresis ... 90
3.2.4. MLVA analysis ... 91
3.3. Results and discussions ... 92
3.3.1. VNTR loci selection and MLVA optimization ... 92
3.3.2. VNTRs characteristics ... 98 3.3.3. MLVA genotyping ... 101 3.4. Conclusions ... 106 References ... 107 Annexes... 121 Annex I... 121 Annex II ... 124 Annex III ... 127 Annex IV ... 130
VII
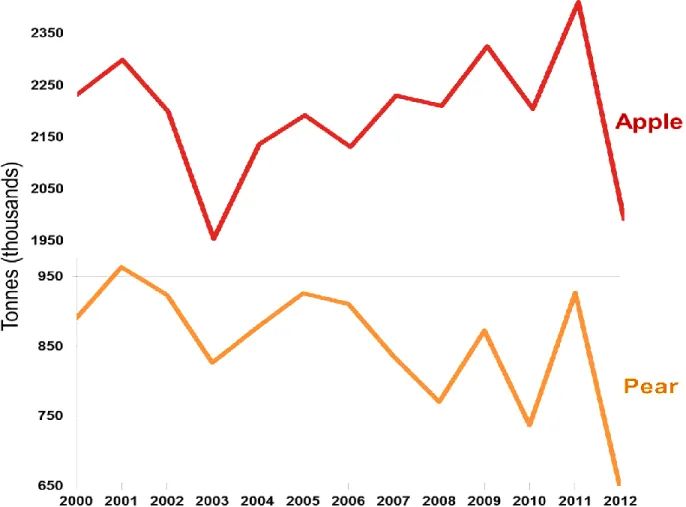
Figure 1 Apple (upper) and pear (lower) production in Italy in thousand tonnes in the period
between 2000 and 2012 (FAO, 2015). ... 1
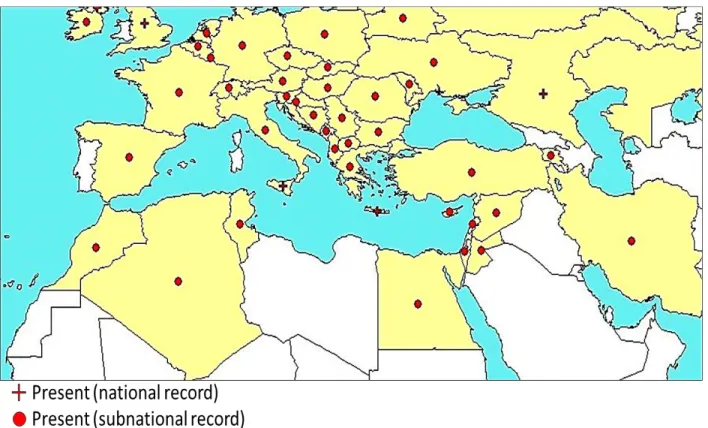
Figure 2 The distribution of fire blight disease in Europe, the Middle East, and North Africa
(EPPO, 2014). ... 2
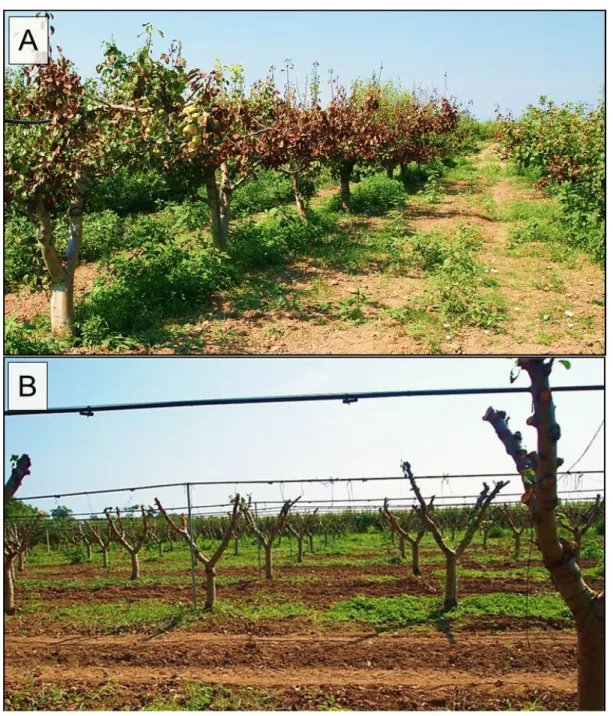
Figure 3 Two pictures demonstrate the fast and the aggressive manner of the fire blight infection
in a pear orchard in Barletta, Puglia in which the upper picture (A) was taken in 19 June 2013 and shows that severely infected orchard, and the lower picture (B) was taken 15-days after and shows the pruned dead trees before eradication. ... 3
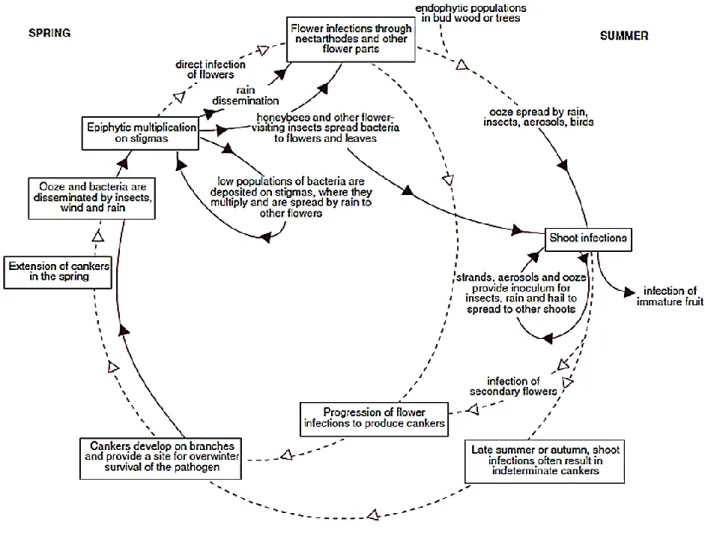
Figure 4 A schematic diagram of Erwinia amylovora detailed life cycle adapted from Thomson
(2000). The dashed arrows represent the movement of the bacteria inside the plants and the solid ones represent the movement outside the plants. ... 7
Figure 5 The six principal components of the Precision Crop Protection. ... 20 Figure 6 A schematic representations showing the main elements in satellite remote sensing
process... 22
Figure 7 A graphical representation of an electromagnetic wave showing the mutually
perpendicular electric and magnetic fields, the orientation of the wave, and the characteristic wavelength λ. ... 23
Figure 8 (A) A representation of the three possible pathways (transmission, absorption, and
reflection) of incident light energy on vegetation, and (B) a reprinted typical spectral reflectance curve (spectral signature) that is controlled by leaf pigments, cellular structure and water content of the vegetation (Gausman, 1977). ... 25
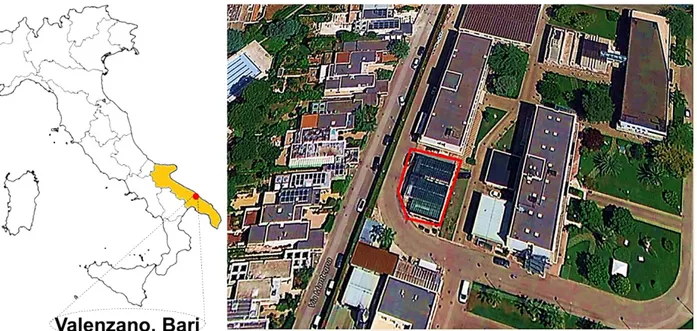
Figure 9 The location of the study area for the glasshouse trials on the Italian map (left), and an
aerial view of the quarantine glasshouse at MAIB (right). ... 28
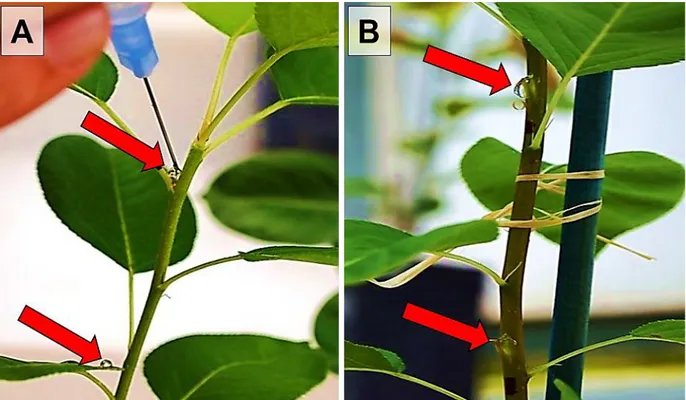
Figure 10 The artificial inoculation methods used in the glasshouse trials: (A) direct injection by
the bacterial suspension using a hypodermic needle and (B) cutting wounding by a sterile blade dipped in the bacterial suspension. ... 30
Figure 11 The hyperspectral acquisition system used for leaf reflectance measurements. (A)
ASD leaf-clip supplied with a halogen bulb, (B) optical fiber, (C) ASD FieldSpec®3 spectroradiometer, and (D) Instrument controller. ... 31
Figure 12 The location of the study area on the Italian map (left), and aerial view for the studied
fields (right): (A) a pear orchard in Copparo, Emilia-Romagna, and (B) an apple orchard in Formignana, Emilia-Romagna. ... 32
Figure 13 The hyperspectral acquisition system with the supporting system used for canopy
reflectance measurements. This system comprised: (A) ASD fore-optic pistol grip, (B) aluminum tripod, (C) optical fiber, (D) ASD FieldSpec® HandHeld2 spectroradiometer, and (E) instrument controller. ... 34
Figure 14 The special designed tripod that carry the pistol grip to mount the fore-optic above the
VIII
Figure 16 The general workflow of the performed research which mainly consists of three parts:
I) data acquisitions and preprocessing, II) test hyperspectral separability, and III) developing PLS-DA and ANNs classification models. ... 38
Figure 17 A box and whisker plot for 10 Spectral Vegetation Indices (SVIs) on original (a) and
standardized data (b); the upper and the lower lines in the large boxes are the 75th and 25th percentiles of the samples, respectively. The small boxes inside are the medians of the samples, and the extending lines from the boxes are called whiskers, and the values beyond those whiskers are detected as potential outliers. ... 41
Figure 18 A Receiver Operating Characteristic (ROC) curve created by plotting true positive
(sensitivity), and false positive rates (1 - specificity) of an example of a classification model at different thresholds. ... 45
Figure 19 Fire blight symptoms and signs resulted from the artificial inoculation in apple and
pear seedlings in the first glasshouse trial. These symptoms and signs include: (A) shepherd’s crook and wilted leaves, (B) tip wilting, (C) bacterial ooze, and (D) blackened areas on the leaves... 49
Figure 20 Average spectral curves of all compiled leaf reflectances, in the range 400–1800 nm,
from healthy and E. amylovora-inoculated apple and pear in the first glasshouse trial. The rectangular window in the left side of the plot shows a scoop of different reflectances around the green peak. ... 51
Figure 21 The scatterplots of the first two Principal Components (factors) scores resulted from
applying PCCA on healthy (green points) and fire blight-inoculated (red points) apple (left plot) and pear (right plot) in the first glasshouse trial. ... 53
Figure 22 The scatterplot of the first two Principal Components (factors) scores resulted from
applying PCCA on healthy (green points) and fire blight-inoculated pear (red points) in the second glasshouse trial. ... 54
Figure 23 Average curves of all compiled leaf and canopy reflectances, in the range between
400 nm and 1070 nm, from healthy-looking and fire blight-symptomatic apple and pear in the open field trial. ... 56
Figure 24 The scatterplots of the first two Principal Components (factors) scores for
healthy-looking (green points) and fire blight-symptomatic (red points) apple (left plot) and pear (right plot) in leaf field trial. ... 58
Figure 25 The scatterplot of the first two Principal Components (factors) scores for
healthy-looking (green points) and fire blight-symptomatic pear trees (red points) in canopy field trial. 59
Figure 26 The optimal combination of the spectral intervals selected by synergy interval-PLS to
be used for developing PLS-DA and ANNs models in apple glasshouse trial. The selected intervals (green ranges) are 450–500, 500–550, 1400–1450, 1600–1650, and 1750–1800 nm. .. 61
Figure 27 The error rates (red points), and the ratios of Not Assigned samples (black points) in
IX
variables. ... 63
Figure 28 The calculated responses for the infected class with the healthy (green points) and the
infected samples (red points) of the training dataset in apple glasshouse trial. The dotted redline indicates the infected class threshold (0.61). ... 64
Figure 29 The Receiver Operating Characteristic (ROC) curves (upper), and line plots of
sensitivity and specificity values (lower), blue and red respectively, as a function of classification threshold changing in the PLS-DA model of apple glasshouse trial. ... 66
Figure 30 The scores of the healthy and the infected plants on the first two latent variables,
which explained 100% of the total variance, in the PLS-DA model of apple glasshouse trial. ... 67
Figure 31 A bubble plot obtained by the Kohonen and CP-ANN toolbox for MATLAB (version
3.6), shows the optimized ANNs networks for RWs in the glasshouse trial of apple. The bubble in the upper right part of the plot, the red bubble of 10X10 neurons and 75 epochs was the best as it had high relative frequency and predictive performance. ... 69
Figure 32 The scores of the healthy and the infected plants (A) and the loading plots of the
tested SVIs (B) of the first two latent variables, which explained 64.58% of the total variance, in the PLS-DA model of apple glasshouse trial. ... 73
Figure 33 Analysis the DNA of two Erwinia amylovora strains with the VNTR locus Ea41 by
QIAxcel multicapillary electrophoresis system (QIAGEN, USA); the green bands in the gel images (the gray areas) represent the two bands (15 and 600 bp) of the alignment marker. ... 96
Figure 34 Minimum Spanning tree of MLVA profiles from the DNA of the 46 Erwinia amylovora strains and organized by their origin. Branch thickness indicates how many loci are different in the MLVA profiles of the connected nodes. Bold solid lines connect nodes that differ by one MLVA locus, thin solid lines connect nodes that differ by two MLVA loci and dashed lines connect nodes that differ by three MLVA loci. ... 102
Figure 35 Minimum Spanning tree of MLVA profiles from the DNA of the 46 Erwinia amylovora strains and organized by their year of isolation. Branch thickness indicates how many loci are different in the MLVA profiles of the connected nodes. Bold solid lines connect nodes that differ by one MLVA locus, thin solid lines connect nodes that differ by two MLVA loci and dashed lines connect nodes that differ by three MLVA loci. ... 104
Figure 36 Minimum Spanning tree of MLVA profiles from the DNA of the 46 Erwinia amylovora strains organized by their host plants. Branch thickness indicates how many loci are different in the MLVA profiles of the connected nodes. Bold solid lines connect nodes that differ by one MLVA locus, thin solid lines connect nodes that differ by two MLVA loci and dashed lines connect nodes that differ by three MLVA loci. ... 105
X
Table 1 Risk levels and categories of orchard infection history according to CougarBlight. ... 11 Table 2 The 30 Spectral Vegetation Indices (SVIs), reported to be correlated to plant biotic and
abiotic stress, which were calculated, standardized, and used in this research. ... 40
Table 3 The divided datasets in each apple and pear trial into training (about 75% of total
number of samples) and evaluation subsets (about 25% of the total number of samples) to be used for models calibration and performance assessment, respectively. ... 43
Table 4 Classification performance parameters [Non-Error Rate (NER), class Specificity (Sp)
and Sensitivity (Sn), and ratio of Not Assigned samples (NA)] obtained by RWs PLS-DA model in training and evaluation subsets (with five groups split in venetian blinds) of apple glasshouse trial. ... 68
Table 5 Classification performance parameters [Non-Error Rate (NER), class Specificity (Sp)
and Sensitivity (Sn), and ratio of Not Assigned samples (NA)] obtained by RWs ANNs model in training and evaluation subsets (with five groups split in venetian blinds) of apple glasshouse trial. ... 70
Table 6 Classification performance parameters [Non-Error Rate (NER), class Specificity (Sp)
and Sensitivity (Sn), and ratio of Not Assigned samples (NA)] obtained by PLS-DA and ANNs classification models for SVIs variables in apple glasshouse trial. ... 71
Table 7 Classification performance parameters [Non-Error Rate (NER), class Specificity (Sp)
and Sensitivity (Sn), and ratio of Not Assigned samples (NA)] obtained by PLS-DA and ANNs classification models for RWs and SVIs variables in apple field trial. ... 76
Table 8 Classification performance parameters [Non-Error Rate (NER), class Specificity (Sp)
and Sensitivity (Sn), and ratio of Not Assigned samples (NA)] obtained by PLS-DA, and ANNs classification models for RWs and SVIs variables in pear glasshouse trials. ... 78
Table 9 Classification performance parameters [Non-Error Rate (NER), class Specificity (Sp)
and Sensitivity (Sn), and ratio of Not Assigned samples (NA)] obtained by PLS-DA, and ANNs classification models for RWs and SVIs variables in pear field trials ... 80
Table 10 A list of the DNA from Erwinia amylovora strains which are collected used in this
study. ... 89
Table 11 The selected VNTR loci in the Erwinia amylovora CFBP1430 genome sequence by the
Tandem Repeats Finder program. ... 92
Table 12 List of designed primer pairs for the selected VNTR loci which were revealed from the
European reference strain CFBP1430 by the TRF program. ... 94
Table 13 The amplicon sizes of the selected set of the VNTR loci in the studied list of Erwinia amylovora strains. ... 97 Table 14 The list of the studied Erwinia amylovora strains and their MLVA profile. ... 99 Table 15 Characteristics of the selected set of VNTR loci in which D: Simpson’s diversity index.
VNTRs Ea55 and Ea56 are on the plasmid pEA29 and the other VNTRs are on the chromosome. ... 100
XI
~ Approximately MLVA Multiple-Locus VNTR Analysis
λ Wavelength mm Millimeter
°C Degree Celsius MST Minimum Spanning Tree
a.m. Ante Meridiem ms Millisecond
ANNs Artificial Neural Networks NA Not Assigned samples
ATCC American Type Culture Collection NDVI Normalized Difference Vegetation Index
BGI2 Blue Green Index 2 NER Non-Error Rate
bp Base pairs ng Nanogram
BRDF Bidirectional Reflectance Distribution
Function NGS Next Generation Sequence
CC Clonal Complex NIR Near-Infrared
CFBP Collection Francaise de Bacteries
Phytopathogenes NIRs Near-Infrared Spectroscopy
CFU Colony-Forming Unit nm Nanometer
cm Centimeter NPPO National Plant Protection Organization
CP-ANN Counter Propagation-Artificial Neural
Network NPQI Normalized Plant
CRISPR Clustered Regularly Interspaced Short
Palindromic Repeat p.m Post Meridiem
cv. Cultivar PA Precision Agriculture
D.M. Ministerial Decree PBI Plant Biochemical Index
DA Discriminant Analysis PC Personal Computer
DNA Deoxyribonucleic Acid PCA Principal Components Analysis
DPI Days Post-Inoculation PCCA Principal Components and Classification
Analysis
EMR Electromagnetic Radiation PCP Precision Crop Protection
EPPO European and Mediterranean Plant
Protection Organization PCR Polymerase Chain Reaction
ER Error Rate PLS Partial Least Squares
f Frequency PLS-DA Partial Least Squares-Discriminant
Analysis
FAO Food and Agriculture Organization pmol Picomole
FOV Field of View PRI Photochemical Reflectance Index
FPR False Positive Rate PSRI Plant Senescence Reflectance Index
FR Fluorescence Ration PWI Plant Water Index
GA Genetic Algorithm rDNA ribosomal DNA
GI Greenness Index REP Red Edge Position
GIS Geographical Information System RMSE Root Mean Square Error
GPS Global Positioning System RMSE
CV
Root Mean Square Error of Cross Validation
km Kilometer RNA Ribonucleic Acid
Kb Kilobase ROC Receiver Operating Characteristic
LAMP Loop-Mediated Isothermal Amplification rRNA ribosomal RNA
LVs Latent Variables RVSI Red Edge Vegetation Stress Index
m Meter RWs Reflectance Wavebands
Mb Mega base pairs s Second
MCARI Modified Chlorophyll (a and b) Absorption
in Reflectance Index SDW Sterilized Distilled Water
XII SR Simple Ratio
SSR Simple Sequence Repeat
SVIs Spectral Vegetation Indices
SWIR Short Wave Infrared
TPR True Positive Rate
TR Tandem Repeat
TRF Tandem Repeats Finder
VNTR Variable Number of Tandem Repeat
WGS Whole-Genome Sequence
1
Introduction
Apples (Malus spp.) and pears (Pyrus spp.), which are classified in Maloideae subfamily (family Rosaceae), and several other Maloid taxa have long been cultivated and valued for their distinctive fruit. Although the pomes of many Maloid genera are account for the economic importance and worldwide cultivation, several plants of this group are highly prized as garden ornamentals and have become a significant component of the nursery and landscape industry. Yielding more than 76.3 million tons and 23.5 million tons, apples and pears were listed among the top important fruit crops worldwide in 2012 (FAO, 2015). Italy is ranked among the major producing countries for these crops and the largest producer in Europe. However, apple and pear production fluctuated heavily in Italy due to the infection by some epiphytotic diseases in the last decades (Figure 1).
Figure 1 Apple (upper) and pear (lower) production in Italy in thousand tonnes in the period
2
1.1. Fire blight and its causal agent
Fire blight is the most serious bacterial disease on apple and pear, its causal agent [Erwinia amylovora (Burrill) Winslow et al., 1920] is one of the most important 10 plant bacterial pathogens ever (Mansfield et al., 2012). The economic impact of this disease is hard to determine, since low losses of a few flower clusters are negligible and a single outbreak can decimate orchards and subsequently stop the production for many years (Vanneste, 2000). Fire blight has caused several heavy losses around the world during the last decades. Between 1994 and 1999, a large number of outbreaks swept through Emilia-Romagna, Italy, and as a result more than 500000 fruit trees were rooted out (Calzolari et al., 1999). The importance of fire blight is increasing steadily because of its continuous spread across the continents to new regions where no infection was reported before, like Australia and Finland. Moreover, the fast spread of fire blight in a destructive manner wherein course of weeks it is capable of destroying whole orchards (Figure 2). Furthermore, no pesticide can effectively control the disease.
Figure 2 The distribution of fire blight disease in Europe, the Middle East, and North Africa
3
E. amylovora was recognized as the first bacterial plant pathogen by fulfilling Koch’s postulates in 1884. Although E. amylovora has been reported on European and Mediterranean Plant Protection Organization (EPPO) A2 list (pests which are locally present in the EPPO regions) as a harmful quarantine pest since 1975, fire blight is present in all the European countries and almost in all the countries around the Mediterranean basin (Figure 3).
Figure 3 Two pictures demonstrate the fast and the aggressive manner of the fire blight infection
in a pear orchard in Barletta, Puglia in which the upper picture (A) was taken in 19 June 2013 and shows that severely infected orchard, and the lower picture (B) was taken 15-days after and shows the pruned dead trees before eradication.
4
1.1.1 Erwinia species isolated from pome fruit trees
The genus Erwinia, named by the bacteriologist Erwin Frink Smith, has been reviewed several times. Many gram-negative, motile, aerobic-facultative, anaerobic, and non sporulated bacteria have been arbitrarily classified in the genus Erwinia on the basis of their ecological association with plants (Paulin, 2000). Recently, several studies have suggested the use of 16s rDNA sequences approach for identifying and resolving the taxonomic relationships among different species and groups of Erwinia. As a result, it was proposed that the genus Erwinia should be divided into four new genera: Erwinia, Pectobacterium, Pantoea, and Brenneria (Hauben et al., 1998; Kim et al., 1999). According to Hauben et al. (1998) the genus Erwinia comprises six species, E. amylovora (the type species of this genus), E. mallotivora, E. persicina, E. psidii, E. rhapontici, and E. tracheiphila; the genus Pectobacterium consists of four subspecies: E. carotovora (renamed as Pectobacterium carotovorum), E. chrysanthemi (renamed as Dickeya dadantii), E. cacticida, and E. cypripedii (renamed as Pectobacterium cypripedii); the genus Brenneria consists of six reclassified species: E. alni, E. nigrifluens, E. paradisiaca, E. quercina, E. rubrifaciens, and E. salicis. Finally, five species reclassified in the genus Pantoea: E. ananas, E. herbicola, E. milletiae, E. stewartii, and E. uredovora.
1.1.2 Pathogenic Erwinia species 1.1.2.1 Erwinia pyrifoliae
Kim et al. (1999) described this bacterium for the first time. It was also reported from Korea and Japan on pear trees (P. pyrifoliae and P. communis) with similar symptoms to fire blight. The pathogen was classified as a different species from E. amylovora by DNA hybridization assays (Kim et al., 2001).
1.2.1.2 Erwinia piriflorinigrans
E. pirifloringrans has been reported only in Valencia, Spain until now (Roselló et al., 2002; López et al., 2011). It develops fire blight symptoms on blossoms solely. 16S rRNA sequence studies demonstrate high genetic similarity to E. amylovora, E. pyrifoliae, E. tasmaniensis, and E. billingiae. On the other hand, DNA-DNA hybridization resulted in classifying this bacterium as a new species (López et al., 2011).
1.2.1.3 Erwinia uzenensis
This pathogen was reported only on European pear trees in Japan with similar symptoms to those of E. amylovora. G-C content of DNA, the fatty acid profile, and phenotypic characteristics E. uzenensis resembled those reported previously for members of the genus Erwinia. Nevertheless, DNA-DNA hybridization confirmed that the pathogen represents a novel species (Matsuura et al., 2012).
5
1.2.2 Non-Pathogenic Erwinia species 1.2.2.1 Erwinia billingiae
E. billingiae was isolated, from different hosts, in different European regions by Billing and Baker (1963) and described later by Mergaert et al.,(1999). Conventional biochemical tests, BIOLOG metabolic fingerprinting system, fatty acid analysis, and 16S rRNA gene sequence studies showed that the bacterium is belong to the genus Erwinia but represents a novel species (Mergaert et al., 1999).
1.2.2.2 Erwinia tasmaniensis
This species was isolated from apple and pear trees in three regions in Australia (Geider et al., 2006). A polyphasic approach, which includes microbiological and API assays as well as fatty acid methyl ester analysis, DNA-DNA hybridization, and DNA sequencing, was later used to characterize the non-pathogenic E. tasmaniensis. Additionally, 16S rRNA gene sequence demonstrated E. tasmaniensis bacterium as a novel species (Geider et al., 2006).
6
1.1.2 Disease cycle 1.3.1 Overwintering
E. amylovora overwinters in the holdover cankers which were formed previously in the last season (Figure 4). Once the temperature goes higher in spring, the bacteria in the margin of the cankers become active again. The released bacteria on the surface of the bark are the most probable origin of the inoculum to start the fire blight spring cycle (Sherman, 2000). Sometimes the released cells are visible as bacterial ooze onto cankers’ surface which helps in the dissemination of the pathogen from cankers to open flowers. The bacterial ooze is a characteristic sign for E. amylovora, it is composed of viable bacterial cells embedded in a polysaccharide matrix (Van der Zwet and Keil, 1979). These bacterial cells can survive in low humidity conditions, in the dry exudates, for over a year (Sherman, 2000). Wind, rain splash, and passerby insects (like flies and ants) can easily transmit the bacteria from ooze, on cankers, to flowers. Although several insects can vector E. amylovora, there is no evidence in the literature about the role for honeybees (Apis mellifera L.) in the primary dispersal of inoculum, as honeybees have never been reported to visit the ooze. On the contrary, honeybees might be important vectors for biological agents (Nuclo et al., 1996), so the role of these insects in the primary infection remains uncertain.
As the bacteria reach flowers, they colonize epiphytically the nutrient-rich stigmas. During the later phase, which is called the floral epiphytic, the population size of the pathogen is directly influenced by the temperature and the number of blossoms in which the pathogen become established. Temperature regulates the generation time of E. amylovora, and honeybees and other pollinating insects help increasing the number of contaminated blossoms.
1.3.2 Primary and secondary infections
Blossom blight, or the primary infection, starts when E. amylovora cells are washed externally from the stigma to the floral cup (hypanthium), and then they enter the plant through secretory cells called nectarthodes (Thomson, 2000). In plants that tend to produce nuisance (secondary blossom), like some pear species, the blossom blight importance expands long after blooming. On the other hand, secondary infections occur in shoot, fruit, and rootstock. They start from the primary inocula produced on diseased tissues as a result of blossom infection. Wounds are generally required to initiate shoot and fruit blight. Various insects, strong winds, rain, and hail can create numerous wounds in host tissues. Apple rootstock blight can result from shoot blight on water sprouts or from internal translocation of E. amylovora infections from the top of the tree.
7
1.3.3 Canker expansion
In summer, both infections (primary and secondary) can expand with ultimate severity based on the host species, cultivar, age, and the environment conditions. Young tender tissues and trees are more susceptible to the disease than older ones. Excessive nitrogen fertilization and irrigation can enhance the occurrence of the developing cankers.
Figure 4 A schematic diagram of Erwinia amylovora detailed life cycle adapted from Thomson
(2000). The dashed arrows represent the movement of the bacteria inside the plants and the solid ones represent the movement outside the plants.
8
1.2. Host range
E. amylovora is a unique pathogen and its strains are not host species-specific. For instance, most strains isolated from apple are pathogenic on pear, other Maloideae (family Rosaceae) subfamily species, and Prunus species. Strains isolated from Rubus species, on the other hand, are nonpathogenic on apple or pear (Timur Momol and Aldwinckle, 2000). Fire blight has broad host range within the plant family Rosaceae, in which the pathogen induces symptoms on 200 species in 40 Rosaceous genera (Van der Zwet and Keil, 1979). E. amylovora is well known as a pathogen of the four Rosaceae subfamilies members which are Maloideae (Pomoideae), Rosoideae, Amygdaloideae, and Spiraeoideae. Fire blight affects also other fruit crops and ornamental plants such as: Amelanchier alnifolia (serviceberry), A. canadensis, Chaenomeles spp. (Japanese quince), Cotoneaster spp. (cotoneaster), Crataegus spp. (hawthorns), Cydonia spp. (quince), Eriobotrya japonica (loquats), Mespilus germanica (medlars), Pyracantha spp. (firethorns), Pyrus amygdaliformis (almond-leaved pear), Sorbus spp. (mountain ash), and Stranvaesia davidiana (Chinese stranvaesia) (Timur Momol and Aldwinckle, 2000). Some researchers divided E. amylovora strains into two main groups according to their host specificity. The first group, Spiraeoideae-infecting strains, infects a large number of the subfamily Spiraeoideae such as apple, pear, hawthorn, and cotoneaster. The second group, which referred to as Rubus-infecting strains, infects host plants in the genus Rubus such as raspberry and blackberry (Braun and Hildebrand, 2005).
Fire blight was unexpectedly reported to infect plum trees naturally. The earliest report was on a Japanese plum tree (Prunus salicina L.) in the United States of America (USA; Rosen and Groves, 1928). During the summer of 1993, an extensive outbreak was reported on Japanese plum orchard in the USA, and recently it was reported on European plum trees (Prunus domestica L.) from Germany (Vanneste et al., 2002) and Hungary (Végh et al., 2012).
9
1.3. Symptoms and signs
Blossom blight: the earliest symptom of the disease occurs on flowers. Blossoms appear discolored (water soaked, gray green progressing to black) before they turn necrotic. The dead blossoms may, or may not, remain attached to the tree, and under high humid conditions the infected blossoms exude drops of ooze (Steiner, 2000).
Shoot blight: the infection of shoots is always rapid and first apparent in the actively growing young leaves on the tips of the shoots. Leaves on diseased shoots often show blackening along the midrib and veins before becoming fully necrotic. Occasional spots on older leaves may also appeared on leaves, but the typical wilting and ooze production do not develop on fully expanded leaves until after the tip has expressed symptoms. Sudden fire blight infection which is induced by severe weather are sometimes called trauma blight (Johnson, 2000).
Fruit blight: symptoms on fruit varied according to the time of the infection. In the early infection (immature fruit), infected fruit keep small in size, become discolored, shrivel, blackened, and remain attached to the tree. In the late infection, the infected fruit remain fresh looking and do not become discolored. Infected fruit may also exude large amounts of bacterial ooze in humid conditions (Johnson, 2000; Steiner, 2000).
10
1.4. Fire blight monitoring
The most effective tool to prevent disease dissemination to new areas is the vigilant monitoring. Fire blight symptoms should be frequently inspected in pome fruit orchards and subsequently destroying the infected material.
1.4.1. Remote sensing detection
Remote and proximal sensing (Multispectral and Hyperspectral, respectively) have been used to detect, monitor, and quantify a range of diseases in different crops (Alnaasan, 2012). Remote and proximal sensing techniques allow also the replacement of time-consuming manual digitizing with more reliable automatic mapping procedures, thereby providing useful information on agricultural operations for updating regional databases as well as delivering a valuable aid to identify orchards and to position fruit trees individually (Santoro et al., 2009; Santoro et al., 2011). In 2006, Spinelli and others applied Near-Infrared spectroscopy (NIRs) to discriminate between fire blight-symptomatic and asymptomatic pear trees but no discrimination was obtained.
1.4.2. Fire blight risk assessment models
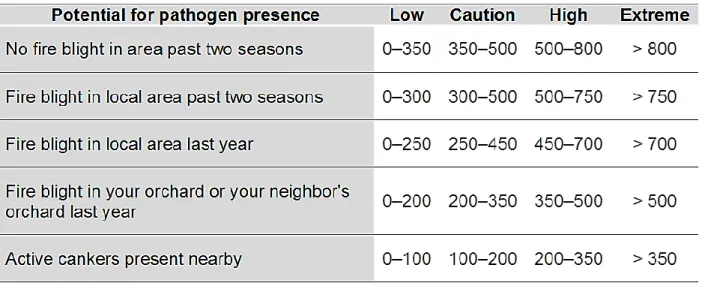
The fire blight disease cycle contains several phases: canker blight, blossom blight, shoot blight, and fruit blight. To stop the continuous dissemination later in the season, it is crucial to control blossom blight by chemical or biological intervention as early as possible. Until recently, predicting the start of blossom blight epidemics accurately and reliably, for timely spray applications, has been one of the most limiting factors in improving fire blight management. Several models to predict the disease on apples and pears have been developed and used, though MARYBLYT and CougarBlight are the best-know systems. These models were originally developed in the USA, and both of them use weather and apple, or pear, phenology to generate infection predictions, but they differ in how risk values are calculated (Dewdney et al., 2007). MARYBLYT, which was developed in Maryland and West Virginia by Steiner and Lightner (1990b;a), basically predicts both infection and symptoms development in the different fire blight phases. For instance in case of apple blossom blight, the infection is likely to be imminent, hypothetically, when the minimum values of the following four conditions are met in sequence: (I) flowers must open with healthy stigma and petals, (II) accumulation of at least 110 DH > 18.3 °C [Degree-Hours (DH): number of hours above a given temperature threshold] within the last 44.4 DD > 4.4 °C [Degree-Days (DD): a measure of how much (in degrees) and for how long (in days) the outside air temperature was above a given temperature threshold], (III) occurrence of precipitation or dew ≥ 0.25 mm on the current day, or ≥ 2.5 mm during the previous day, (IV) average daily temperature ≥ 15.6 °C (Steiner, 1990a).
11
CougarBlight was developed to predict fire blight (blossom blight) on apples and pears by Timothy J. Smith in Washington State (Smith, 1999). Unlike other fire bight models, the inoculum pressure (the estimate of overwintering inoculum) is considered in the CougarBlight prediction process. Although the inoculum pressure cannot be measured, the infection history of an orchard is used as an indicator of the inoculum pressure. The used categories of the infection history (potential for pathogen presence) in CougarBlight are given in Table 1. Within every inoculum pressure category four risk levels (low, caution, high, and extreme) are assigned based on a 4-day DH > 15.5 °C. Most growers consider management action when the risk level reaches high or extreme category (Dewdney et al., 2007).
12
1.5. Fire blight detection and management
E. amylovora can be detected and identified by several methods and techniques, though the most known and commonly used tests are:
Conventional and biochemical tests which basically include streaking or plating the bacteria onto non-selective or semi-selective substrates. Other conventional identification methods are made by the physical examination of the morphological characteristics of the colony. A well-known group of biochemical key tests are commonly used to identify E. amylovora. These tests include Levan production, tobacco hypersensitivity, fluorescence on King’s B substrate, and agglutination tests.
Serological tests are less used in the regular detection of E. amylovora, though the most common tests are: Enzyme-Linked Immunosorbent Assay (ELISA), lateral flow Immunoassay, slide agglutination, and Immuno-Fluorescence (IF).
Molecular tests are widely used in the detection and the identification of E. amylovora. PCR-based methods such as repetitive element palindromic PCR (rep-PCR), Amplified Fragment Length Polymorphism (AFLP), fluorescent-AFLP (Yaich et al., 2011), Random Amplified Polymorphic DNA Fragment (RAPD) analysis, and Short Sequence Repeats (SSR) are intensively used for fire blight detection and for the molecular investigations on genetic variability among strains. Recently, Loop-Mediated Isothermal Amplification (LAMP) has been successfully developed and used as a rapid detection method (Notomi et al., 2000). Besides the mentioned molecular diagnostic methods, new discriminatory markers to subdivide E. amylovora have been developed successfully. Multiple-Locus Variable Number of Tandem Repeats Analysis (MLVA) and Clustered Regularly Interspaced Short Palindromic Repeat (CRISPR) analysis (Rezzonico et al., 2011; Bühlmann et al., 2014) are the best example of these discriminatory markers which are needed to: (I) test whether outbreaks have a common source, (II) track the epidemic and the pandemic spread of particular strains, and (III) reconstruct the disease evolutionary history (Achtman, 2008).
13
1.5.1. Quarantine measurements
Fire blight is difficult to control and nearly impossible to eradicate when the infections are established in a given area. In countries that are considered a fire blight-free, E. amylovora spreading must be controlled by strict quarantine legislations on both national and regional level, and nursery stock and fruit importing should also be restricted from countries with fire blight risks and outbreaks.
According to the Italian Ministerial Decree 356/99, fire blight control is mandatory in all Italian territories to prevent new introductions and spread. Establishing several strict procedures, the decree was issued in 1999. These procedures include: (I) performing fire blight official systematic investigation on defined plant genera with particular attention to nurseries, (II) setting up monitoring networks in both public and private areas, (III) reporting the contaminated areas with immediate destruction of symptomatic plants, and in case of an outbreak all symptomatic and asymptomatic plants must be destroyed on a radius of 10 m, (IV) creating a safety zone of at least 3.5 km2 (1 km radius around the outbreak point), (V) prohibiting plant materials trade or beehives movement in the reported areas for at least 12 months, and lastly (VI) the phytosanitary services frequently monitor and investigate to decide the retention or the displacement of the protected zones (M.D., 1999).
1.5.2. Cultivar selection
Selection of a resistant cultivar is the most effective method to control fire blight. In apple, for example, some cultivars are moderately resistant to the disease (e.g. Red Delicious and Golden Delicious). For pears, cultivar choices are limited because superior horticultural traits (e.g. taste, storage, and marketing qualities) have been difficult to combine with higher levels of disease resistance (Johnson, 2000).
14
1.5.3. Orchard sanitation
Removing of expanding and overwinter cankers is essential for fighting against fire blight in apple and pear. Elimination of holdover cankers is accomplished by inspecting and pruning trees during winter. In spring and summer, established infections are principally controlled by bloom thinning and pruning. Effective control through pruning requires the cutting at approximately 20–25 cm below the visible end of the expanding canker (Johnson, 2000). Generally, pruning should be done by cutting, in the healthy-looking area, about 30–70 cm below the infection site using disinfected tools (by alcohol or bleach solution). Recent study showed that E. amylovora can survive in apple dead leaves for five months, so special attention should be paid to eliminate the dead leaves in orchards (Sobiczewski et al., 2013).
The rate of fire blight canker development can be decelerated by slowing the tree growth rate, which includes plant growth regulator (e.g. prohexadione calcium), withholding irrigation water, nitrogen fertilizer, and cultivation (Deckers and Daemen, 1993). Similarly, practices that reduce tree wounding and bacterial movement can reduce secondary infection. These practices include controlling insects, setting windbreaker and hail preventing net, limiting use of limb spreaders (which are woody or plastic rods used to spread tree’s limbs and extend the canopy volume) in young orchards, and avoiding the use of overhead sprinklers.
1.5.4. Dormant and blossom spray
In apple and pear orchards with a history of severe fire blight, it is advisable to carefully prune out overwintering cankers and spray with a copper and oil mixture at the delayed dormant stage. Copper compounds can be phytotoxic if they are sprayed after the bud burst stage. This spray is thought to reduce the levels of primary inoculum in the orchard, but may also be effective in reducing insect vectors (Steiner, 2000).
Concerning blossom spray, all sprayed products are ineffective in controlling fire blight unless they are applied within a very narrow timing period. E. amylovora colonies establish daily on newly opened untreated flowers. The effective control product must be applied into each flower within a day or two of its opening to protect it adequately from infection. Spraying during blossom is difficult, as many other important sprays are being applied at this time, and sprayers may be risky (Steiner, 2000). Antibiotics, which are currently restricted in too many countries, and fixed copper (copper oxychloride sulfate) sprays are effective in reducing fire blight once they are properly applied at correct times (Deckers et al., 1990). They are only preventive sprays and their application must be repeated every four to five days as long as new flowers are opening.
15
1.5.5. Biological control
The biological agents, for fire blight control, are considered the only exception to the narrow-timing spray particularly during blooming. The sprays of living organisms are applied to newly opening flowers during the two–four days of warming weather leading up to an actual infection event. Technically, the potential infection periods must be anticipated to use these biological products effectively. Several biological control compounds (antagonistic bacterial competitor e.g. Pantoea agglomerans and Pseudomonas fluorescens) have recently been licensed for fire blight management (Vanneste et al., 2004). Biopro® and Serenade Max® are newly registered products, which are produced based on Bacillus subtilis strains, for fire blight control in Europe. More important is the use of Aureobasidium pullulans, which is a live formation yeast commercialized in Germany few years ago (Kunz et al., 2011), as an alternative to streptomycin to protect blossoms for fire blight infection.
1.6. Epidemiology
E. amylovora spreads in several ways and the main routes are: importing infected propagating materials, migratory birds may harbor the pathogen, deposition of aerosols, and rain splash carried by air current (Mazzucchi et al., 1993). However, it has not been confirmed that migratory birds are involved in the long-distance dissemination of E. amylovora, but the movement of nursery plants and grafting materials from asymptomatic infected plants (symptomless carriers) into regions considered free of fire blight contribute effectively in this type of dissemination.
The primary fire blight foci resulted from the later mentioned routes have a random distribution, whereas for the secondary foci they are distributed according to a disease tendency in the main directions (Burdon, 1987; Mazzucchi et al., 1993).
1.7 Historical review of Erwinia amylovora
Fire blight bacterial disease has been reported from 55 countries around the world (EPPO, 2014). The story of this dangerous disease began when the disease has spread from its original site the Hudson Valley in New York, USA through the North American countries and the Pacific coast, Europe, and the Middle East during the past years (Bonn and van der Zwet, 2000).
16
1.7.1. World
1780: Denning (1794), the earliest recorded observation of fire blight disease in Hudson valley of New York, USA.
1890: McMichael (1890) reported, for the first time, pear blight disease on pear in Waterford, Canada. The disease was recorded as personal observations of fire blight by a pear grower during the previous 25 years.
1938: Waterston (1938), the first report of E. amylovora, on loquat branches at blooming, in the Bermuda islands a territory of the UK in the North Atlantic Ocean.
1903: Bonn and van der Zwet (2000) mentioned the first report of fire blight, on both apple and pear, outside the North America in one Japanese island.
1958: Crosse et al. (1958), the first authenticated record of fire blight disease in Europe, in which it was reported on pear trees near Maidstone, England.
1960 till now, fire blight was reported in Eastern Europe, from Greece, Armenia, Bulgaria, Romania, and former Yugoslavia (Serbia, Bosnia, and Croatia). Also it was confirmed to be present in other countries like Albania, Spain, and Australia (Vanneste, 2000). Recently, the disease was recorded in Algeria and Tunisia (Laala et al., 2012; Rhouma et al., 2014).
1.7.2. Italy
1980: Calzolari et al. (1982), E. amylovora live cells were found in a lot of asymptomatic apple trees imported from the Netherlands.
1981–1983: Calzolari et al. (1984), the first monitoring for fire blight in the region without any finding 1981–1983.
1990: Cariddi and Piglionica (1990; 1990), first record of fire blight in Italy. The bacteria were found on pear in two isolated areas of 500 km2 in Apulia region, particularly on cultivars Guyot, Bella di Giugno, Williams, and conference.
1991: Mazzucchi et al. (1993) and Mazzucchi (1994), a fire blight national monitoring network was set up for early detection of primarily foci after spread. This network was divided into three interregional sub-networks (Northern, Adriatic, and Tyrrhenian) and two islands (Sicilia and Sardegna). In 1992, the monitoring network was completed and consisted of 3601 points, each point had at least one E. amylovora-susceptible host at about five km interval. Fire blight symptoms were therefore inspected twice a year (May-June and September-October).
1991: Cariddi (1993), E. amylovora was found in one orchard of local pear in Sicily and that was the first reported outbreak of the disease in Sicily, the single detected focus was officially directly eradicated.
1994: Griffo et al. (1998), two fire blight limited foci were identified as the first report of the disease in Caserta, Campania. The two foci were eradicated to stop the disease spreading.
17
1994–1997: Calzolari et al. (1999), two E. amylovora foci were found in Emilia-Romagna region, Bologna in 1994. One focus in commercial pear orchard in Casale and the other in four nurseries in Minerbio area, where the distance between the two areas was nearly 10 km. later after this detection, six cases of fire blight were detected in 1995 and 30 cases in 1996 in the same area. In 1997 a fire blight outbreak occurred as a total of 721 foci were officially identified on both pear (90%) and ornamental plants (10%), as a result of this outbreak approximately 500000 fruit trees were destroyed including 370000 pear trees in nurseries and orchards.
1999: The Italian Ministerial Decree (D.M. 356/99) on the mandatory control of fire blight was issued after the epidemics of 1994. This national regulation lay down the measures for occurrence of new foci in new areas, infected plants (in orchard, nursery, and wild environment), marketing of propagating materials, and even the movement of beehives.
2002: Clabassi et al. (2002), the first report of fire blight in Friuli-Venezia Giulia region on pear orchard.
2003: Gianetti et al. (2004), fire blight reported in Piemonte on cotoneaster.
2005: NPPO of Italy (2005), E. amylovora was found on Malus in the ‘Valle di Non’ province of Trento (Trentino-Alto Adige region).
2009: NPPO of Italy (2009), fire blight was detected in a few plants of hawthorn and pear in Lombardia
.
2012: Pucci et al. (2013), fire blight was reported for the first time in Latium on a quince plant.
18
Chapter 2
Hyperspectral discrimination of fire blight
infection in apple and pear
19
Abstract
Fire blight is a capricious bacterial disease that can destroy apple and pear orchards in a single season. Until 2015, no known cure for this disease was found, and all successful control strategies rely on prevention, eradication, and containment measurements. Although early detection and frequent monitoring are fundamental tools in any effective management strategy of fire blight, asymptomatic infections and the enormous number of trees reduce the efficiency of these tools dramatically. Moreover, large-scale monitoring needs endless time, huge budget, and a large number of workers. The only available data source that provides access to systematic observations at scales ranging from local to global is remote and proximal sensing. The role of remote sensing is therefore indispensable in all the efforts to improve new tools that help in detecting stressed plants through their reflectances and ensure vigilant monitoring for countless number of trees. This study aims at exploring the potential of hyperspectral sensor systems for detecting fire blight infections, symptomatic and asymptomatic, on apple and pear, and subsequently developing of predictive models that can recognize the fire blight-infected plants. Hyperspectral reflectance data were capable of discriminating between healthy and fire blight- infected (symptomatic or asymptomatic) apple and pear plants in glasshouse and field trials. Furthermore, Partial Least Squares-Discriminant Analysis (PLS-DA) and Artificial Neural Networks (ANNs) classification models were successfully built, based on Reflectance Wavebands (RWs) and Spectral Vegetation Indices (SVIs), and the performance of each model was evaluated in terms of non-error rate, sensitivity, and specificity. PLS-DA and ANNs models resulted in high sensitivity to fire blight-infected plants, though PLS-DA outperformed ANNs models specially the models developed from the SVIs. The current research shows the hyperspectral reflectance with classification models can be used as an effective tool in fire blight detection and surveillance on large-scales.
20
2.1. Introduction
2.1.1. Precision Agriculture
Precision Agriculture (PA), or site-specific crop management, is a relatively new concept that can be defined by innumerable series of definitions. However, one of the first and most significant definitions was proposed by Blackmore (1994): the use of information technologies to obtain knowledge about important crop parameters, and consequently optimize the management of the production system on an appropriate scales. PA tries particularly to increase crops productivity by the efficient use of natural resources (such as land, seeds, and water) and agriculture practices such as plant protection (Precision Crop Protection; PCP), fertilization, cultivation, and other practices. Today, PA is totally motivated by many economic issues including the cost reduction of large-scale monitoring of plant diseases, and the reduction of fuel consumption. Moreover, PA is motivated by environmental concerns such as the excessive use of chemicals and other agricultural inputs (Suzuki et al., 2002).
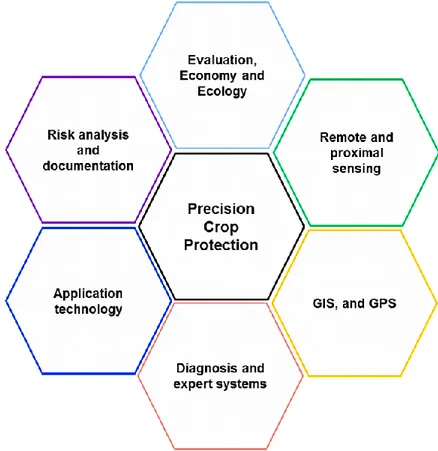
PCP requires spatial and temporal information on the within-field heterogeneity of crop growth conditions. These data are collected, managed, analyzed, and implemented by six main technologies and tools that are illustrated in Figure 5.
21
Commonly, remote and proximal sensing technologies are extremely important to collect spatial and spectral data about plant vitality, stress, pest monitoring, and other aspects. Geographical Information System (GIS) is useful for the management and the handling of spatial data. These collected data must be georeferenced by using Global Positioning System (GPS), and then they are organized and optimized in expert systems (informatics systems) for the previously developed models, and control techniques and strategies (Decision Support System).
2.1.1.1. Remote and proximal sensing in plant protection
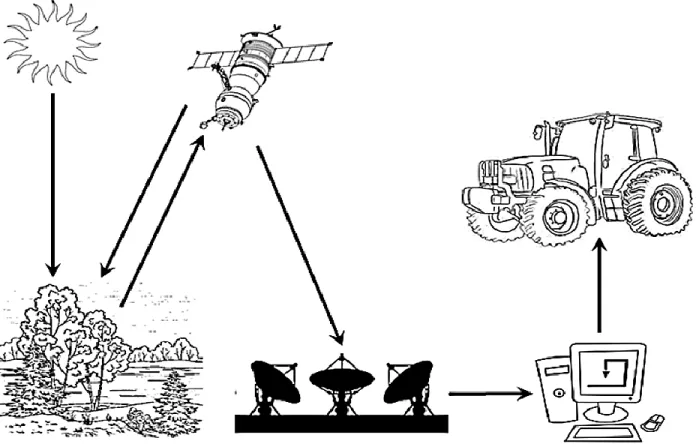
Remote and proximal sensing can be broadly defined as the process of acquiring information about an object, area, or a phenomenon through the analysis of data acquired by sensors that are not in a direct contact with that object, area, or phenomenon (Lillesand et al., 2008). In proximal sensing, the distance between the sensor and the object of interest is usually less than, or comparable to, the dimensions of the sensor, whereas this distance is vastly higher in case of remote sensing. The process of remote sensing based on six elements, illustrated in Figure 6, including:
Energy source: a fundamental component for remote sensing to provide the target with the required energy such as the sun radiation or any artificial light source.
Sensors: usually mounted on satellite, drone, or aircraft, sensors are basically classified according to their energy source into active sensors (emit their own electromagnetic energy and record the reflected energy) and passive sensors (record the reflected or radiated energy from naturally illuminated targets).
Target: the radiation interacts differently with the target, depending on the nature of the target and the radiation properties.
Reception and transmission: the reflected energy from the target is received and recorded by sensors, and then the recorded data are transmitted to receiving stations to be preprocessed and stored in digital form.
Analysis and interpretation: the data analyzed and interpreted using special instruments and pieces of software to extract the information from the target. Specialist and experts use these pieces of information to solve particular problems and to apply the relevant solutions and applications.
Application: the remotely sensed data are widely used in several applications and the main three levels for application are: (I) mapping and monitoring of natural resources, (II) determining the bio-geo-physical parameters, and (III) Decision Support System.
22
Figure 6 A schematic representations showing the main elements in satellite remote sensing
process.
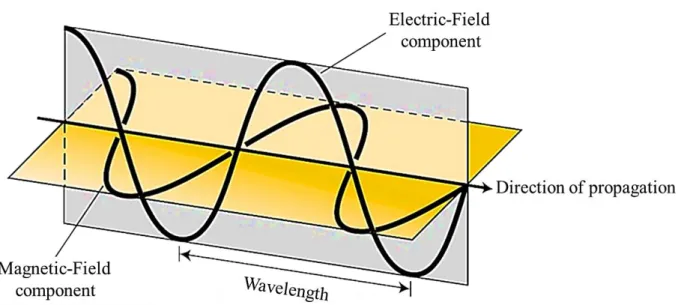
Remotely and proximally sensed data are collected in different forms and sizes, such as force-field, acoustic energy, and Electromagnetic Radiation (EMR). However, EMR waves are the most used type, as depicted in Figure 7 its waves comprise both electric and magnetic fields perpendicular to each other and perpendicular to the direction of energy propagation. The range of all electromagnetic waves, which are arranged according to their frequency (f) and wavelength (λ), is called Electromagnetic Spectrum. This spectrum extends from short wavelengths (extremely high frequency) gamma radiation that measure less than 10-12 m to radio waves (low frequency) which can measure thousands of kilometers. Although the visible portion of electromagnetic wavelengths was the original form of remote and proximal sensing, the technology development has enabled the obtaining of information from other wavelength including Near-Infrared (NIR), thermal infrared, and microwave. The data are commonly collected either over a small number of wavelength bands (multispectral data) or over a large number of bands (hyperspectral data).
23
Figure 7 A graphical representation of an electromagnetic wave showing the mutually
perpendicular electric and magnetic fields, the orientation of the wave, and the characteristic wavelength
λ
.Today, several remote and proximal sensing models can be successfully applied to estimate crops acreage and production, crop nutrient deficiency detection, crop condition assessment, crop yield modeling, soil mapping, and most importantly in plant disease detection. Norman and Fritz (1965) used the infrared photography successfully to detect diseased and declined citrus trees in Florida, USA. Same technology was also used for locating nematode infestation (Rotylenchulus reniformis Linford and Oliveira) in cotton fields in Texsas, USA (Heald et al., 1972). Later, in 1989, Lorenzen and Jensen noticed an increase in the reflectance, in the visible wavelength, of barley leaves infected by powdery mildew due to the degradation of chlorophylls.
The global potential loss, in some crops, due to pests ranged from 50% in wheat to more than 80% in cotton production (Oerke, 2006). Luckily plant protection measures can prevent or reduce crop loss. However, the excessive use of pesticides for protecting crops will increase not only the cost of production, but also raises the danger of toxic residue in nature and in agricultural products. Early detection of plant pests is critical to prevent plant diseases and stress and therefore to minimize acute and chronic loss of productivity. Furthermore, the control success and effectiveness depends directly on fast identification and local treatment of the plant disease which requires collecting the disease information in the field as early as possible. Although manual field survey is the most common method for disease identification, it is time consuming, inefficient, and requires high labor cost. Thus, manual inspection for plant diseases is definitely impractical in large areas. Remote and proximal sensing, fortunately, can provide us with the necessary information about the spatial distribution of crop disease over large areas.