Received: October 22, 2018. Accepted: February 22, 2019. Pre-published: February 28, 2019.
©2019 Ferrata Storti Foundation
Material published in Haematologica is covered by copyright. All rights are reserved to the Ferrata Storti Foundation. Use of published material is allowed under the following terms and conditions:
https://creativecommons.org/licenses/by-nc/4.0/legalcode. Copies of published material are allowed for personal or inter-nal use. Sharing published material for non-commercial pur-poses is subject to the following conditions:
https://creativecommons.org/licenses/by-nc/4.0/legalcode, sect. 3. Reproducing and sharing published material for com-mercial purposes is not allowed without permission in writing from the publisher.
Correspondence:
COSIMA T. BALDARI [email protected] LAURA PATRUSSI [email protected]Haematologica
2019
Volume 104(10):2040-2052
doi:10.3324/haematol.2018.209981 Check the online version for the most updated information on this article, online supplements, and information on authorship & disclosures: www.haematologica.org/content/104/10/2040Ferrata Storti Foundation
T
he Shc family adaptor p66Shc acts as a negative regulator of
prolifer-ative and survival signals triggered by the B-cell receptor and, by
enhancing the production of reactive oxygen species, promotes
oxidative stress-dependent apoptosis. Additionally, p66Shc controls the
expression and function of chemokine receptors that regulate lymphocyte
traffic. Chronic lymphocytic leukemia cells have a p66Shc expression defect
which contributes to their extended survival and correlates with poor
prog-nosis. We analyzed the impact of p66Shc ablation on disease severity and
progression in the E
μ-TCL1 mouse model of chronic lymphocytic
leukemia. We showed that E
μ-TCL1/p66Shc
-/-mice developed an
aggres-sive disease that had an earlier onset, occurred at a higher incidence and led
to earlier death compared to that in E
μ-TCL1 mice. Eμ-TCL1/p66Shc
-/-mice
displayed substantial leukemic cell accumulation in both nodal and extra
-nodal sites. The target organ selectivity correlated with upregulation of
chemokine receptors whose ligands are expressed therein. This also applied
to chronic lymphocytic leukemia cells, where chemokine receptor
expres-sion and extent of organ infiltration were found to correlate inversely with
these cells’ level of p66Shc expression. p66Shc expression declined with
dis-ease progression in E
μ-TCL1 mice and could be restored by treatment with
the Bruton tyrosine kinase inhibitor ibrutinib. Our results highlight p66Shc
deficiency as an important factor in the progression and severity of chronic
lymphocytic leukemia and underscore p66Shc expression as a relevant
ther-apeutic target.
p66Shc deficiency in the E
μ-TCL1 mouse
model of chronic lymphocytic leukemia
enhances leukemogenesis by altering the
chemokine receptor landscape
Laura Patrussi,1Nagaja Capitani,1,2Cristina Ulivieri,1Noemi Manganaro,1 Massimo Granai,3Francesca Cattaneo,1Anna Kabanova,1Lucia Mundo,3 Stefania Gobessi,4Federica Frezzato,5,6Andrea Visentin,5,6Francesca Finetti,1 Pier Giuseppe Pelicci,7Mario M. D'Elios,2Livio Trentin,5,6Gianpietro
Semenzato,5,6Lorenzo Leoncini,3Dimitar G. Efremov4and Cosima T. Baldari1
1Department of Life Sciences, University of Siena, Siena; 2Department of Clinical and
Experimental Medicine, University of Florence, Florence; 3Department of Human
Biotechnologies, University of Siena, Siena; 4International Center for Genetic Engineering
and Biotechnology, Trieste; 5Venetian Institute of Molecular Medicine, Padua; 6Department
of Medicine, Hematology and Clinical Immunology Branch, Padua University School of Medicine, Padua and 7European Institute of Oncology, Milan, Italy
ABSTRACT
Introduction
Chronic lymphocytic leukemia (CLL) is characterized by the accumulation of long-lived mature CD5+B cells in peripheral blood, bone marrow and secondary lymphoid organs.1Leukemic cell survival is associated with defective apoptosis2 and, moreover, is promoted by stromal cell-derived chemokines during their transit through secondary lymphoid organs,3where they also undergo proliferation within pseudofollicles.1Imbalanced expression of chemokine receptors regulating homing to (CCR7, CXCR4, CXCR5) and egress from (S1PR1) secondary lymphoid organs concurs to retain CLL cells in the lymphoid niche.3
The adaptor p66Shc participates in signaling pathways linking oxidative stress to apoptosis.4p66Shc promotes the production of reactive oxygen species (ROS) by interrupting the mitochondrial respiratory chain through cytochrome c binding and oxidation, causing activation of the apoptotic cascade. Additionally, it negatively
regulates B-cell survival by modulating the expression of several Bcl-2 family members and inhibiting the activation of the pro-survival kinase Akt.5,6p66Shc also participates in B-cell trafficking by controlling CCR7, CXCR4 and S1PR1 surface expression both transcriptionally and post-translationally.7,8 Moreover, p66Shc attenuates CXCR4 and CXCR5 signaling.9CLL cells have a defect in the expres-sion of p66Shc6and its transcription factor STAT410which is causal to their extended survival,6,7,11suggesting a link between p66Shc deficiency and the pathogenesis of CLL. Overexpression of TCL1 driven by the IgM heavy chain enhancer (Eμ-TCL1) in mice results in the development of a B-cell leukemia that recapitulates aggressive CLL.12Here we have addressed the effect of p66Shc deficiency on the onset, development and outcome of CLL by generating a Eμ-TCL1/p66Shc-/-mouse. We showed that p66Shc dele-tion in Eμ-TCL1 mice resulted in accelerated leukemogen-esis and enhanced disease aggressiveness, with enhanced nodal and extranodal infiltration. Our data provide direct evidence that p66Shc deficiency concurs to CLL pathogen-esis and highlight p66Shc expression as a relevant disease target.
Methods
A detailed description of the methods is available in the Online
Supplementary Data file.
Mice
Eμ-TCL112,13 and p66Shc-/- C57BL/6J (C57/p66-/-)14 mice were
crossed to generate Eμ-TCL1/p66Shc-/-mice: the screening strategy
is illustrated in Online Supplementary Figures S1 and S2. C57BL/6J
and C57/p66-/- mice were used as controls. Mice with ≥10%
peripheral blood CD5+CD19+cells were considered to have
devel-oped leukemia. Overt leukemia was defined as reported
else-where.13
Cell lines, patients and healthy donors
Transfectants generated using the CLL-derived B-cell line
MEC115 and expressing human full-length p66Shc or the
p66ShcQQ mutant were described previously.8p66shc silencing in
an Epstein-Barr virus (EBV) B-cell line was performed as described
elsewhere.10 Peripheral blood samples were collected from 157
treatment-naïve CLL patients and five CLL patients subjected to pharmacological treatments (Online Supplementary Table S1). B cells from 15 buffy coats were used as healthy population controls. B
cells were purified and transfected as described previously.8
Immunophenotyping of leukemic cells
Single-cell suspensions from mouse peripheral blood, peritoneal wash, spleen, bone marrow, lymph nodes, liver and lung were depleted of erythrocytes by hypotonic lysis and incubated with mouse Fc-Block for 15 min at 4°C. Murine leukemic cells and B cells purified from CLL patients and healthy donors were stained (antibodies and reagents listed in Online Supplementary Table S2) and subjected to flow cytometry (Guava Easy Cyte cytometer, Millipore).
RNA purification and polymerase chain reactions
Total RNA was extracted and retrotranscribed as described
pre-viously.8Real-time polymerase chain reactions (PCR) (primers
list-ed in Online Supplementary Table S3) were performlist-ed using GoTaq Long PCR Master Mix (Promega) and results were processed and
analyzed as described elsewhere.11
Cell treatment, apoptosis and reactive oxygen species
measurement, immunoblot and chemotaxis assays
Freshly isolated normal and leukemic mouse B cells were
treat-ed with 50 μM H2O2for 24 h, 1 μM ibrutinib for 48 h, or 35 μM
fludarabine phosphate for 16 h. Dimethylsulfoxide was used as a control. Apoptosis was measured by flow cytometry on
FITC-labeled annexin-V -stained CD5+IgM+cells. Intracellular ROS were
measured by flow cytometry in cells labeled for 30 min at 37°C
with 5 μM CM-H2DCFDA.8
Immunoblots and chemotaxis assays (antibodies and chemokines listed in Online Supplementary Table S2) were carried
out as reported previously.16
Histopathology and immunohistochemistry
Tissues, peripheral blood and peritoneal wash were collected and processed as detailed in the Online Supplementary Methods.
Statistical analyses
One-way analysis of variance (ANOVA) with a post-hoc Tukey test was used for experiments in which multiple groups were compared. Mann-Whitney rank-sum tests were performed to determine the significance of differences between two groups. Survival curves and medians were calculated within subgroups with the Kaplan-Meier method. A log-rank test was used to com-pare differences between estimated survival curves. Statistical analyses were performed using GraphPad Software (La Jolla, CA, USA). P values <0.05 were considered statistically significant.
Study approval
Experiments were approved by the Institutional Review Board and the local Ethics Committee.
Results
p66Shc expression decreases during leukemia
progression in tumoral cells from E
μ-TCL1 mice
CLL cells have a profound reduction in p66Shc expres-sion, which is more severe in patients with an unfavorable prognosis.6 As Eμ-TCL1 mice are a model of aggressive CLL,17we investigated whether the p66Shc defect in CLL cells is recapitulated in leukemic Eμ-TCL1 cells. p66Shc mRNA was quantified in splenic leukemic cells from E μ-TCL1 mice with overt leukemia (≥50% peripheral blood CD5+CD19+cells and a white blood cell count above the normal range; see Online Supplementary Methods).13 The analysis was extended to B1a cells from C57BL/6 mice, the normal CD5+ B-cell counterpart,18 and to the two other mature B-cell subsets, B1b and B2. While p66Shc was expressed at comparable levels in all normal B-cell subsets, tumoral B cells from mice with advanced disease expressed less p66Shc compared to normal B1a cells (Figure 1A). Interestingly, B1a cells from Eμ-TCL1 mice with milder disease (~20% peripheral blood CD5+CD19+ cells) had intermediate levels of p66Shc (Figure 1B,C), indicating that p66Shc expression declines during disease progression, as further supported by a >78% inverse correlation between p66Shc mRNA levels in CD5+CD19+cells and the percent-age of leukemic cells in peripheral blood from the same mouse (Figure 1D). STAT4, a key transcription factor for p66Shc that is defective in CLL cells,10was also downregu-lated in Eμ-TCL1 mice (Figure 1C,E).
The p66Shc expression defect in CLL cells can be res-cued by in vitro or in vivo treatment with the Btk inhibitor ibrutinib, used for CLL treatment.7,19 As for human CLL
cells, p66Shc expression increased in splenic leukemic cells from Eμ-TCL1 sick mice treated with 1 μM ibrutinib for 48 h, concomitant with increased STAT4 expression (Figure 1F,G) supporting the notion that the therapeutic effects of ibrutinib are associated with its STAT4/p66Shc-elevating activity.
p66Shc deficiency accelerates leukemogenesis
in E
μ-TCL1 mice
Our results suggest that the p66Shc defect observed in leukemic CLL and Eμ-TCL1 cells may be implicated in dis-ease pathogenesis. To test this hypothesis, we transferred the p66shc-/- allele into Eμ-TCL1 mice (Online
Figure 1. p66Shc expression decreases during leukemia progression in tumoral cells from Eμ-TCL1 mice and can be restored by ibrutinib treatment.(A) Quantitative real-time polymerase chain reaction (qRT-PCR) analysis of p66Shc mRNA in B1a, B1b, B2 and total mature B lymphocytes purified from four wildtype (WT) mice and in leukemic cells purified from five Eμ-TCL1 sick mice. The relative gene transcript abundance was determined on triplicate samples using the DDCt method and normalized to GAPDH. (B, E). qRT-PCR analysis of p66Shc (B) and STAT4 (E) mRNA in B lymphocytes purified from five WT mice and in leukemic cells purified from Eμ-TCL1 mice with mild (~20% CD5+CD19+cells in peripheral blood) (n=6) or overt leukemia (≥50% CD5+CD19+cells and white cell count >10.7x10⁶/mL in peripheral blood) (n=5). The relative gene transcript abundance was determined on triplicate samples using the DDCt method. (C) Immunoblot analysis with anti-Shc and anti-STAT4 antibodies of postnuclear supernatants of leukemic cells purified from either WT (n=3) or Eμ-TCL1 mice with mild (n=3) or overt leukemia (n=3). The stripped filters were reprobed with anti-actin antibodies. (D) Correlation between the percentages of CD5+CD19+cells and the mRNA levels of p66Shc in peripheral blood samples obtained from Eμ-TCL1 mice at different disease stages (n=12). (F) qRT-PCR analysis of p66Shc (left) and STAT4 (right) mRNA in leukemic cells purified from spleens of Eμ-TCL1 sick mice (n=4) incubated for 48 h with either dimethylsulfoxide (DMSO) (absolute cell viability: 88.4 ± 3.2% of annexin V-/propidium iodide-cells) or 1 μM ibrutinib (absolute cell viability: 84.9 ± 2.9% of annexin V-/propidium iodide-cells). The relative gene transcript abundance was determined on triplicate samples using the DDCt method. (G) Immunoblot analysis with anti-Shc and anti-STAT4 antibodies of postnuclear supernatants of leukemic cells purified from spleens of Eμ-TCL1 sick mice (n=3) incubated for 48 h with either DMSO or 1 μM ibrutinib. The stripped filters were reprobed with anti-actin antibodies. Mean ± standard deviation. One-way analysis of variance (ANOVA), multiple comparisons. ****P≤0.0001; ***P≤0.001; **P≤0.01; *P≤0.05
A B
C D
Supplementary Figure S1A,B).12 As expected, E μ-TCL1/p66Shc-/- B cells did not express p66Shc (Online
Supplementary Figure S1C,D) while expressing wildtype
p53, similar to Eμ-TCL1 cells (Online Supplementary
Methods and Online Supplementary Table S3).20 E μ-TCL1/p66Shc-/-mice developed a CLL-like disease similar to that occurring in Eμ-TCL1 mice. A large lymphocyte population, associated with the characteristic Gumprecht shadows, was evident in peripheral blood smears from sick mice (Online Supplementary Figure S1E). Flow cytomet-ric analysis of peripheral blood samples from 6- and 9-month old mice revealed a discrete population of CD5+B cells, which is the hallmark of disease development in E μ-TCL1 mice (Online Supplementary Figures S1F and S2).12 Similar to Eμ-TCL1 mice, leukemic Eμ-TCL1/p66Shc -/-mice eventually became visibly ill, showing labored breathing and splenomegaly (Online Supplementary Figure
S1G and Online Supplementary Table S4) that necessitated
euthanasia.
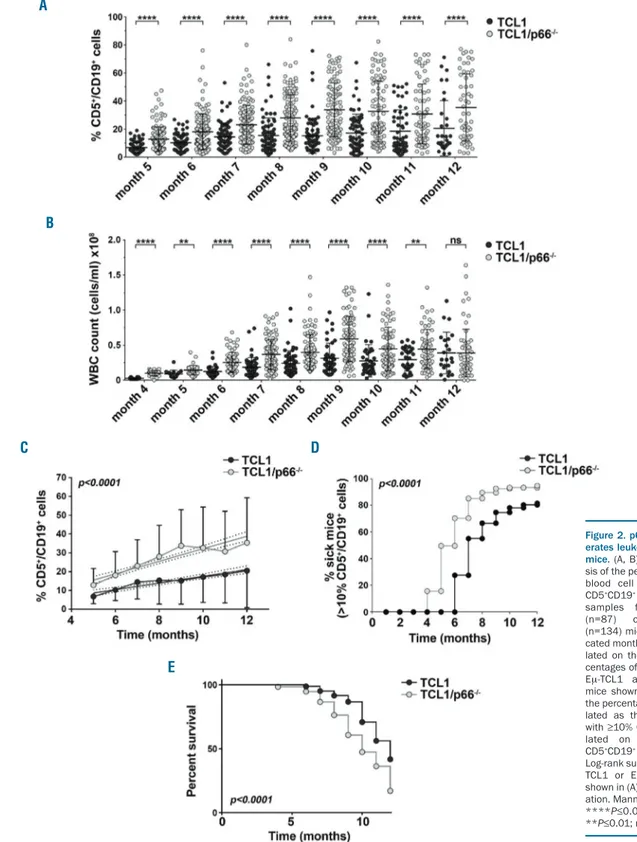
To address the impact of p66Shc deficiency on disease onset and progression, we followed leukemia develop-ment in 87 Eμ-TCL1 and 134 Eμ-TCL1/p66Shc-/-mice by immunophenotyping monthly peripheral blood samples. Eμ-TCL1/p66Shc-/-mice showed higher white blood cell counts and higher CD5+CD19+cell percentages in periph-eral blood compared to those in Eμ-TCL1 mice (Figure 2A,B; Online Supplementary Figure S1G). Moreover disease progression, assessed as rate of increase in the percentage of CD5+CD19+cells, was faster in Eμ-TCL1/p66Shc-/-mice (Figure 2C).
Disease incidence, defined as the percentage of sick mice (>10% peripheral blood CD5+CD19+cells vs. ~5% in healthy C57BL/J6 mice) (Online Supplementary Figure S3) at defined time points, was significantly higher in Eμ-TCL1/p66Shc-/- mice than in Eμ-TCL1 mice (Figure 2D). Moreover, p66Shc deficiency led to an earlier onset of dis-ease, which was detected ~2 months earlier in E μ-TCL1/p66Shc-/-mice (Figure 2D) and resulted in a shorter lifespan (Figure 2E). Hence p66Shc deficiency in Eμ-TCL1 mice accelerates disease onset and development as well as its progression to an aggressive presentation.
p66Shc deficiency enhances leukemic cell
chemoresistance
Consistent with the ability of p66Shc to modulate the expression of pro- and anti-apoptotic Bcl-2 family mem-bers,6leukemic Eμ-TCL1/p66Shc-/-cells expressed higher and lower levels of Bcl-2 and Bax, respectively, compared to levels in their Eμ-TCL1 counterparts (Figure 3A,B). At variance, Mcl-1 expression was comparable (Online
Supplementary Figure S4). Accordingly, leukemic cells from
sick Eμ-TCL1/p66Shc-/- mice were more resistant to flu-darabine treatment, also when co-cultured with OP9 stro-mal cells to simulate the pro-survival strostro-mal microenvi-ronment (Figure 3C). Hence p66Shc deficiency in E μ-TCL1 leukemic cells promotes these cells’ survival, which likely contributes to the faster disease development and unfavorable outcome in Eμ-TCL1/p66Shc-/- mice. This is supported by the higher sensitivity to fludarabine of leukemic cells from Eμ-TCL1 mice with milder disease (<35% peripheral blood CD5+CD19+ cells) compared to leukemic cells from mice at later disease stages (≥35% peripheral blood CD5+CD19+ cells) (Figure 3D), which may be accounted for, at least in part, by their higher residual p66Shc expression (Figure 1B,C). Consistent with
this notion, tumoral Eμ-TCL1/p66Shc-/-cells were less sen-sitive to fludarabine treatment, independently of disease stage (Figure 3D). Hence the reduction of p66Shc expres-sion in Eμ-TCL1 mice during disease development con-tributes to the decreased chemosensitivity of leukemic cells.
p66Shc deficiency in E
μ-TCL1 mice is associated
with nodal and extranodal leukemic cell accumulation
Leukemic cells accumulate in the peritoneal cavity of E μ-TCL1 mice at early stages of disease, subsequently coloniz-ing spleen, bone marrow and lymph nodes as well as extra-nodal sites.12p66Shc modulates the surface levels of recep-tors that regulate homing to and egress from secondary lymphoid organs,8,7suggesting that its deficiency might con-tribute to leukemic cell accumulation in secondary lym-phoid organs and infiltration into non-lymlym-phoid organs. The extent of organ infiltration by leukemic cells was meas-ured in spleen, bone marrow and lymph nodes from E μ-TCL1 and Eμ-TCL1/p66Shc-/- mice with ~60% leukemic cells in peripheral blood. The analysis was extended to liver and lung, as infiltration in these organs has been document-ed in CLL,21,22as well as to the peritoneal infiltrate.
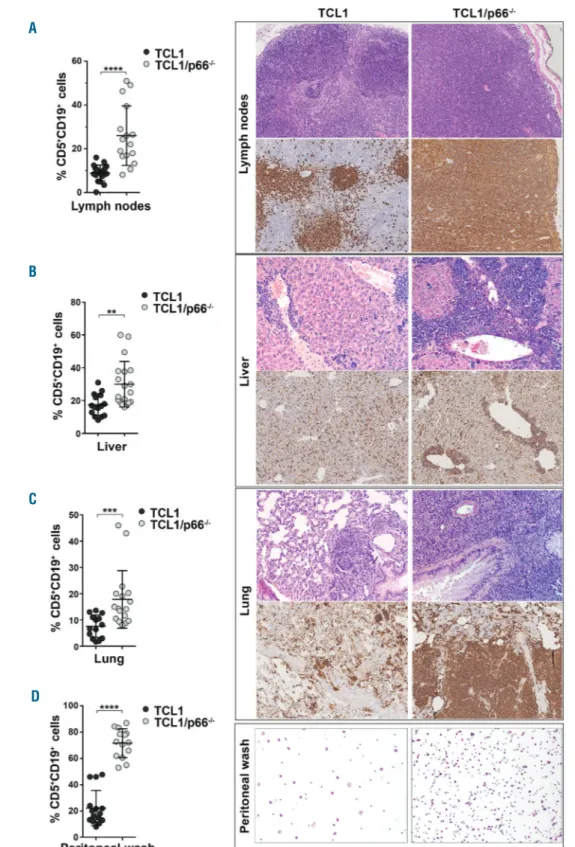
Flow cytometric analysis of CD5+CD19+ cells revealed higher percentages of leukemic cells in lymph nodes of Eμ-TCL1/p66Shc-/- mice than in those of Eμ-TCL1 mice (Figure 4A). This was confirmed by hematoxylin & eosin staining and immunohistochemical analysis of the same organs, which highlighted massive lymph node infiltra-tion of Eμ-TCL1/p66Shc-/- mice by small lymphoid-like B220+cells (Figure 4A). At variance, leukemic cell accumu-lation in spleen and bone marrow was comparable (Online
Supplementary Figure S5 and Online Supplementary Table S4), suggesting that Eμ-TCL1/p66Shc-/-tumoral cells show organ selectivity.
Leukemic cell infiltrates in the liver and lung were found to be more substantial in Eμ-TCL1/p66Shc-/-mice than in Eμ-TCL1 mice and were frequently associated with loss of organ architecture (Figure 4B,C). Increased peritoneal leukemic cell accumulation was also observed in E μ-TCL1/p66Shc-/-mice (Figure 4D). Interestingly, flow cyto-metric analysis of the proliferation marker Ki-67 revealed a higher proliferation rate of leukemic Eμ-TCL1/p66Shc -/-cells in lymph nodes, liver and lung compared to their E μ-TCL1 counterparts (Online Supplementary Figure S6), con-sistent with the anti-mitogenic function of p66Shc.23
Increased colonization of nodal and extranodal sites
by E
μ-TCL1/p66Shc
-/-cells is associated with higher
expression of homing receptors
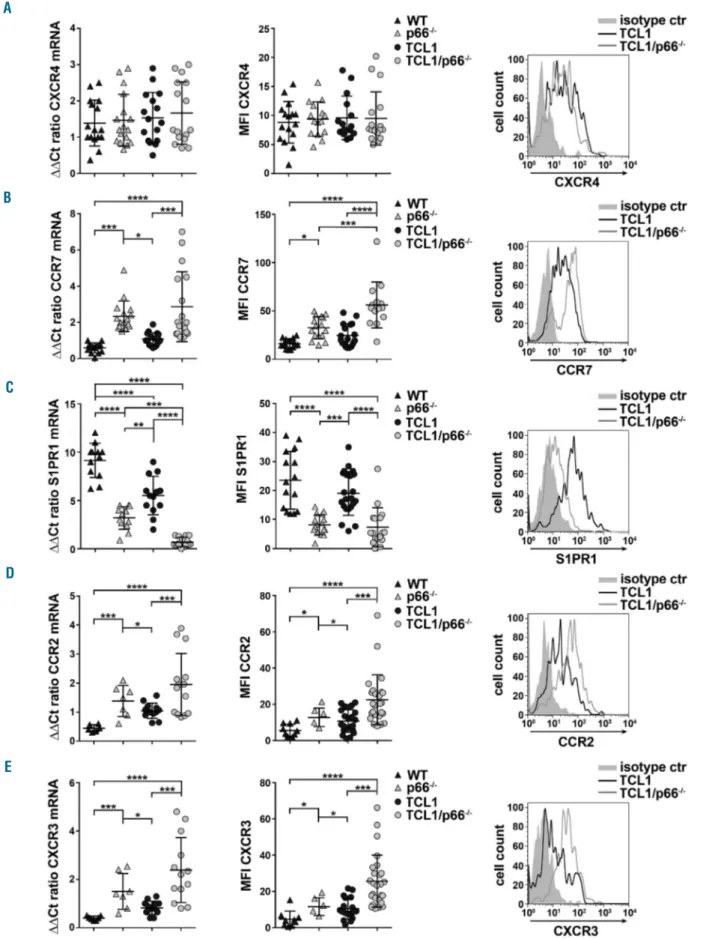
The chemokine receptors CXCR4 and CCR7 contribute to the pathogenesis of CLL by modulating leukemic B-cell homing to secondary lymphoid organs and bone mar-row.3,24,25p66Shc modulates surface expression of homing and egress receptors both transcriptionally and post-trans-lationally in normal and CLL B cells,7,8suggesting that the increased colonizing ability of leukemic Eμ-TCL1/p66Shc -/-cells may be caused by imbalanced expression of these receptors. Splenic leukemic cells from Eμ-TCL1 and Eμ-TCL1/p66Shc-/- mice with overt leukemia were analyzed by quantitative real-time PCR and flow cytometry for expression of chemokine receptors that regulate CLL cell homing to and residency in lymphoid organs, namely CXCR4, CCR7 and S1PR1. Splenic B cells from C57BL6/J and C57BL6/J/p66Shc-/- mice were used as controls.
Expression of CXCR4, which mainly guides B-cell homing to the bone marrow,26 was comparable in leukemic cells from both mouse strains (Figure 5A), accounting at least in part for the comparable extent of tumoral cell infiltra-tion in the spleen. Conversely, surface expression of CCR7, the main lymph node B-cell homing receptor,27 was higher in Eμ-TCL1/p66Shc-/- cells (Figure 5B). Expression of S1PR1, which controls B-cell egress from
secondary lymphoid organs,28was strongly downregulat-ed in Eμ-TCL1/p66Shc-/- compared to Eμ-TCL1 cells (Figure 5C), in agreement with the causal relationship between p66Shc and S1PR1 expression in CLL cells.8 Consistent with these results and the massive lymph node colonization (Figure 4A), leukemic Eμ-TCL1/p66Shc-/-cell chemotaxis towards the CCR7 ligand MIP-3β and the S1PR1 ligand S1P was enhanced and suppressed,
respec-Figure 2. p66Shc deficiency accel-erates leukemogenesis in Eμ-TCL1 mice.(A, B) Flow cytometric analy-sis of the percentages (A) and white blood cell (WBC) counts (B) of CD5+CD19+cells in peripheral blood samples from either Eμ-TCL1 (n=87) or Eμ-TCL1/p66Shc -/-(n=134) mice collected at the indi-cated months. (C) Trend-lines calcu-lated on the monthly average per-centages of CD5+CD19+cells in the Eμ-TCL1 and Eμ-TCL1/p66Shc -/-mice shown in (A). (D) Analysis of the percentages of sick mice, calcu-lated as the percentage of mice with ≥10% CD5+CD19+cells, calcu-lated on the percentages of CD5+CD19+cells shown in (A). (E) Log-rank survival analysis of the Eμ-TCL1 or Eμ-Eμ-TCL1/p66Shc-/- mice shown in (A). Mean ± standard devi-ation. Mann-Whitney rank sum test. ****P≤0.0001; ***P≤0.001; **P≤0.01; ns: not significant. A B C D E
tively, compared to that of leukemic Eμ-TCL1 cells, as assessed in transwell assays (Online Supplementary Figure
S7). Although surface and mRNA levels of CXCR4 were
similar in the two mouse strains, tumoral E μ-TCL1/p66Shc-/- cell chemotaxis towards the CXCR4 lig-and CXCL12 was enhanced (Online Supplementary Figure
S7), consistent with the ability of p66Shc to negatively
regulate CXCR4-dependent signaling9 and CXCR4 recy-cling7in human B cells.
Lymphocyte homing to non-lymphoid organs is con-trolled by G protein-coupled receptors. B-cell homing to the liver is regulated by CCR1, CCR2, and CXCR3, while CCR2, CCR5, and CXCR3 have been implicated in B-cell homing to the lung.29-34 CCR1 and CCR5 mRNA levels in leukemic cells were comparable in the two mouse strains (Online Supplementary Figure S8). Conversely, both surface and mRNA levels of CCR2 and CXCR3 were higher in leukemic Eμ-TCL1/p66Shc-/- cells
Figure 3. p66Shc deficiency in leukemic cells results in enhanced chemoresis-tance. (A) Quantitative real-time poly-merase chain reaction analysis of Bcl-2 and Bax mRNA in leukemic cells purified from either wildtype (WT) (n=7) or p66Shc-/-(n=7) mice and from Eμ-TCL1 (n=10) or Eμ-TCL1/p66Shc-/- (n=12) mice with overt leukemia. The relative gene transcript abundance was deter-mined on triplicate samples using the DDCt method. (B) Immunoblot analysis with anti-Bcl-2 (left) and anti-Bax (right) antibodies of postnuclear supernatants of leukemic cells purified from either WT (n=3) or p66Shc-/-(n=3) mice and from Eμ-TCL1 (n=3) or Eμ-TCL1/p66Shc -/-(n=3) mice with overt leukemia. The stripped filters were reprobed with anti-actin antibodies. (C) Flow cytometric analysis of the percentages of annexin V+CD5+IgM+ cells in peripheral blood from either WT (n=9) or p66Shc-/-(n=8) mice and from TCL1 (n=20) or Eμ-TCL1/p66Shc-/- (n=22) mice. Samples were treated with either dimethylsulfox-ide (DMSO) or 35 μM fludarabine (flu) for 16 h at 37°C. (D) Flow cytometric analysis of the percentages of annexin V+CD5+IgM+ cells in peripheral blood from either TCL1 (n=20) or Eμ-TCL1/p66Shc-/-(n=22) mice with <35% (black boxes) or ≥35% (gray boxes) CD5+CD19+leukemic cells in peripheral blood, treated with either DMSO or 35 µM fludarabine for 16 h at 37°C. Mean ± standard deviation. One-way analysis of variance (ANOVA), multiple compar-isons. ****P≤0.0001; ***P≤0.001; **P≤0.01; *P≤0.05 A B C D
than in Eμ-TCL1 cells (Figure 5D,E). Consistent with these results and their enhanced liver and lung coloniza-tion (Figure 4B,C), chemotaxis towards the respective chemokines was enhanced in leukemic Eμ-TCL1/p66Shc -/- cells compared to leukemic Eμ-TCL1 cells (Online
Supplementary Figure S7). Of note, similar effects, albeit
less pronounced, were observed when mRNA and sur-face levels of these receptors, and the chemotactic responses thereof, were analyzed in B cells from
C57BL6/J and C57BL6/J/p66Shc-/- mice (Figure 5 and
Online Supplementary Figure S7), further supporting the
central role of p66Shc in modulating expression of these receptors. Collectively, these results suggest that the more efficient colonization of and accumulation in extra-nodal sites by p66Shc-/- leukemic cells can be accounted for, at least in part, by the ability of p66Shc to modulate the expression of chemokine receptors that guide the cells’ homing to those sites.
Figure 4. Nodal and extran-odal accumulation of leukemic cells lacking p66Shc. (A-D) (Left) Flow cyto-metric analysis of the percent-ages of CD5+CD19+ cells in lymph nodes (A), liver (B), lung (C) and peritoneal wash (D) from either Eμ-TCL1 (n=15) or Eμ-TCL1/p66Shc-/- (n=15) mice with overt leukemia. (Right) Hematoxylin & eosin staining (upper panels) and immunohistochemical analysis of B220 (lower panels) in lymph nodes (A), liver (B), lung (C) and peritoneal wash (D) from either Eμ-TCL1 (n=5) or Eμ-TCL1/p66Shc-/-(n=10) with overt leukemia. (Immunoperoxidase staining; original magnification, 5x, 10x and 20x). Mean ± standard deviation. Mann-Whitney rank sum test. ****P≤0.0001; ***P≤0.001; **P≤0.01. A B C D
Figure 5. p66Shc deficiency in leukemic cells results in enhanced expression of homing receptors and reduced expression of the egress receptor S1PR1. (A-E) Quantitative real-time polymerase chain reaction analysis of the mRNA levels (left) and flow cytometric analysis of surface expression (right) of CXCR4 (A), CCR7 (B), S1PR1 (C), CCR2 (D) and CXCR3 (E) in CD5+CD19+cells purified from either wildtype (WT) (n=16) or p66Shc-/-(n=15) mice (B1a cells) and from Eμ-TCL1 (n≥16) or Eμ-TCL1/p66Shc-/-(n≥16) mice with overt leukemia. The relative gene transcript abundance was determined on triplicate samples using the DDCt method. Representative flow cytometric plots of the indicated stains are shown on the right. Chemotaxis toward the respective chemokines is shown in Online Supplementary
Figure S6. Mean ± standard deviation. One-way analysis of variance (ANOVA), multiple comparisons. ****P≤0.0001; ***P≤0.001; **P≤0.01; *P≤0.05.
A
B
C
D
Reconstitution of p66Shc in chronic lymphocytic
leukemia cells normalizes their CCR2 and CXCR3
expression
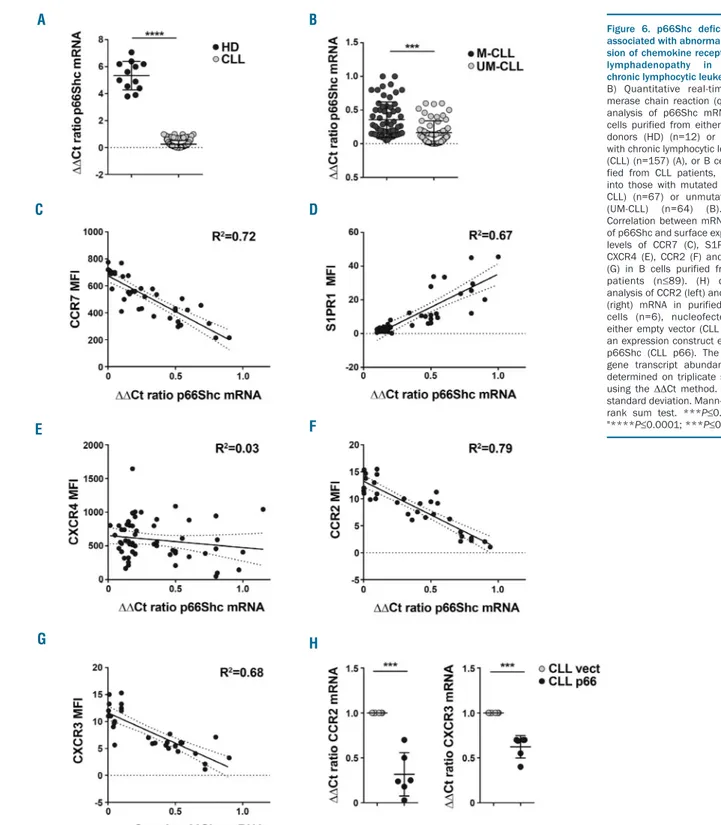
We translated these results to human CLL cells, in which a drastic reduction in p66Shc mRNA was observed compared to levels in healthy donor B cells, with lower residual levels in patients with unmutated IGHV (UM-CLL), who develop aggressive disease,35 compared to patients with mutated IGHV (M-CLL) (Figure 6A,B).6No correlation with other genetic markers of CLL, namely
13q deletion or TP53 deletion/mutation, was observed (Online Supplementary Figure S9A,B).
We investigated whether the residual levels of p66Shc in CLL cells could be correlated with the expression of the trafficking receptors found to be modulated by p66Shc deficiency in Eμ-TCL1 leukemic cells. As reported,8 sur-face and mRNA levels of CCR7 and S1PR1 correlated inversely and directly, respectively, with p66Shc expres-sion in CLL cells from the patients included in this study (Figure 6C,D and Online Supplementary Figure S10A,B).
Figure 6. p66Shc deficiency is associated with abnormal expres-sion of chemokine receptors and lymphadenopathy in human chronic lymphocytic leukemia. (A, B) Quantitative real-time poly-merase chain reaction (qRT-PCR) analysis of p66Shc mRNA in B cells purified from either healthy donors (HD) (n=12) or patients with chronic lymphocytic leukemia (CLL) (n=157) (A), or B cells puri-fied from CLL patients, grouped into those with mutated CLL (M-CLL) (n=67) or unmutated CLL (UM-CLL) (n=64) (B). (C-G) Correlation between mRNA levels of p66Shc and surface expression levels of CCR7 (C), S1PR1 (D), CXCR4 (E), CCR2 (F) and CXCR3 (G) in B cells purified from CLL patients (n≤89). (H) qRT-PCR analysis of CCR2 (left) and CXCR3 (right) mRNA in purified CLL B cells (n=6), nucleofected with either empty vector (CLL vect) or an expression construct encoding p66Shc (CLL p66). The relative gene transcript abundance was determined on triplicate samples using the DDCt method. Mean ± standard deviation. Mann-Whitney rank sum test. ***P≤0.001" to "****P≤0.0001; ***P≤0.001".
A B
C D
E F
Consistent with our finding that the upregulation of sur-face CXCR4 in CLL cells is mainly controlled post-transla-tionally,11 no correlation was observed between the mRNA levels of p66Shc and CXCR4 (Figure 6E and Online
Supplementary Figure S10C).
The analysis was extended to CCR2 and CXCR3, which were selectively overexpressed in UM-CLL cells (Online Supplementary Figure S9C,D). Similar to CCR7, expression of these receptors was inversely correlated with that of p66Shc (Figure 6F,G and Online Supplementary
Figure S10D,E), suggesting that p66Shc may negatively
modulate their expression. p66Shc reconstitution in CLL cells did indeed result in a decrease in CCR2 and CXCR3 mRNA (Figure 6H and Online Supplementary Figure S10F). Interestingly, infiltration of both nodal and extranodal areas, assessed by the number and size (cm) of infiltrated lymph nodes and the presence of spleen and/or liver enlargement, was significantly greater in patients whose leukemic cells had p66Shc mRNA levels below an arbi-trarily set threshold (0.24, corresponding to the mean DDCt p66Shc mRNA of all CLL patients) (Online
Supplementary Figure S11 and Table 1). These data provide
evidence of a correlation of the severity of the p66Shc expression defect in CLL cells with their ability to infil-trate both nodal and extranodal districts, strongly sup-porting a role for p66Shc deficiency in disease presenta-tion. Of note, p66Shc expression was enhanced in CLL patients showing a significant response to second-line ibrutinib treatment but not in CLL patients who failed to
respond to ibrutinib therapy (Table 1 and Online
Supplementary Table S1), suggesting that the response of
CLL patients to therapeutic regimens results, at least in part, from the ability of leukemic cells to restore p66Shc expression.
Modulation of CCR2 and CXCR3 expression by p66Shc
is mediated by its pro-oxidant activity
p66Shc has a ROS-elevating activity that depends on its ability to interact with cytochrome c and interrupt the respiratory chain.4We quantified homeostatic ROS pro-duction in CLL cells loaded with the cell-permeant probe
CM-H2DCFDA. ROS production was profoundly
decreased in CLL B cells compared to that in normal B cells, with the lowest levels in UM-CLL patients (Figure 7A), consistent with their lowest p66Shc levels.6 Furthermore, we found a direct correlation between ROS production and p66Shc expression in CLL cells (Figure 7B). These findings were recapitulated in CM-H2 DCFDA-loaded Eμ-TCL1 cells which, similar to CLL cells, express low levels of p66Shc (Figure 1B) and in which ROS pro-duction was lower than that in B cells from control C57BL/6 mice (Figure 7C). ROS production was further impaired in Eμ-TCL1/p66Shc-/-cells (Figure 7C), confirm-ing the pro-oxidant activity of p66Shc.
Transcription of both ccr7 and s1pr1 is controlled in opposite directions by the ROS-elevating activity of p66Shc.8To address the potential role of the pro-oxidant function of p66Shc in the regulation of CCR2 and CXCR3 expression we used the CLL-derived human B-cell line MEC1 stably transfected with a ROS-defective mutant carrying a E→Q substitution at positions 132-133 (p66QQ), which disrupts cytochrome c binding (Figure 7D,E).8The empty vector transfectant lacking p66Shc (ctr) and a transfectant expressing the wildtype protein (p66) were used as controls. Flow cytometric analysis of home-ostatic ROS production in the CM-H2DCFDA-loaded MEC1 transfectants showed enhanced ROS production in p66Shc-expressing cells, but not in cells expressing p66ShcQQ, compared to control cells (Figure 7F).
Mitochondrial redox signaling and apoptosis are also modulated by p53,36which is mutated in a large propor-tion of CLL patients1as well as in MEC1 cells.37To rule out a role for TP53 mutations in the enhanced ROS pro-duction by p66Shc-expressing MEC1 cells, ROS were measured in EBV-immortalized B cells, which express wildtype p53,38 transiently depleted of p66Shc by short interfering RNA-mediated knock-down. Similar to MEC1 cells, p66Shc deficiency in EBV-immortalized B cells resulted in a lower intracellular ROS content and enhanced CCR2 and CXCR3 expression (Online
Supplementary Figure S12), underscoring the specific
con-tribution of p66Shc to the ROS-dependent modulation of these receptors.
Surface and mRNA expression of CCR2 and CXCR3 was next measured in all transfectants. The wildtype p66Shc-expressing transfectant, but not the p66QQ transfectant, had lower mRNA and surface levels of both receptors compared to the levels in control cells (Figure 7G,I). Surface and mRNA expression of CCR2 and CXCR3 was also decreased in MEC1 cells after treatment with 50 μM H2O2, an exogenous ROS source (Figure 7H-J), indicating that the ability of p66Shc to modulate CCR2 and CXCR3 expression involves its ROS-elevating activity.
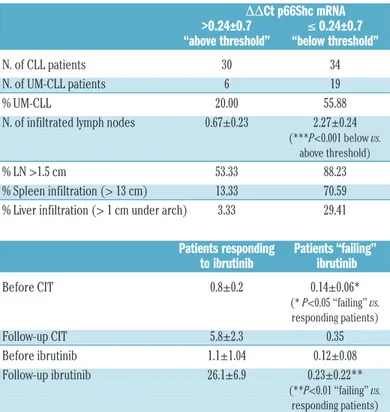
Table 1. Pathological characteristics of patients with chronic lymphocytic leukemia and p66Shc mRNA levels in their respective leukemic cells during treatment.
DDCt p66Shc mRNA >0.24±0.7 ≤ 0.24±0.7 “above threshold” “below threshold” N. of CLL patients 30 34 N. of UM-CLL patients 6 19 % UM-CLL 20.00 55.88 N. of infiltrated lymph nodes 0.67±0.23 2.27±0.24
(***P<0.001 below vs. above threshold)
% LN >1.5 cm 53.33 88.23 % Spleen infiltration (> 13 cm) 13.33 70.59 % Liver infiltration (> 1 cm under arch) 3.33 29.41 Patients responding Patients “failing” to ibrutinib ibrutinib Before CIT 0.8±0.2 0.14±0.06* (* P<0.05 “failing” vs. responding patients) Follow-up CIT 5.8±2.3 0.35 Before ibrutinib 1.1±1.04 0.12±0.08 Follow-up ibrutinib 26.1±6.9 0.23±0.22** (**P<0.01 “failing” vs. responding patients)
Patients with chronic lymphocytic leukemia (CLL) were grouped according to p66Shc mRNA expression into either “above threshold” and “below threshold” (threshold 0.24, corresponding to the mean DDCt p66Shc mRNA; n CLL=157), or according to response to ibrutinib into either “responding” or “failing” based on International Working Group CLL response criteria.50
Mann-Whitney rank sum test. ***P≤0.001; **P≤0.01; *P≤0.05. LN: lymph nodes; CLL: chronic lympho-cytic leukemia; UM-CLL: unmutated CLL; CIT: chemo-immunotherapy.
Figure 7. The pro-oxidant activity of p66Shc modulates CCR2 and CXCR3 expression. (A, C) Flow cytometric analysis of reactive oxygen species (ROS) production in B cells purified from either healthy donors (HD, n=7) or patients with chronic lymphocytic leukemia (CLL) grouped according to whether they had mutated CLL (M-CLL) (n=11) or unmutated CLL (UM-(M-CLL) (n=9) (A) and in B1a cells from wildtype (C57BL/6, n=9) mice and from Eμ-TCL1 (n=13) or Eμ-TCL1/p66Shc-/-(n=12) sick mice (C), loaded with CM-H2DCFDA. Data refer to duplicate samples from each patient/donor/mouse. (B) Correlation between mRNA levels of p66Shc and ROS pro-duction in B cells purified from CLL patients (n=28). (D, E) Immunoblot analysis of Shc expression (D) and quantitative real-time polymerase chain reaction (qRT-PCR) analysis of p66Shc mRNA (E) in MEC1 B cells stably transfected with empty vector (ctr) or an expression construct encoding either wildtype p66Shc (p66) or the EE132/133QQ (p66QQ) mutant, and in B cells purified from healthy donors (HD) (n=3). A control anti-actin blot of the stripped filter is shown below. The migration of molecular mass markers is indicated. The domain structure of p66Shc showing the localization of the amino acid residues substituted in the mutants is schema-tized at the top of the panel. (F) Flow cytometric analysis of ROS production in the MEC1 B-cell transfectants and in B cells purified from healthy donors (B cell, n=5) loaded with CM-H2DCFDA. Data refer to duplicate samples from five independent experiments. (G, I). Flow cytometric analysis (G) and qRT-PCR analysis of the mRNA levels (I) of CCR2 (left) and CXCR3 (right) in MEC1 transfectants. Data refer to duplicate samples from five independent experiments. (H, J). Flow cytometric analysis (H) and qRT-PCR analysis of the mRNA levels (J) of CCR2 and CXCR3 in MEC1 cells treated for 24 h with either dimethylsulfoxide (DMSO) or 50 μM H2O2. Data refer to duplicate samples from four independent experiments. The relative gene transcript abundance was determined on triplicate samples using the ΔΔCt method. Mean ± standard deviation. Mann-Whitney rank sum test. ****P≤0.0001; ***P≤0.001**P≤0.01; *P≤0.05. MFI: mean fluorescence intensity.
A
D E F
G H
I J
Discussion
Here we used a genetic approach to specifically assess the outcome of p66Shc deficiency on CLL cell survival and disease onset and development. We showed that p66Shc deletion in Eμ-TCL1 mice results in accelerated leukemo-genesis and enhanced disease aggressiveness, with mas-sive nodal and extranodal infiltration. The enhanced abili-ty of leukemic p66Shc-/-cells to infiltrate organs was asso-ciated with increased expression of chemokine receptors that drive homing to the organs. p66Shc expression declined with disease progression in Eμ-TCL1 cells, simi-lar to human CLL. This defect could be restored by ibruti-nib treatment which enhanced the cells’ chemosensitivity. These results demonstrate in vivo that the p66Shc defect found in CLL cells concurs to CLL pathogenesis. Of note, p66Shc-/-mice spontaneously develop age-related autoim-munity,5 a feature frequently associated with CLL.1 Interestingly, p66Shc downregulation in CLL B cells induces the expression of the inhibitory molecule ILT3,39 suggesting that compensatory mechanisms might be oper-ational to restrain CLL cell responses.
The negative impact of p66Shc deletion on disease pro-gression and outcome in Eμ-TCL1 mice can be accounted for, at least in part, by the extended survival and chemore-sistance of leukemic cells, even when co-cultured with stromal cells as a surrogate pro-survival microenviron-ment. The p66Shc expression defect in CLL contributes to this biological behavior. p66Shc deficiency does indeed impinge on the Bcl-2 family balance in B cells, contributing to the shift of CLL cells towards survival, which correlates with chemoresistance and poor prognosis.40The ROS-ele-vating activity of p66Shc4,14underlies this latter’s ability to modulate the genes, several of which are redox-sensitive.41 The survival of CLL cells depends to a major extent on their ability to home to the pro-survival microenvironment of bone marrow and secondary lymphoid organs. This process is orchestrated by homing receptors responding to local chemokines and egress receptors responding to lymph and blood S1P.3 p66Shc is a central part of this circuitry which it affects by: (i) modulating CCR7 and S1PR1 expres-sion in opposite directions in a ROS-dependent fashion;8(ii) modulating CCR7 and CXCR4 by slowing down their endosomal recycling;7 and (iii) attenuating CXCR4 and CXCR5 signaling by recruiting the phosphatases SHP-1 and SHIP-1 close to the activated receptors.9The p66Shc defect in CLL cells has a major impact on these processes, resulting in enhanced responses to the chemokines of the lymphoid niche and impaired response to S1P.7,8 This imbalance is expected to contribute to the lymphadenopathy and chemoresistance observed in a significant proportion of CLL patients, and indeed the levels of CCR7 are significant-ly higher and those of S1PR1 lower in CLL patients with clinical lymphadenopathy.8We showed that the levels of p66Shc in leukemic cells are inversely related to both the number and size of infiltrated lymph nodes in CLL patients. The results obtained in Eμ-TCL1/p66Shc-/-mice, showing
massive lymph node accumulation during disease progres-sion, provide experimental evidence that p66Shc deficiency promotes the nodal leukemic cell accumulation in CLL.
p66Shc deficiency also results in a striking extranodal accumulation of leukemic cells, with a preference for liver and lung, the most frequent extranodal target sites in CLL.21,22 The ROS-related ability of p66Shc to modulate the expression and function of CCR2 and CXCR3, which drive neoplastic B-cell homing to liver and lung where the respective ligands are expressed,42,43 may account for the enhanced ability of leukemic Eμ-TCL1/p66Shc-/- cells to colonize these organs. Interestingly, CCR2 and CXCR3 are overexpressed in CLL cells (as shown in this study and reported by Trentin et al.44 for CXCR3). We show that p66Shc reconstitution in CLL cells reverts these abnormal-ities, validating in human CLL our finding that p66Shc deficiency contributes to CCR2 and CXCR3 overexpres-sion in leukemic Eμ-TCL1/p66Shc-/-cells.
p66Shc expression declines during disease progression in Eμ-TCL1 mice, until its almost complete loss in mice with overt leukemia, paralleling the progressive decrease in fludarabine sensitivity of tumoral cells documented pre-viously.20p66shc transcription is largely controlled in sever-al primary and transformed cells, including T cells, by his-tone deacetylation and cytosine methylation in a CpG island within the promoter.45,46 Although methylation increases in Eμ-TCL1 mice during disease development,47 it is unlikely that methylation of the p66shc promoter caused its progressive silencing, as p66Shc expression is not epigenetically silenced in B cells.6Rather, in these cells
p66shc is transcriptionally regulated by STAT4, which is
defective in CLL cells.10 Interestingly, p66Shc can be restored both in CLL cells7and in leukemic Eμ-TCL1 cells (Figure 1F,G) by treatment with ibrutinib, which also pro-motes STAT4 expression in leukemic Eμ-TCL1 cells (Figure 1F,G). Ibrutinib modulates the expression of genes downstream of Btk in the BCR and CXCR4 pathways,48,49 which are implicated in CLL, suggesting that STAT4 and its target p66Shc may be regulated through these path-ways. While this remains to be established, considering the pleiotropic role of p66Shc in B-cell survival and traf-ficking our finding suggests that direct or indirect STAT4 agonists that enhance the activity of residual STAT4 in CLL cells may normalize p66Shc expression and over-come chemoresistance in CLL. Our finding that inter-leukin-12, which activates STAT4, restores p66Shc expres-sion in CLL cells10supports this hypothesis. Collectively, our findings underscore the pathological outcome of p66Shc deficiency in CLL and highlight the chemokine receptor network as a central target of its activity.
Acknowledgments
The authors thank Carlo M. Croce for providing Eµ-TCL1 mice and Sonia Grassini for technical assistance. This work was supported by grants from AIRC (IG-20148) and ITT-Regione Toscana to CTB, AIRC (IG-19236) to DGE, AIRC (IG-15286) to GS and AIRC (IG-15397) to LT.
References
1. Dighiero G, Hamblin TJ. Chronic lympho-cytic leukaemia. Lancet. 2008;371(9617): 1017–1029.
2. Ortiz-Maldonado V, Mozas P, Delgado J.
The biology behind B-cell lymphoma 2 as a target in chronic lymphocytic leukemia. Ther Adv Hematol. 2016;7(6):321–329. 3. Burger JA. Nurture versus nature: the
microenvironment in chronic lymphocytic leukemia. Hematol Am Soc Hematol Educ
Progr. 2011;2011(1):96–103.
4. Giorgio M, Migliaccio E, Orsini F, et al. Electron transfer between cytochrome c and p66Shc generates reactive oxygen species that trigger mitochondrial apoptosis. Cell. 2005;122(2):221–233.
5. Finetti F, Savino MT, Baldari CT. Positive and negative regulation of antigen receptor signaling by the Shc family of protein adapters. Immunol Rev. 2009;232(1):115– 134.
6. Capitani N, Lucherini OM, Sozzi E, et al. Impaired expression of p66Shc, a novel reg-ulator of B-cell survival, in chronic lympho-cytic leukemia. Blood. 2010;115(18):3726– 3736.
7. Patrussi L, Capitani N, Cattaneo F, et al. p66Shc deficiency enhances CXCR4 and CCR7 recycling in CLL B cells by facilitating their dephosphorylation-dependent release from β-arrestin at early endosomes. Oncogene. 2018;37(11):1534–1550. 8. Capitani N, Patrussi L, Trentin L, et al. S1P1
expression is controlled by the pro-oxidant activity of p66Shc and is impaired in B-CLL patients with unfavorable prognosis. Blood. 2012;120(22):4391–4399.
9. Patrussi L, Capitani N, Cannizzaro E, et al. Negative regulation of chemokine receptor signaling and B-cell chemotaxis by p66Shc. Cell Death Dis. 2014;5(2):e1068.
10. Cattaneo F, Patrussi L, Capitani N, et al. Expression of the p66Shc protein adaptor is regulated by the activator of transcription STAT4 in normal and chronic lymphocytic leukemia B cells. Oncotarget. 2016;7(35): 57086–57098.
11. Patrussi L, Capitani N, Martini V, et al. Enhanced chemokine receptor recycling and impaired S1P1 expression promote leukemic cell infiltration of lymph nodes in chronic lymphocytic leukemia. Cancer Res. 2015;75 (19):4153–4163.
12. Bichi R, Shinton SA, Martin ES, et al. Human chronic lymphocytic leukemia modeled in mouse by targeted TCL1 expression. Proc Natl Acad Sci U S A. 2002;99(10):6955–6960. 13. Suljagic M, Longo PG, Bennardo S, et al. The Syk inhibitor fostamatinib disodium (R788) inhibits tumor growth in the Eμ-TCL1 trans-genic mouse model of CLL by blocking anti-gen-dependent B-cell receptor signaling. Blood. 2010;116(23):4894–4905.
14. Migliaccio E, Giorgio M, Mele S, et al. The p66shc adaptor protein controls oxidative stress response and life span in mammals. Nature. 1999;402(6759):309–313.
15. Stacchini A, Aragno M, Vallario A, et al. MEC1 and MEC2: two new cell lines derived from B-chronic lymphocytic leukaemia in prolymphocytoid transforma-tion. Leuk Res. 1999;23(2):127–36. 16. Patrussi L, Ulivieri C, Lucherini OM, et al.
p52Shc is required for CXCR4-dependent signaling and chemotaxis in T cells. Blood. 2007;110(6):1730–1738.
17. Yan X, Albesiano E, Zanesi N, et al. B cell receptors in TCL1 transgenic mice resemble those of aggressive, treatment-resistant human chronic lymphocytic leukemia. Proc Natl Acad Sci U S A. 2006;103(31):11713– 11718.
18. Dono M, Cerruti G, Zupo S. The CD5+ B-cell. Int J Biochem Cell Biol. 2004;36(11): 2105–2111.
19. Byrd JC, Furman RR, Coutre SE, et al. Targeting BTK with ibrutinib in relapsed chronic lymphocytic leukemia. N Engl J Med. 2013;369(1):32–42.
20. Johnson AJ, Lucas DM, Muthusamy N, et al. Characterization of the TCL-1 transgenic mouse as a preclinical drug development
tool for human chronic lymphocytic leukemia. Blood. 2006;108(4):1334–1338. 21. Kreiniz N, Beyar Katz O, Polliack A, Tadmor
T. The clinical spectrum of hepatic manifes-tations in chronic lymphocytic leukemia. clin lymphoma myeloma leuk. 2017;17(12): 863-869.
22. Carmier D, Dartigeas C, Mankikian J, et al. Serious bronchopulmonary involvement due to chronic lymphocytic leukaemia. Eur Respir Rev. 2013;22(129):416–419. 23. Pacini S, Pellegrini M, Migliaccio E, et al.
p66SHC promotes apoptosis and antago-nizes mitogenic signaling in T cells. Mol Cell Biol. 2004;24(4):1747–1757.
24. Till KJ, Lin K, Zuzel M, Cawley JC. The chemokine receptor CCR7 and alpha4 inte-grin are important for migration of chronic lymphocytic leukemia cells into lymph nodes. Blood. 2002;99(8):2977–2984. 25. Trentin L, Cabrelle A, Facco M, et al.
Homeostatic chemokines drive migration of malignant B cells in patients with non-Hodgkin lymphomas. Blood. 2004;104(2): 502–508.
26. Burger JA, Burger M, Kipps TJ. Chronic lym-phocytic leukemia B cells express functional CXCR4 chemokine receptors that mediate spontaneous migration beneath bone mar-row stromal cells. Blood. 1999;94(11):3658– 3667.
27. López-Giral S, Quintana NE, Cabrerizo M, et al. Chemokine receptors that mediate B cell homing to secondary lymphoid tissues are highly expressed in B cell chronic phocytic leukemia and non-Hodgkin lym-phomas with widespread nodular dissemi-nation. J Leukoc Biol. 2004;76(2):462–471. 28. Cyster JG. Chemokines,
sphingosine-1-phosphate, and cell migration in secondary lymphoid organs. Annu Rev Immunol. 2005;23:127–159.
29. Akram IG, Georges R, Hielscher T, Adwan H, Berger MR. The chemokines CCR1 and CCRL2 have a role in colorectal cancer liver metastasis. Tumor Biol. 2016;37(2):2461– 2471.
30. Bigildeev AE, Shipounova IN, Svinareva DA, Drize NJ. Leukemia cells invading the liver express liver chemokine receptors and pos-sess characteristics of leukemia stem cells in mice with MPD-like myeloid leukemia. Exp Hematol. 2011;39(2):187–194.
31. Zhao L, Lim SY, Gordon-Weeks AN, et al. Recruitment of a myeloid cell subset (CD11b/Gr1 mid) via CCL2/CCR2 pro-motes the development of colorectal cancer liver metastasis. Hepatology. 2013;57(2): 829–839.
32. Rose CE, Sung S-SJ, Fu SM. Significant involvement of CCL2 (MCP-1) in inflamma-tory disorders of the lung. Microcirculation. 2003;10(3–4):273–288.
33. Jeyanathan M, Afkhami S, Khera A, et al. CXCR3 signaling is required for restricted homing of parenteral tuberculosis vaccine– induced T cells to both the lung parenchyma and airway. J Immunol. 2017;199(7):2555– 2569.
34. Shetty S, Bruns T, Weston CJ, et al. Recruitment mechanisms of primary and malignant B cells to the human liver. Hepatology. 2012;56(4):1521–1531. 35. Hamblin TJ, Davis Z, Gardiner A, Oscier
DG, Stevenson FK. Unmutated Ig V(H) genes are associated with a more aggressive
form of chronic lymphocytic leukemia. Blood. 1999;94(6):1848–1854.
36. Gào X, Schöttker B. Reduction-oxidation pathways involved in cancer development: a systematic review of literature reviews. Oncotarget. 2017;8(31):51888–51906. 37. Pozzo F, Dal Bo M, Peragine N, et al.
Detection of TP53 dysfunction in chronic lymphocytic leukemia by an in vitro func-tional assay based on TP53 activation by the non-genotoxic drug Nutlin-3: a proposal for clinical application. J Hematol Oncol. 2013;6:83.
38. Allday MJ, Sinclair A, Parker G, Crawford DH, Farrell PJ. Epstein-Barr virus efficiently immortalizes human B cells without neu-tralizing the function of p53. EMBO J. 1995;14(7):1382–1391.
39. Zurli V, Wimmer G, Cattaneo F, et al. Ectopic ILT3 controls BCR-dependent acti-vation of Akt in B-cell chronic lymphocytic leukemia. Blood. 2017;130(18):2006–2017. 40. Robertson LE, Plunkett W, McConnell K,
Keating MJ, McDonnell TJ. Bcl-2 expression in chronic lymphocytic leukemia and its cor-relation with the induction of apoptosis and clinical outcome. Leukemia. 1996;10(3):456– 459.
41. Hildeman DA, Mitchell T, Aronow B, Wojciechowski S, Kappler J, Marrack P. Control of Bcl-2 expression by reactive oxy-gen species. Proc Natl Acad Sci U S A. 2003;100(25):15035–15040.
42. Marra F, Tacke F. Roles for chemokines in liver disease. Gastroenterology. 2014;147(3): 577–594.e1.
43. Belchamber KBR, Donnelly LE. Macrophage dysfunction in respiratory disease. Results Probl Cell Differ. 2017;62:299–313. 44. Trentin L, Agostini C, Facco M, et al. The
chemokine receptor CXCR3 is expressed on malignant B cells and mediates chemotaxis. J Clin Invest. 1999;104(1):115–121. 45. Ventura A, Luzi L, Pacini S, Baldari CT,
Pelicci PG. The p66Shc longevity gene is silenced through epigenetic modifications of an alternative promoter. J Biol Chem. 2002;277(25):22370–22376.
46. Pezzicoli A, Ulivieri C, Capitani N, Ventura A, Pelicci P, Baldari CT. Expression in T-cells of the proapoptotic protein p66SHC is con-trolled by promoter demethylation. Biochem Biophys Res Commun. 2006;349 (1):322–328.
47. Chen S-S, Raval A, Johnson AJ, et al. Epigenetic changes during disease progres-sion in a murine model of human chronic lymphocytic leukemia. Proc Natl Acad Sci U S A. 2009;106(32):13433–13438.
48. Pavlasova G, Borsky M, Seda V, et al. Ibrutinib inhibits CD20 upregulation on CLL B cells mediated by the CXCR4/SDF-1 axis. Blood. 2016;128(12):1609–1613. 49. Seda V, Mraz M. B-cell receptor signalling
and its crosstalk with other pathways in nor-mal and nor-malignant cells. Eur J Haematol. 2015;94(3):193–205.
50. Eichhorst B, Fink A-M, Bahlo J, et al. First-line chemoimmunotherapy with ben-damustine and rituximab versus fludara-bine, cyclophosphamide, and rituximab in patients with advanced chronic lympho-cytic leukaemia (CLL10): an international, open-label, randomised, phase 3, non-infe-riority trial. Lancet Oncol. 2016;17(7):928– 942.