UNIVERSITY OF CATANIA
DEPARTMENT OF CHEMICAL SCIENCES
INTERNATIONAL PhD IN CHEMICAL SCIENCES – XXXI CYCLE
Giuseppe Floresta
Design and synthesis of novel compounds as fatty
acids binding protein inhibitors and as gallium-68
chelators for positron emission tomography
PhD Thesis
Tutor: Prof. Antonio Rescifina
PhD Coordinator: Prof. Salvatore Sortino
Table of content
Chapter 1. Design, synthesis, and biological evaluation of small
molecule inhibitors of fatty acid binding protein 4 ... 1
1.1. Introduction ... 1
1.1.1. Physiological properties and functions of FABPs ... 2
1.1.2. The gene and its expression and regulation ... 4
1.1.3. Protein structure ... 4
1.1.4. The binding cavity ... 5
1.1.5. State of art ... 6
1.2. Computational approach for FABP4 inhibitor design ... 10
1.3. Structure-based approach for FABP4 inhibitor design... 11
1.3.1. Design of new inhibitors with thiazole and triazole core ... 17
1.3.2. Novel molecules with thiazole scaffold ... 20
1.4. Ligand-based approach for FABP4 inhibitor design ... 24
1.4.1. Biological data and Molecular modeling ... 24
1.4.2. Compound alignment ... 25
1.4.3. Statistical analysis and results ... 29
1.4.4. Discussion ... 33
1.4.5. Finding Bioisosteres and FDA approved drugs ... 34
1.4.6 Evaluation of AST_1–3 in the 3D-QSAR model ... 45
1.5. Synthesis of the leads compounds ... 45
1.6. FABP4 inhibition evaluation ... 47
1.7. Conclusion and perspective ... 47
Chapter 2. Design and synthesis of gallium-68 chelators for positron emission tomography ... 49
2.1. Introduction ... 49
2.1.1 68Ga uses and production ... 52
2.1.2 Targeting peptide bioconjugates against cancer ... 54
2.1.3 c-Met ... 56
2.1.4 GLP-1 ... 58
2.2. Design and synthesis of c-Met-peptide–THP ... 59
2.3. Design and synthesis of GLP-1-peptide–THP... 65
2.4.Radio HPLC and ITLC of C-met-peptide-THP and GLP-1-peptide-THP ... 68
2.5 Conclusion and perspectives ... 69
Experimental part ... 71
Molecular modeling and QSAR model ... 71
FABP Inhibitory Activity Assays. ... 78
General information for the synthesis ... 80
General procedure for the synthesis of the alcohols 10 ... 81
General procedure for the synthesis of ketones 11 ... 81
General procedure for the synthesis of α-Bromoketone 12 ... 82
General procedure for the synthesis of 2-Aminothiobenzamide 14 ... 82
General procedure for the synthesis of thiazole 15 ... 82
General procedure for the synthesis of 3-butynoic acid 17 ... 83
General procedure for the synthesis of final compound AST_1–3 ... 83
Synthesis of THP (19) ... 94
Synthesis of c-Met-peptide-THP ... 94
Formation of the disulfide bonds of c-Met-peptide-THP and THP coupling ... 95
Synthesis of GLP-1-peptide-THP ... 96
Materials for Gallium radiolabeling ... 97
Sample preparation for Gallium radiolabeling ... 98
c-Met-peptide-THP radiolabeling ... 99
GLP-1-peptide-THP radiolabeling ... 99
Abstract
Finding new small molecules targets as well as improving the diagnosis methodologies are two of the most important areas in which the researchers are spending efforts to improve our arsenal to fight cancer and other diseases. In this thesis, two different chapters are discussed. In the first one, the design of new Fatty acid binding protein 4 inhibitors is discussed. In the second one, the design of two targeting peptide bioconjugates for the detection of cancers is reported.
Fatty acid binding proteins are a class of proteins involved particularly in the transport of fatty acids in human. Recently it comes out that the Fatty acid binding proteins are an interesting molecular target for the treatment of type 2 diabetes, other metabolic diseases and some type of cancers. In this chapter (first), three new molecules inhibitors of the Fatty acid binding protein 4 are designed, using computer-aided drug design methodologies, and synthesized. The three molecules, AST_1–3, were synthesized and tested against the target protein and showed an IC50 between 3.70 and 5.59 µM.
Moreover, a huge number of different other molecules were theorized to be as effective as the three synthesized. Among them, some are derived from a virtual screening of an FDA approved drugs database and some from the bioisosteric scaffold-hopping analysis of a note inhibitor of the fatty acid binding protein 4 (BMS309403).
In the second chapter, two different targeting peptides, against two proteins involved in particular types of cancer (c-Met and GLP-1), were synthesized and then conjugated to a small molecule able to chelate gallium, for their potential applicability as PET tracers. The two compounds were then evaluated as effective 68-gallium chelating compounds and the result showed their capability in the binding of the
Chapter 1. Design, synthesis, and biological evaluation of small molecule inhibitors of fatty acid binding protein 4
1.1. Introduction
Fatty acids (FAs) are a class of carboxylic acids with a long aliphatic tail. The different FAs carry out many different vital functions in the organism.[1] They are one important source of energy, which is stored
in triacylglycerol and produced in muscles and liver. They are used for the biosynthesis of complex lipids, such as phospholipids and cholesterol, and they are also hormones and signaling compounds. These essential nutrients are normally obtained from the diet, released from the storage in adipocytes, or synthesized from glucose in the liver. There are different pieces of evidence showing that chronically elevated plasma fatty acid leads to some physiological disorders.[2] The elevated fatty acid levels in circulation are associated
with the pathogenesis of type 2 diabetes,[3] obesity,[4] and
atherosclerosis.[5] Obviously, because the fatty acids are slightly
soluble in water their trafficking requires a cluster of specific carrier proteins; normally, the different FAs are associated with albumin, lipocalins and fatty acid-binding proteins (FABPs), which highly increases their water solubility and thus facilitates their transport.[6]
FABPs are members of the superfamily of lipid-binding proteins (LBP). So far, nine different FABPs have been identified. The different FABPs have tissue-specific distribution, among them: L (liver), I (intestinal), H (muscle and heart), A (adipocyte), E (epidermal), Il (ileal), B (brain), M (myelin), and T (testis). Furthermore, the nine different types of FABPs can be divided into two groups: those associated with the plasma membrane (FABPPM) and the ones localized in the cytoplasm (FABPC).[7]
The adipocyte FABP (A-FABP), also called aP2 or FABP4, is highly expressed in adipocytes and it is regulated by peroxisome-proliferator-activated receptor-c (PPARc) agonists, by the level of insulin and by fatty acids.[8] It was reported that animal models with a deficiency of
FABP4 are protected against the development of insulin resistance.[9]
tolerance tests. Studies in FABP4-deficient mice[10, 11] have shown that
FABP4 has a significant role in many aspects of the metabolic syndrome. The lack of FABP4 partially protects mice against the progress of insulin resistance associated with genetic or with obesity. The adipocytes of these knockout animal models have a reduced efficiency of lipid transport both in vitro and in vivo. Interestingly, recent studies demonstrated that FABP4 is highly expressed in macrophages and regulated by the phorbol 12-myristate 13-acetate, by lipopolysaccharides, by oxidized low-density lipoproteins, and by PPARc ligands.[12] The macrophage is a fundamental site of FABP
action, and total or macrophage-specific FABP4-deficiency leads to a marked protection against early and advanced atherosclerosis.[13]
These findings show a significant part for FABP4 in the progress of different components of the metabolic syndrome through its different actions in adipocytes and macrophages. Aside from genetic approaches, pharmacological agents that modify FABP function can potentially mimic the phenotype of FABP4-deficient mice. Therefore, small molecules that inhibit FABP4-mediated responses might serve as potential candidates for many components of metabolic syndrome, such as insulin resistance, type 2 diabetes, and atherosclerosis. FABPs play also an important role in carcinogenesis.[14] Modified FABPs
expression patterns were described for prostate, bladder, renal cell carcinoma and other types of cancer cells,[15-17] but the biological
function of FABPs in cancer remains unclear.[18] The aim of this project
is to identify novel potent inhibitors of FABP4. Knowing the fundamental interactions of recognized inhibitors with the protein, new compounds were designed, with the help of computer-aided drug design, synthesized and biologically evaluated.
1.1.1. Physiological properties and functions of FABPs
Transport of FAs into cells is divided into three steps: (1) adsorption-binding to the outer leaflet of the plasma membrane; (2) crossing the membrane; (3) desorption-leaving the cytosolic leaflet of the plasma membrane. To allow an effective FAs flow proteins must catalyze each
step. There are two different types of FAs translocation across plasma membranes: (1) simple diffusion and (2) protein-mediated translocation. One of the classes of the proteins involved in the FAs translocation is a 43-kDa FABPPM, which was purified from
hepatocytes, adipocytes, jejunal enterocytes, and cardiac myocytes. Clarke et al. provided the first evidence that overexpression of FABPPM
in a mammalian tissue increase the FA transport. On the other hand, the FABPc can accelerate FA uptake in different ways: increasing the
rate of dissociation from membranes by raising the solubility of FA,[19]
and/or improving FA transfer to acceptor membranes by direct interaction with the phospholipid bilayer or by an aqueous diffusion-mediated process. FABPc proteins facilitate not only FA desorption, but
also the cytoplasmic diffusion. A role of FABPs in intracellular FA movement was supported by a series of experiments; thus, FABPs can be defined as transport proteins.[6]
Regulation of the lipid metabolism, due to the importance of energy homeostasis, involves many control systems, which need a precise and correct coordination.[20] Response to different signals triggers the
activation of specific transcription factors and the FAs can act such as signaling molecules. Several mechanisms of gene transcription mediated by FAs have been described. They include a series of events that lead to the modification of a transcription factor, for example: by the binding to a particular transcription factor and the subsequent activation of the transcription factor, by modifying the mRNA stability, and also by influencing the transcription factor expression.[21] It has
been revealed that increased FAs concentration start the process of preadipocyte differentiation and the expression of terminal differentiation-related genes, among them FABP4.[22, 23] One
important group of the transcription factors cooperating with FABPs is the peroxisome proliferator-activated receptor (PPAR) family.[24] PPAR
family members are nuclear receptors proteins well-knows for the regulation of the transcription of many genes involved in lipid metabolism.[25] FABPs may also have an effect on ligand-dependent
modulation of different cells growth and proliferation. L-FABP induced by two classes of peroxisome proliferators promotes mitogenesis of hepatocytes. H-FABP regulates cardiomyocyte growth and differentiation in neonatal mouse hearts and stimulates an increase in cell surface area, leading to cardiac myocyte hypertrophy. Furthermore, it specifically inhibits the growth of normal mammary epithelial mouse cells and is proposed as the breast tumor suppressor gene.[26]
1.1.2. The gene and its expression and regulation
Despite their large number, wide tissue distribution, and sequence variations, all the fatty acid binding proteins presumably derive from a single ancestral gene. The FABPs gene is found as a single copy and is similar to that of other different intracellular lipid binding proteins (iLBPs). The gene is composed of four exons separated by three introns.[27] The gene regulatory elements upstream of the gene differ
greatly within the family. An enhancer element is thought to be necessary and sufficient for FABP expression in differentiated adipocytes. This region may bind heterodimers of peroxisome proliferator-activated receptors and retinoid X receptors, which in turn bind a range of metabolites and drugs.[28] Other FABP gene regulatory
elements include a glucocorticoid response element for positive regulation, a CCAAT/enhancer binding protein site that responds to a decrease in insulin, and an activator protein 1 site that binds c-fos/c-jun heterodimers. A negative regulatory element also overlays part of this site.[28, 29]
1.1.3. Protein structure
Although the amino acid sequence identities of the iLBPs range from 20% to 70%, all known proteins structures, including FABPs, have a common tertiary structure as revealed on the basis of X-ray crystallography and nuclear magnetic resonance.[27] The tertiary
structure is common to all the family members and is characterized by a twisted barrel surrounding a hydrophobic core. The barrel is composed of ten antiparallel strands, organized into two sheets
oriented almost orthogonally, and on one end the barrel is capped by a little helix-turn-helix pattern.[30] Inside the barrel, there is a large
water-filled cavity lined with polar and hydrophobic amino acids. Interestingly, only a small portion of the cavity volume (1/3 to 1/2) is occupied by the single bound ligand. The carboxyl group of the FAs is oriented inwards and coordinated through electrostatic interactions with a tyrosine and two arginine residues. Helical N-terminus seems to be significant for the effective interplay between FABPs and membranes and dictates the overall rate of FA transfer. A comparison between the amino acids sequences of different FABPs revealed a wide variance in the primary structure. Based on amino acids sequence, FABPs can be divided into 3 groups: (1) L-FABP and Il-FABP; (2) H-FABP, B-FABP, E-FABP, M-FABP, A-FABP and T-FABP; and (3) I-FABP. Obviously, this division is reflected in the type of natural ligands of different classes of proteins. All proteins of group 1 (L-FABP and Il-FABP) are capable of binding FAs and bulky ligands, such as bile salts, cholesterol, and heme. Members of group 2 (H-FABP, B-FABP, E-FABP, M-FABP, A-FABP, and T-FABP) bind FAs and additionally retinoids and eicosanoids. I-FABP, the only member of the group 3, binds solely FAs, but in a different conformation than other FABPs.
1.1.4. The binding cavity
Since the first apo-FABP crystal structure appeared in 1992,[31]
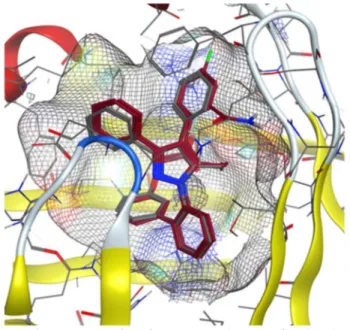
many holo-FABP structures with a range of ligands and several mutant structures have been solved and studied. The side chain variations generally conserve their hydrophobic character and therefore may only affect the inner cavity shape. The side chains engage a hydrogen bond to the carboxylate end of FAs, R126, and Y128, as well as R106, through a conserved water molecule, and have been shown to play a critical role in FABP ligand binding specificity and affinity.[32] Figure 1.1
shows the internal FABP4 binding site along with an internal water network that has been found in many of the FABPs crystal structures. Nevertheless, R106 is not strictly conserved; variation may occur with another basic residue, lysine. Since R126 and Y128 are found in many
iLBPs that bind different ligands, these residues are involved with binding affinity but do not exclusively determine the specificity of ligand binding.
Figure 1.1. Crystal structures and interaction of the apoprotein with a natural ligand,
oleic acid. PDB structure: 1LID.
1.1.5. State of art
In the past years, a variety of effective FABP inhibitors have been synthesized for antiatherosclerosis and anti-diabetes treatments, including derivatives of niacin, quinoxaline, aryl-quinoline, bicyclic
pyridine, urea, aromatic compounds, and other heterocyclic compounds.[33] Because FABP3 (H-FABP) and FABP4 are highly similar
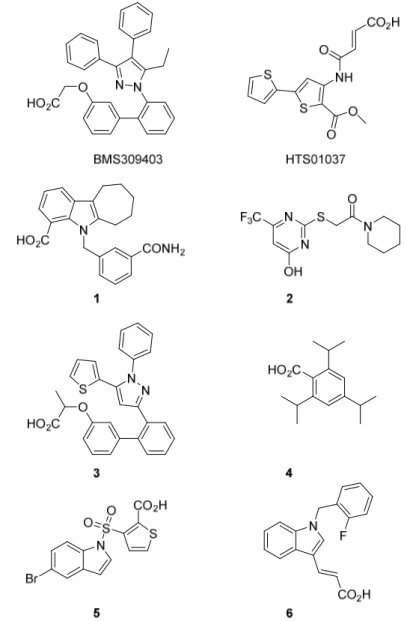
in their primary amino acid sequence and also in their three-dimensional structures, the issue of selectivity towards FABP3 and FABP4 must be considered during the research on FABP inhibitors. At present, no FABP4 inhibitors are in the clinical research phase. Several potent small molecules have been identified as FABP4 inhibitors, such as BMS309403 and HTS01037, but only BMS309403 has been systematically studied in both in vitro and in vivo animal diabetic models. Although the antidiabetic effects of BMS309403 have been well validated in mouse models, it has yet to be approved for clinical use. In Table 1.1 are shown the various classes of FABP4 inhibitors, among them: pyrazole derivatives, oxazole derivatives, imidazole derivatives, indole derivatives, benzimidazole derivatives, thiophene and thiazoles derivatives, pyrimidine, bicyclic pyridine and quinoxaline derivatives, and urea and carbamoyl derivatives. In Figure 1.2 are reported some representative example of the different classes of inhibitors designed and synthesized until now whereas in Table 1.2 there are reported their biological evaluations. Inspection of their structural features highlighted that the five-membered heterocyclic ring and the carboxylic group seem to be crucial for anti FABP4 potency.
Table 1.1. Various chemical classes of the FABP inhibitor. Chemical Classification Chemical Structure Pyrazole derivatives Oxazole derivatives Imidazole derivatives Indole derivatives Benzimidazole derivatives Thiophene and Thiazoles derivatives S R R R S N R R R Pyrimidine, Bicyclic Pyridine and Quinoxaline derivatives Urea and carbamoyl derivatives
Table 1.2. Measured biological activity of the FABP4 inhibitors. Compound IC50 or KiµM BMS309403[34] 0.71* HTS01037[35] 0.67** 1[36] 0.45* 2[37] 1.00* 3[38] 0.001** 4[39] 4.00* 5[40] 1.30* 6[41] 0.033** *Measured IC50; **Measured Ki
Three different virtual screening studies with libraries of different compounds have been already published and these have led to interesting results.[42, 43] Wang et al. have screened two different
libraries, one of natural compounds and one of FDA approved drugs, against FABP4. After the virtual screening and the biological test of the best-scored compounds, they have found that the quercetin, other flavonoids, and levofloxacin - an FDA already approved drug for the treatment of different bacterial infections - shoved a good percentage of inhibition of FABP4. Moreover, during the second year of Ph.D., I have collected and reviewed all of the compounds acting as FABP4 inhibitors.[33] The database of the collected compounds was then used
as a dataset for the building of a 3D-QSAR model, Section 1.4.
1.2. Computational approach for FABP4 inhibitor design
Computer-aided molecular design is an important aspect of drug design and discovery. In general, these methods for drug discovery and design can be divided into two categories: structure-based and ligand-based drug design.[44] In the first category, using available 3D structural
and other important biological information concerning the target protein, the binding energy of small molecule interacting with proteins targets are calculated. The 3D structural information is obtained either from experiment (X-ray or NMR determination of the protein
structure) or from reliable computational methods (i.e. homology modeling). Molecular mechanical (MM) as well as quantum mechanical (QM) approaches may be used to identify small molecules with binding affinity, and then to refine the structure of these small molecules toward higher binding affinity ones.[45-48] Often, the 3D
structural information of the target protein is not available and there is not a good template for homology modeling. In this case, the ligand-based methods such as QSAR are preferentially used. From the dataset obtained from a series of lead compounds, 2D or 3D descriptors are calculated. QSAR equations are derived based on the 2D descriptors and, usually, a pharmacophore model is created from the 3D descriptors. The QSAR equation and the pharmacophore model are used to suggest new compounds with improved activity.[49]
For hit identification and optimization the docking of small molecule and the scoring of their potential complementarity to the binding site of FABP4 were used as a preferential tool in the first part of the project. Later, a 3D-QSAR equation was developed to describe the pharmacophore of the FAPB4 and to virtually score different compounds. Among them: the best-scored compounds derived from the structure-based approach, but also a library of compounds derived from a scaffold hopping study of BMS309403 and a library of FDA approved drugs.
1.3. Structure-based approach for FABP4 inhibitor design
In the first part of the design of novel FABP4 inhibitors, the crystal structure of the protein complexed with BMS309403 (PDB code: 2NNQ) was used, by means of docking calculations.[50] After an initial
study of the binding site, the ligand structure was modified to better fit the target.
As shown in Figure 1.3, some free areas can be localized close to the two phenyl groups, in position 3 and 4 of BMS309403. Therefore, it was decided to design the first set of molecules with different substituents in these positions. The BMS309403 structure was used as a starting point for a systematic study of chemical modifications, to
improve the potency, and to explore the chemical space inside the binding pocket. The different poses were generated with AutoDock Vina and scored with the scoring function present in the same software. The results and the relative energy scored values are listed in Tables 1.3 and 1.4.
Table 1.3. Score values of BMS_1–28, modified structures of BMS309403.
Table 1.4. Score values of BMS_29–36, modified structures of BMS309403.
R1 N N R2 R3 Et BMS_29–36 O HOOC R = BMS_29 BMS_30 BMS_31 BMS_32 BMS_33 BMS_34 BMS_35 BMS_36 a CONH2 F H N N H O F O O O F HN F O O O O O b c d e f –11.8 –12.1 –10.9 –11.8 –11.3 –12.7 –10.9 –11.9 a a a a a a a a b c b d b e b f c b d b e b f b R1 R2 R3 kcal/mol
As shown by the docking results (Tables 1.3 and 1.4), in quite a number of cases different molecules have a better score than the starting compound (BMS309403), so, presumably, they should possess improved biological activity.
Moreover, the diversity of the amino acids residues present in the active site of the FABP4, compared to the ones of FABP3,[51] and
involved in the interaction with the ligand, can be exploited to increase the selectivity of the novel compounds against the FABP4 (Figures 1.4 and 1.5).
Figure 1.4. Sequence alignment of human FABP4 (2NNQ) and FABP3 (5CE4). The
sequence identity is 64% (green-highlighted).
Figure 1.5. Sequence alignment of human FABP4 (2NNQ) and FABP3 (5CE4). The
amino acids of the binding site are marked; those in red are different between the two proteins.
As shown in Figure 1.5 the active sites of the two different proteins are formed by 26 amino acid residues, but only eight are different between the two different forms. These differences of the amino acids expression in the active sites could be used for enhancing the activity against FABP4 compared with FABP3.
Analyzing the first set of designed molecules, BMS_1–24, we can see that they are placed in a similar manner to the original ligand (Figure 1.6). A halogen in the para-position of the two aromatic rings is tolerated, but only if it is fluorine; in fact, the score is worse with atoms with a larger radius. Positive results are obtained by the substitution of different position with a carboxyl and/or amide group. Both the carboxyl and the amide group are well tolerated when
located in the R2 position. The substitution of the R3 position with an
amide group leads to BMS_6 that is the molecule of the series with the best score. The two groups can still be inserted in the position R5 and
R6 and result again in a score better than the starting molecule. The
substitution at other positions of the molecule, R7–R9, has not given
promising results. In fact, in these positions, the resulting molecules are hardly able to create new interactions with the protein.
Concluding, the most interesting result of the series of molecules BMS_1–24 is the one of BMS_6; in fact, the molecule presents an excellent score compared to the starting compound (–11.4 vs. –10.5 kcal/mol). The better-calculated binding energy is due to a hydrogen bond with SER53 of the active site; importantly, this serine is replaced by THR53 in FABP3. Therefore, presumably, this interaction could enhance both the power and the selectivity of the molecule (Figure 1.7).
Figure 1.7. Interaction of BMS_6.
Better results were achieved by the second set of molecules, BMS_25–28, where two or three positions were substituted. With the third set of compounds, BMS_29–36, the steric hindrance of the molecules in one of the aromatic rings was increased, with interesting results. Apparently, the binding cavity tolerates a newly condensed
N O N N O O O H2 - H Phe 16 Met 20 Ala 33 Ala 36 Pro 38 Asn 39 Met 40 Ile 51 Lys 52 Ser 53 Glu 54 Ser 55 Phe 57 Lys 58 Thr 60 Glu 61 Ile 62 Ala 75 Asp 76 Arg 106 Val 115 Cys 117 Arg 126 Tyr 128
heterocycle in one of the two phenyl groups in position 3 and 4. The new bulky group can be easily accommodated in the binding pocket; this results in an improvement of the binding energy (Figure 1.8). Several molecules have been evaluated and in all of them, the amide group is always able to interact with the SER53. The best molecule of this series, BMS_34, has a score of –12.4 kcal/mol due to the synergism between the hydrogen bond with SER53 and the new interactions promoted by the heterocycle condensed to phenyl at the position 3.
Figure 1.8. Poses of BMS309403 (grey), and BMS_34 (burgundy).
1.3.1. Design of new inhibitors with thiazole and triazole core
The new information acquired during the first part of the project, dedicated to the study of the binding cavity and where new possibilities for selective interaction were assessed, have been used in the design of new compounds with thiazole and triazole core (Figure 1.9). The central core of the BMS309403 has not been already reported to be substituted with the selected thiazole and triazole scaffolds.
Figure 1.9. Newly designed compounds with thiazole and triazole core.
The design started by drawing and scoring new compounds with thiazole (SMS_0–11) and triazole central core (TAR_0–11). The designed molecules are shown in Table 1.5. Even in this case, the crystal structure of the FABP4 in complex with BMS309403 (2NNQ) was used as a starting point for docking studies of this set of virtual compounds.
As we can see from the docking results, different series of molecules show better score compared to the starting ligand BMS309403. The analysis of the generated poses shows that when the aromatic substituents to the central core are positioned in 3- or 4-position (as in BMS309403) the best-scored pose is very similar to the inhibitor in the crystal form (Figure 1.10).
Figure 1.10. Poses of BMS309403 (grey), and SMS_0 (burgundy).
However, when the substituents are in different positions the poses and the generated interactions are completely different (Figure 1.11). As shown in Figure 1.10, the compounds of the SMS series are able to get similar interaction to that of BMS309403. Otherwise, the presence of the two phenyl groups in a different position, TAR series, leads to a completely different pose of the molecule and to the loss of
fundamental interactions necessary to the inhibitory activity. As a matter of fact, some triazole derivatives, like TAR_1 and TAR_9, have shown interesting results, but the interactions with the binding site are completely different to that of the other series of designed compounds and so as the interaction of BMS309403.
Figure 1.11. Poses of BMS309403 (grey), and TAR_0 (burgundy).
Given the excellent results of the SMS series, it was decided to proceed in the design of other compounds with thiazole core, and discard, the idea of producing molecules with triazole nucleus.
1.3.2. Novel molecules with thiazole scaffold
Considering that the positions 4 and 5 of the thiazole ring have been extensively studied, the focus was now turned to the modification of the biphenyl group, which connects the thiazole 2-position (Figure 1.12) and the fundamental carboxylic group. It was decided to replace one of the two phenyls with a triazole ring, which can be easily inserted by a click-chemistry reaction, namely the azide-alkyne Huisgen cycloaddition. Four different series, with the triazole portion in a different position, have been designed and in silico evaluated (Figure
1.13).
Figure 1.12. Studied position of thiazole core.
Figure 1.13. Structures of novel designed thiazoles.
The molecules are evaluated, of course, using the same software and the same crystal structure of the previous series. In Figure 1.13 the scoring values of the newly designed molecules are shown. The most powerful molecules, according to these data, seem to be the molecule named AST_c1 (AST_1), with only one carbon atom as a linker between the triazole core and the carboxylic acid moiety.
Considering the molecule promising from the synthetic point of view, other two analogs of this compound were evaluated. The phenyl group in position 4 of the thiazole core was substituted with a naphthyl and with a 4-chlorophenyl group, in order to enhance the steric hindrance, as suggested by the first series of designed compounds (BMS); the results are shown in Figure 1.14.
Figure 1.14. Structures and scores of AST_1 and AST_2.
Compounds AST_1–3 were evaluated using AutoDock Vina and AutoDock4, as shown in Figure 1.14, and both methodologies gave excellent results. The predicted binding poses and the interactions are shown in Figures 1.15 and 1.16, respectively. Given the excellent results of the docking of these molecules in the FABP4 compared with the overall designed compounds (Figure 1.17), it was decided to focus the attention into these three compounds, after a secondary evaluation of the molecules by the prediction capabilities of a 3D-QSAR model (Section 1.4.6).
Figure 1.15. Poses of BMS309403 (grey), AST_1 (green), AST_2 (burgundy) and AST_3
Figure 1.16. Calculated interaction of AST_2 with FABP4.
Figure 1.17. Calculated binding energies with AutoDock Vina of the molecules
designed in the structure-based approach compared to the binding energy of BMS309403 (yellow-left). AST 1–3 bars are localized on the right of the graph surrounded by a red line.
1.4. Ligand-based approach for FABP4 inhibitor design
Once finished the design, by means of the structure-based approach, of the three compounds (AST_1–3), a 3D-QSAR model for the most potent and selective FABP4 inhibitors was developed. After an accurate selection of compounds, that have already been synthesized and tested against the FABP4 by other researchers, which we published as a review,[33] an internal dataset of molecules was used
to build a 3D-QSAR model. The model was built using a software of the Cresset group, Forge.[52]
As we already said, the computer-aided molecular design is an important aspect of drug design and, generally, these methods can be divided into two categories: structure-based and ligand-based drug design.[44] In section 1.3 was used the structure-based approach
whereas in this section the attention is focused on the development of a 3D-QSAR model for the already reported FABP4 inhibitors molecules.
Many 3D-QSAR processes determine descriptors by calculating structure properties at the interception points of a 3D grid, which surround the entire space of the aligned molecules. This is due because these methods have no way of knowing which region of space around the molecules is likely to be relevant to the molecular activity. However, Cresset’s field point description of molecules provides details about the area of space about a molecule relevant to the molecular description. The 3D-QSAR in Forge is characterized by the fact that uses probe positions that are definite directly from the field points of the aligned molecules training set, and only these positions are used to describe the electrostatic potential and the volume of each molecule. This 3D-QSAR model can help to unfold SAR data and to predict an activity value for new molecules and, on the other hand, will be used to further investigate the activity of AST_1–3.
1.4.1. Biological data and Molecular modeling
As mentioned earlier, several potent small molecules have been identified as FABP4 inhibitors. The 120 structures used to build and
evaluate the 3D-QSAR model were chosen among the structures previously published;[34, 36, 37, 39, 40, 53, 54] all molecules possess an
excellent selectivity toward the FABP4 and the range of activities is broad enough to be able to build a good model. The 2D chemical structures were constructed by Marvin Sketch, and all structures were subjected to molecular mechanics energy minimization using the MMFF94 force field present in the same software.[55] Once obtained
the 3D structures of all compounds the geometry was also optimized at semi-empirical level of theory using the PM3 Hamiltonian,[56] as
implemented in MOPAC 2016 package.[57]
1.4.2. Compound alignment
With the aim to generate a plausible and consistent set of alignment molecules, before running the regression analysis, we evaluated two different types of alignment (Figure 1.18).
First, we evaluated a structure-based alignment, based on the docking of the different ligands on the active site of the protein. All 120 structures, optimized at the PM3 level of theory, have been converted into pdbqt format using Babel,[58] and subsequently docked
in the active site of FABP4. Molecular docking was performed using the three-dimensional crystal structures of substrate-free fatty acid binding protein 4 in complex with BMS309403 (PDB ID: 2NNQ) obtained from the Protein Data Bank (PDB, http://www.rcsb.org/pdb). AutoDock Vina (version 1.1.2), a molecular docking program (downloadable at http://vina.scripps.edu) developed in the Molecular Graphics Lab at The Scripps Research Institute,[59] was used for all
docking experiments. The default values of the docking parameters in AutoDock Vina were maintained except for the exhaustiveness that was set to 15. A grid box of 18 Å × 18 Å × 18 Å encompassing the inhibitor binding cavity of FABP4 and centered on ligand was used. The binding modes were clustered through the root mean square deviation among the Cartesian coordinates of the ligand atoms. The docking results were ranked based on the binding free energy. Finished the calculation of AutoDockVina, all the generated structures
were manually checked, to ensure a correct positioning within the binding site. Then the generated structures were imported to Forge to build the Structure-based 3D-QSAR model.
Figure 1.18. Comparison of Alignment Methods.
The second type of alignment that was evaluated is a classic Ligand-based alignment, carried out with the same software used for the building of the model. All the optimized structures, accompanied by their respected IC50 values, were imported into Forge (10.4.2, Cresset,
Litlington, Cambridgeshire, UK, http://www.cresset-group.com/forge)
[52, 60-63] for setting-up the field-based 3D-QSAR model. Eight different
molecules were chosen as a template for the calculation of field points and as a template for the alignment. These eight molecules were selected because they are present in crystallized form with FABP4 (PDB IDs: 2NNQ, 3FR2, 3FR4, 3FR5, 4NNS, 4NNT, 1TOU and 1TOW, Table 1.6).[36, 37, 40, 50] The structures, small protein, and inhibitor, were
first downloaded from the Protein Data Bank (PDB), the amino acid sequence was then superposed and aligned with YASARA (version 17.8.15) to get even the ligands in the binding site aligned and
superposed, thus the eight molecules were imported on Forge (Figures 1.19 and 1.20).
Figure 1.19. Schematic representation of the process used to obtain the template
Table 1.6. PDB codes and molecules used as reference compounds for the
ligand-based alignment.
Figure 1.20. A) Protein and inhibitors aligned. B) Aligned inhibitors imported to Forge
for the ligand-based alignment.
PDB code 2D structure PDB code 2D structure
2NNQ 4NNT
3FR5 4NNS
3FR4 1TOW
The XED (eXtended Electron Distribution) force field was used to generate the field point. The force field calculates four different molecular field point: negative and positive electrostatic, van der Waals shape, and hydrophobic. The compounds in the training set were aligned to the reference compound by Maximum Common Substructure using a customized set-up for the conformation hunt:
• Max number of conformations: 500
• RMS cut-off for duplicate conformers: 0.5 Å
• Gradient cut-off for conformer minimization: 0.1 kcal/mol
• Energy window: 2.5 kcal/mol
The RMS cut-off for duplicate conformers parameter controls the similarity threshold below which two conformers are assumed identical. Conformations that gave a minimized energy outside the energy window were discarded.
All the alignments were manually checked to ensure the best possible model. All the field points of the training set were used to derive a gauge invariant set of sampling points, which reduced the number of descriptors that needed to be considered, with a distance of 1 Å between the sample points; sample values were calculated, ensuring that all areas around the molecule that might contribute to the activity are properly described.
1.4.3. Statistical analysis and results
The regression method used in Forge is PLS.[64-68] Specifically, the
SIMPLS algorithm was used. The following conditions were used to calculate the field QSAR models:
• Cross-validation type: Leave-one-out
• Number of times to run the leave-many-out operation: 1000
• Percent of data to leave out in leave-many-out mode: 20
• Maximum number of PLS components: 20
• Number of Y scrambles: 50
• Sample point minimum distance threshold: 1 Å
For the validation of the QSAR model, the leave-one-out method was used. 20 was the maximum number of components to extract
from the PLS regression. 50 was the number of Y scrambles to use, this means that in each scramble the activity values are randomly assigned to molecules and the model building is repeated. The higher the number of the scramble sets the stronger is the confirmation of statistical significance. The threshold of the sample point minimum distance was set to 1 Å. This option checks the sphere exclusion algorithm used to reduce the initial number of field sample positions down to a smaller set. Decreasing this value (Sample point minimum distance threshold) increases the number of sample points to consider, which on one hand may improve the model, but on the other hand, increase the probability of over-fitting. A value of 1 Å means that sample points must be at least 1 Å aside from each other. The Leave-one-out method was used during the validation of the QSAR model. This means that the model is built different times, and every single time a single molecule left out of the process, this is then repeated leaving out each training set molecule in turn.
The predictive ability of the generated QSAR models was confirmed by several statistical tests. The cross-validation regression coefficient (Q2) was calculated based on the PRESS (Prediction error sum of
squares) and SSY (Sum of squares of deviation of the experimental values from their mean):
= 1 − = 1 − ∑ −
∑ −
Yexp = experimental activity of training set compound Ypred = predicted activity of training set compound
Ymean = mean values of the activity of training set compound
The statistical results of both models are reported in Table 1.7 and Figure 1.21.
Table 1.7. 3D-QSAR models statistics.
Leave-one-out q2 Training set r2
3D-QSAR Based on Docked Poses 0.38 0.90 3D-QSAR Based on Forge Alignments 0.64 0.92
Figure 1.21. 3D-QSAR models statistics: up) 3D-QSAR based on docked poses; down)
3D-QSAR based on Forge alignments.
As is demonstrated by the previous data, the model built with the alignment of Forge is statistically more reliable than the model derived from the docked molecules, which is noisier.
At this point the best model, ligand-based 3D-QSAR align model, was taken as reference and further validated with a set of external compounds. In fact, more reliable estimation of robustness comes from separate training and test sets. Out of 120 molecules, we random choose 96 molecules as a training set to build the model while the remaining 24 compounds served as a test set to evaluate the model. In both the training set and the test set, the selected molecules cover
the whole range of activities of the compounds.
The performance of this model was also validated by the determination coefficient in prediction, R2
test, using the following
equation:
= 1 − ∑ −
∑ −
Ypredtest = predicted activity of test set compound by QSAR equation
Ytest = experimental activity of test set compound
Ymean = mean values of the activity of training set compound The results are shown in Figures 1.22 and 1.23. The 11-components model shows both good predictive and descriptive capability as it is shown by the good R2 (0.99) and Q2 (0.69)[69] values for the training
and the cross-validated training set (Figure 1.22). The plot of experimental vs. predicted activity for the compounds, in the training set and in the cross-validated training set (Q2 = 0.69), shows a
reasonable distribution of the values. The plot of experimental vs. predicted activity for the compounds in the test set (Figure 1.23) is still reasonably good with only few outliers and an excellent cross-validated R2 = 0.73.
Figure 1.22. The 11-components 3D-QSAR model - Experimental vs. Predicted
Figure 1.23. The 11-components 3D-QSAR model - Experimental vs. Predicted
activity of the compounds in the test set.
1.4.4. Discussion
Figure 1.24 shows the 3D visualization of the QSAR final model aligned with BMS309403. The model interpretation view shows the areas where the equation suggests that the local fields have a strong impact on activity. The larger the points the stronger is the correlation between the electrostatic/steric field in that position. In Figure 1.24, the 3D-QSAR model coefficients are superposed to the structure of BMS309403; this 3D-QSAR model is clearly described by both steric and electrostatic effects and well describes the comportment of the different classes of inhibitors inside the binding pocket of FABP4. Forge was used to building a statistically robust 3D-QSAR model for a set of 120 FABP4 inhibitors, covering a wide range of different classes of standard inhibitors of the receptor. As far as it concerns, this is the first 3D-QSAR model of this class of compounds that well describes the individual activities of each molecule.
Figure 1.24. Average of positive (red) and negative (blue) fields of actives. Average
hydrophobics of actives: favorable (green) and unfavorable (purple).
1.4.5. Finding Bioisosteres and FDA approved drugs
In order to design novel hit compounds with FABP4 inhibitory activity and using the above-reported information by the QSAR model, we decided to use a bioisostere and fragment replacement software tool (Spark; Cresset group), to produce a scaffold hopping analysis and generate a virtual library of FABP4 ligands.[70] On the other hand, a
library of FDA approved drugs was also evaluated. We studied the bioisosteric replacement in six different portions of BMS309403. All the different aromatic moieties of the molecules were studied by means of scaffold hopping as represented in Figure 1.25.
Once created, the new virtual compounds were scored assuming that if the fields of the newly designed molecules are very similar to that of the original compounds, the resulting compounds will have
similar biological properties.[71, 72] The bioisosteric replacement was
performed using the same 178,558 fragments for each part; in particular, the fragments derive from ChEMBL and Zinc databases (See Experimental section).[73, 74] Five hundred compounds were generated
for each substitution for a total of 3,000 compounds, which were then scored in the 3D-QSAR model, together with the FDA drugs (1314 molecules, downloaded from https://www.drugbank.ca/). For the bioisosteric replacement, the first top-scored compounds according to FABP4 predicted pIC50 are reported in Figure 1.26, while the top 25
compounds are reported as SMILE in the Tables 1.8–1.13. Furthermore, the 50 top scored FDA approved drugs are reported in the Table 1.14.
The predicted pIC50 of the top 25 compounds derived from the
bioisosteric replacement of series 1 are ranked between 6.1 and 5.8, those derived from the replacement of series 2 between 6.0 and 5.7, those derived from the replacements of series 3 between 6.5 and 5.9, those derived from the replacements of series 4 between 6.3 and 6, those derived from the replacements of series 5 between 6.7 and 6.0 and those derived from the replacements of series 6 between 7.3 and 6.2. Regarding the predicted activity of the FDA approved drugs, the 50 top scored compounds are ranked between 8.7 and 6.3.
Overall results indicate that the bioisosteric replacement and the following 3D-QSAR model evaluation give compounds with the appropriate chemical structure for the inhibition of FABP4. Interestingly, even from the FDA library, some compounds were predicted to have FABP4 inhibitor activity.
The most interesting results were the ones derived from the series 6 of the bioisosteric replacement and the ones derived from the FDA database. Interestingly, series 6 derived compounds have a structure partially different from the precursor compound BMS309403 but, despite these differences, the compounds retained the activity and the top scored have a better activity than the precursor. This information can be useful for the design of novel compounds with totally different central core and high FABP4 inhibitor activity. Regarding the results
derived from the screening of the FDA database is interesting to notice that different compounds were predicted to have a high affinity for FABP4; this means that part of their activity/side effects can be due to the interaction with FABP4. Actually, some FDA approved drugs were already identified as FABP4 ligands, among them: pimozide, levofloxacin, and trovafloxacin. [42, 75] The pimozide has an IC
50 of 11.38
µM in FABP4; however, the levofloxacin and trovafloxacin inhibit 70.01 and 57.46% the FABP4 at 10 µM. These results are in total agreement with the ones predicted by the 3D-QSAR scoring, where the pimozide, levofloxacin, and trovafloxacin have a predicted pIC50 of 5.1, 5.3 and
4.7, respectively.
Figure 1.26. First top-scored compounds derived from series 1–6 according to FABP4
predicted pIC50.
Table 1.8. 25 top scored compounds (predicted pIC50) derived from the series 1 of
the bioisosteric replacement.
1 [O-]C(=O)COc1cccc(-c2ccccc2-n3c(c(c(n3)-c4c(c(c(s4)C)C)C)-c5ccccc5)CC)c1 6.1 2 [O-]C(=O)COc1cccc(-c2ccccc2-n3c(c(c(n3)C4CCCCCC4)-c5ccccc5)CC)c1 6.0 3 [O-]C(=O)COc1cccc(-c2ccccc2-n3c(c(c(n3)-c4cn(c(c4)C)C)-c5ccccc5)CC)c1 6.0 4 Clc1ccc(O)cc1-c2c(c(n(n2)-c3ccccc3-c4cccc(OCC([O-])=O)c4)CC)-c5ccccc5 6.0 5 [O-]C(=O)COc1cccc(-c2ccccc2-n3c(c(c(n3)-c4cc5c(s4)ccs5)-c6ccccc6)CC)c1 5.9 6 [O-]C(=O)COc1cccc(-c2ccccc2-n3c(c(c(n3)-c4ccc5c(occ5C)c4)-c6ccccc6)CC)c1 5.9 7 [O-]C(=O)COc1cccc(-c2ccccc2-n3c(c(c(n3)-c4ccc(c(CC)c4)C)-c5ccccc5)CC)c1 5.9 8 [O-]C(=O)COc1cccc(-c2ccccc2-n3c(c(c(n3)-c4ccc(NC)cc4)-c5ccccc5)CC)c1 5.9 9 Clc1ccc(-c2c(c(n(n2)-c3ccccc3-c4cccc(OCC([O-])=O)c4)CC)-c5ccccc5)cc1O 5.9 10 [O-]C(=O)COc1cccc(-c2ccccc2-n3c(c(c(n3)-c4c(cc(s4)C)C)-c5ccccc5)CC)c1 5.9 11 [O-]C(=O)COc1cccc(-c2ccccc2-n3c(c(c(n3)-c4cc5cc[nH]c5s4)- 5.9
c6ccccc6)CC)c1 12 [O-]C(=O)COc1cccc(-c2ccccc2-n3c(c(c(n3)-c4cc5COCCc5s4)-c6ccccc6)CC)c1 5.9 13 [O-]C(=O)COc1cccc(-c2ccccc2-n3c(c(c(n3)-c4ccc5c(c(c[nH]5)C)c4)-c6ccccc6)CC)c1 5.8 14 [O-]C(=O)COc1cccc(-c2ccccc2-n3c(c(c(n3)-c4ccc(s4)NC)-c5ccccc5)CC)c1 5.8 15 [O-]C(=O)COc1cccc(-c2ccccc2-n3c(c(c(n3)-c4cccc(N)c4N)-c5ccccc5)CC)c1 5.8 16 [O-]C(=O)COc1cccc(-c2ccccc2-n3c(c(c(n3)-c4ccc([nH]4)C)-c5ccccc5)CC)c1 5.8 17 Oc1c(cc(cc1-c2c(c(n(n2)-c3ccccc3-c4cccc(OCC([O-])=O)c4)CC)-c5ccccc5)C)C 5.8 18 [O-]C(=O)COc1cccc(-c2ccccc2-n3c(c(c(n3)-c4cnc(OC)c(c4)C)-c5ccccc5)CC)c1 5.8 19 [O-]C(=O)COc1cccc(-c2ccccc2-n3c(c(c(n3)-c4cccc(N)c4)-c5ccccc5)CC)c1 5.8 20 [O-]C(=O)COc1cccc(-c2ccccc2-n3c(c(c(n3)-c4cc(oc4)C)-c5ccccc5)CC)c1 5.8 21 Clc1ccc(-c2c(c(n(n2)-c3ccccc3-c4cccc(OCC([O-])=O)c4)CC)-c5ccccc5)cc1N 5.8 22 [O-]C(=O)COc1cccc(-c2ccccc2-n3c(c(c(n3)-c4cccc(c4N)C)-c5ccccc5)CC)c1 5.8 23 [O-]C(=O)COc1cccc(-c2ccccc2-n3c(c(c(n3)-c4cccc(C5CC5)c4)-c6ccccc6)CC)c1 5.8 24 [O-]C(=O)COc1cccc(-c2ccccc2-n3c(c(c(n3)-c4ccc(N)c(N)c4)-c5ccccc5)CC)c1 5.8 25 [O-]C(=O)COc1cccc(-c2ccccc2-n3c(c(c(n3)-c4cc([nH]c4)C)-c5ccccc5)CC)c1 5.8
Table 1.9. 25 top scored compounds (predicted pIC50) derived from the series 2 of
the bioisosteric replacement.
1 Oc1c(OC)cccc1-c2c(nn(c2CC)-c3ccccc3-c4cccc(OCC([O-])=O)c4)-c5ccccc5 6.0 2 [O-]C(=O)COc1cccc(-c2ccccc2-n3c(c(c(n3)-c4ccccc4)-c5c[nH]cc5)CC)c1 5.9 3 [O-]C(=O)COc1cccc(-c2ccccc2-n3c(c(c(n3)-c4ccccc4)-c5ccc[nH]5)CC)c1 5.9 4 Oc1c(N)ccc(-c2c(nn(c2CC)-c3ccccc3-c4cccc(OCC([O-])=O)c4)-c5ccccc5)c1 5.9 5 Oc1c(sc(n1)N)-c2c(nn(c2CC)-c3ccccc3-c4cccc(OCC([O-])=O)c4)-c5ccccc5 5.9 6 [O-]C(=O)COc1cccc(-c2ccccc2-n3c(c(c(n3)-c4ccccc4)- 5.8
c5ccc(c(NC)c5)C)CC)c1 7 [O-]C(=O)COc1cccc(-c2ccccc2-n3c(c(-c4cccc(NCC)c4)c(n3)-c5ccccc5)CC)c1 5.8 8 Fc1cccc(O)c1-c2c(nn(c2CC)-c3ccccc3-c4cccc(OCC([O-])=O)c4)-c5ccccc5 5.8 9 [O-]C(=O)COc1cccc(-c2ccccc2-n3c(c(-c4cnc5c(c4)cc[nH]5)c(n3)-c6ccccc6)CC)c1 5.8 10 [O-]C(=O)COc1cccc(-c2ccccc2-n3c(c(c(n3)-c4ccccc4)-c5coc(N)c5)CC)c1 5.8 11 Clc1c(N)cccc1-c2c(nn(c2CC)-c3ccccc3-c4cccc(OCC([O-])=O)c4)-c5ccccc5 5.8 12 Oc1cc(O)c(O)cc1-c2c(nn(c2CC)-c3ccccc3-c4cccc(OCC([O-])=O)c4)-c5ccccc5 5.8 13 [O-]C(=O)COc1cccc(-c2ccccc2-n3c(c(c(n3)-c4ccccc4)-c5ccc(s5)N)CC)c1 5.8 14 Sc1c(N)ccc(-c2c(nn(c2CC)-c3ccccc3-c4cccc(OCC([O-])=O)c4)-c5ccccc5)c1 5.8 15 Oc1c(O)cc(cc1-c2c(nn(c2CC)-c3ccccc3-c4cccc(OCC([O-])=O)c4)-c5ccccc5)C 5.7 16 Oc1ccc(-c2c(nn(c2CC)-c3ccccc3-c4cccc(OCC([O-])=O)c4)-c5ccccc5)cc1OC 5.7 17 [O-]C(=O)COc1cccc(-c2ccccc2-n3c(c(-c4ccc5c(c4)cc[nH]5)c(n3)-c6ccccc6)CC)c1 5.7 18 FC(F)c1ccccc1-c2c(nn(c2CC)-c3ccccc3-c4cccc(OCC([O-])=O)c4)-c5ccccc5 5.7 19 Oc1cc(ncc1-c2c(nn(c2CC)-c3ccccc3-c4cccc(OCC([O-])=O)c4)-c5ccccc5)C 5.7 20 [O-]C(=O)COc1cccc(-c2ccccc2-n3c(c(c(n3)-c4ccccc4)-c5ccccc5NN)CC)c1 5.7 21 Brc1cc(-c2c(nn(c2CC)-c3ccccc3-c4cccc(OCC([O-])=O)c4)-c5ccccc5)co1 5.7 22 Brc1ccc([nH]1)-c2c(nn(c2CC)-c3ccccc3-c4cccc(OCC([O-])=O)c4)-c5ccccc5 5.7 23 Oc1c(O)cccc1-c2c(nn(c2CC)-c3ccccc3-c4cccc(OCC([O-])=O)c4)-c5ccccc5 5.7 24 Clc1cccc(-c2c(nn(c2CC)-c3ccccc3-c4cccc(OCC([O-])=O)c4)-c5ccccc5)c1O 5.7 25 [O-]C(=O)COc1cccc(-c2ccccc2-n3c(c(c(n3)-c4ccccc4)-c5c(OC)ccs5)CC)c1 5.7
Table 1.10. 25 top scored compounds (predicted pIC50) derived from the series 3 of
the bioisosteric replacement.
1 Brc1c(nc(nc1-c2ccccc2-c3cccc(OCC([O-])=O)c3)-c4ccccc4)-c5ccccc5 6.5 2 [O-]C(=O)COc1cccc(-c2ccccc2-n3c(N)c(c(c3C)-c4ccccc4)-c5ccccc5)c1 6.3 3 Clc1c(nc(nc1-c2ccccc2-c3cccc(OCC([O-])=O)c3)-c4ccccc4)-c5ccccc5 6.3 4 [O-]C(=O)COc1cccc(-c2ccccc2-c3c(c(nc(n3)-c4ccccc4)-c5ccccc5)CC)c1 6.3 5 Fc1c(nc(nc1-c2ccccc2-c3cccc(OCC([O-])=O)c3)-c4ccccc4)-c5ccccc5 6.2 6 [O-]C(=O)COc1cccc(-c2ccccc2/C(=N/Oc3ccccc3)c4ccccc4Oc5ccccc5)c1 6.1 7 OCCOc1c(c(nc(n1)-c2ccccc2-c3cccc(OCC([O-])=O)c3)-c4ccccc4)-c5ccccc5 6.0 8 [O-]C(=O)COc1cccc(-c2ccccc2-n3c4c(c(n3)-c5ccccc5)c(n[nH]4)-c6ccccc6)c1 6.0 9 [O-]C(=O)COc1cccc(-c2ccccc2OC[C@@H](Nc3ccccc3)COc4ccccc4)c1 6.0 10 [O-]C(=O)COc1cccc(-c2ccccc2-c3c(CCC)c(c([nH]3)-c4ccccc4)-c5ccccc5)c1 6.0 11 [O-]C(=O)COc1cccc(-c2ccccc2-c3csc4c(c(nn34)-c5ccccc5)-c6ccccc6)c1 6.0 12 [O-]C(=O)COc1cccc(-c2ccccc2-c3c(c(c([nH]3)-c4ccccc4)-c5ccccc5)CC)c1 6.0 13 [O-]C(=O)COc1cccc(-c2ccccc2-n3cc(c(c3CC)-c4ccccc4)-c5ccccc5)c1 6.0 14 O=C(O[C@@H]([C@H](OC(=O)C)c1ccccc1)c2ccccc2)c3ccccc3-c4cccc(OCC([O-])=O)c4 5.9 15 Clc1c(OC(=O)C)c(c(nc1-c2ccccc2-c3cccc(OCC([O-])=O)c3)-c4ccccc4)-c5ccccc5 5.9 16 [O-]C(=O)CCc1c(nn(c1-c2ccccc2)-c3ccccc3)-c4ccccc4-c5cccc(OCC([O-])=O)c5 5.9 17 [O-]C(=O)COc1cccc(-c2ccccc2-n3c4c(c(c(o4)-c5ccccc5)-c6ccccc6)c(n3)C)c1 5.9 18 [O-]C(=O)COc1cccc(-c2ccccc2-c3cc(c(n3C)-c4ccccc4)-c5ccccc5)c1 5.9 19 O=S(=O)(Nc1cc(c(cc1-c2ccccc2-c3cccc(OCC([O-])=O)c3)-c4ccccc4)-c5ccccc5)C 5.9 20 Clc1c(-c2ccccc2)cc(nc1-c3ccccc3-c4cccc(OCC([O-])=O)c4)-c5ccccc5 5.9 21 O=C(OC)c1c(c(nn1-c2ccccc2-c3cccc(OCC([O-])=O)c3)-c4ccccc4)-c5ccccc5 5.9 22 [O-]C(=O)COc1cccc(-c2ccccc2-c3cc(c(n3CC)-c4ccccc4)-c5ccccc5)c1 5.9 23 [O-]C(=O)COc1cccc(-c2ccccc2-c3c(c(c([nH]3)-c4ccccc4)-c5ccccc5)C)c1 5.9 24 [O-]C(=O)COc1cccc(-c2ccccc2[C@@H]3CN([C@](O3)(c4ccccc4)C)c5ccccc5)c1 5.9 25 [O-]C(=O)COc1cccc(-c2ccccc2-c3cc(c([nH]3)-c4ccccc4)-c5ccccc5)c1 5.9
Table 1.11. 25 top scored compounds (predicted pIC50) derived from the series 4 of
the bioisosteric replacement.
1 O=Cc1ccc(-c2ccccc2-n3c(c(c(n3)-c4ccccc4)-c5ccccc5)CC)cc1OCC([O-])=O 6.3 2 [O-]C(=O)Nc1c2c(sn1)ccc(-c3ccccc3-n4c(c(c(n4)-c5ccccc5)-c6ccccc6)CC)c2 6.3 3 Fc1ccc(-c2ccccc2-n3c(c(c(n3)-c4ccccc4)-c5ccccc5)CC)cc1[C@H](O)C([O-])=O 6.3 4 O=C(N1CCc2ccc(-c3ccccc3-n4c(c(c(n4)-c5ccccc5)-c6ccccc6)CC)cc21)CC([O-])=O 6.3 5 O=C(OC)c1ccc(-c2ccccc2-n3c(c(c(n3)-c4ccccc4)-c5ccccc5)CC)cc1OCC([O-])=O 6.3 6 O=C(OCC([O-])=O)N1CCC[C@H]1Cc2ccccc2-n3c(c(c(n3)-c4ccccc4)-c5ccccc5)CC 6.3 7 O=C(N1[C@H](CC[C@@H](C1)c2ccccc2-n3c(c(c(n3)-c4ccccc4)-c5ccccc5)CC)C)CC([O-])=O 6.2 8 O=C(c1c(cc(c(-c2ccccc2-n3c(c(c(n3)-c4ccccc4)-c5ccccc5)CC)c1)C)C)CC([O-])=O 6.2 9 Fc1ccc(-c2ccccc2-n3c(c(c(n3)-c4ccccc4)-c5ccccc5)CC)cc1CC([O-])=O 6.1 10 O=S(=O)(NC([O-])=O)c1ccc(s1)-c2ccccc2-n3c(c(c(n3)-c4ccccc4)-c5ccccc5)CC 6.1 11 Oc1cc(c(-c2ccccc2-n3c(c(c(n3)-c4ccccc4)-c5ccccc5)CC)cc1CC([O-])=O)C 6.1 12 [O-]C(=O)Cn1c2cc(-c3ccccc3-n4c(c(c(n4)-c5ccccc5)-c6ccccc6)CC)ccc2cn1 6.1 13 O=S(=O)(CC([O-])=O)c1nc(-c2ccccc2-n3c(c(c(n3)-c4ccccc4)-c5ccccc5)CC)cs1 6.1 14 Oc1ccc(S(=O)(=O)NC([O-])=O)cc1-c2ccccc2-n3c(c(c(n3)-c4ccccc4)-c5ccccc5)CC 6.1 15 O=C(N)c1ccc(-c2ccccc2-n3c(c(c(n3)-c4ccccc4)-c5ccccc5)CC)cc1NCC([O-])=O 6.1 16 Clc1ccc(-c2ccccc2-n3c(c(c(n3)-c4ccccc4)-c5ccccc5)CC)cc1OCC([O-])=O 6.1 17 O=S(=O)(NC([O-])=O)c1c(N)ccc(c1)-c2ccccc2-n3c(c(c(n3)-c4ccccc4)-c5ccccc5)CC 6.1 18 O=C(NCC([O-])=O)CCNc1ccccc1-n2c(c(c(n2)-c3ccccc3)-c4ccccc4)CC 6.1 19 O=C(N1C[C@H](S[C@@H](C1)C)c2ccccc2-n3c(c(c(n3)-c4ccccc4)-c5ccccc5)CC)CC([O-])=O 6.0 20 [O-]C(SSCCCc1ccccc1-n2c(c(c(n2)-c3ccccc3)-c4ccccc4)CC)=O 6.0 21 Oc1ccc(-c2ccccc2-n3c(c(c(n3)-c4ccccc4)-c5ccccc5)CC)cc1CC([O-])=O 6.0 22 O=C(SC([O-])=O)c1cccc(-c2ccccc2-n3c(c(c(n3)-c4ccccc4)- 6.0
c5ccccc5)CC)c1 23 Fc1ccc(-c2ccccc2-n3c(c(c(n3)-c4ccccc4)-c5ccccc5)CC)cc1/C=C\C([O-])=O 6.0 24 Fc1cc(F)c(cc1-c2ccccc2-n3c(c(c(n3)-c4ccccc4)-c5ccccc5)CC)CC([O-])=O 6.0 25 O=C1COc2ccc(-c3ccccc3-n4c(c(c(n4)-c5ccccc5)-c6ccccc6)CC)cc2N1CC([O-])=O 6.0
Table 1.12. 25 top scored compounds (predicted pIC50) derived from the series 5 of
the bioisosteric replacement.
1 O=C(NC([O-])=O)COC(=O)c1c(-n2c(c(c(n2)-c3ccccc3)-c4ccccc4)CC)ccs1 6.7 2 [O-]C(=O)c1nnc2n1N=C(c3ccccc3-n4c(c(c(n4)-c5ccccc5)-c6ccccc6)CC)CS2 6.5 3 O=C(O[C@H](C)C([O-])=O)c1ccccc1-n2c(c(c(n2)-c3ccccc3)-c4ccccc4)CC 6.4 4 O=C(N[C@H]1CCC[C@@H]([C@@H]1n2c(c(c(n2)-c3ccccc3)-c4ccccc4)CC)C)CSC([O-])=O 6.4 5 O=C1C(CCC([O-])=O)=CCN1CCn2c(c(c(n2)-c3ccccc3)-c4ccccc4)CC 6.3 6 O=C(N[C@H](CC([O-])=O)C)c1c(-n2c(c(c(n2)-c3ccccc3)-c4ccccc4)CC)ccs1 6.3 7 S/C(NCc1ccccc1-n2c(c(c(n2)-c3ccccc3)-c4ccccc4)CC)=N/C([O-])=O 6.3 8 [O-]C(=O)/N=C(\NCCc1ccccc1-n2c(c(c(n2)-c3ccccc3)-c4ccccc4)CC)N 6.3 9 O=C(OCC([O-])=O)CS[C@H](n1c(c(c(n1)-c2ccccc2)-c3ccccc3)CC)C 6.2 10 O=C(Nc1ccc(N)cc1-n2c(c(c(n2)-c3ccccc3)-c4ccccc4)CC)CCC([O-])=O 6.2 11 O=C(NCCC([O-])=O)c1cccn1-n2c(c(c(n2)-c3ccccc3)-c4ccccc4)CC 6.2 12 O=C(NCc1ccccc1-n2c(c(c(n2)-c3ccccc3)-c4ccccc4)CC)/C=C\C([O-])=O 6.2 13 O=C(OCC([O-])=O)CSCn1c(c(c(n1)-c2ccccc2)-c3ccccc3)CC 6.2 14 O=C(NCCC([O-])=O)c1ccc(N)cc1-n2c(c(c(n2)-c3ccccc3)-c4ccccc4)CC 6.1 15 [O-]C(=O)Cc1cn(nn1)C[C@H]2CC[C@H](O2)n3c(c(c(n3)-c4ccccc4)-c5ccccc5)CC 6.1 16 O=C(O[C@H](C)C([O-])=O)c1c(-n2c(c(c(n2)-c3ccccc3)-c4ccccc4)CC)c5ccccc5o1 6.1 17 Clc1cccc(NC(=O)CSC([O-])=O)c1-n2c(c(c(n2)-c3ccccc3)-c4ccccc4)CC 6.1 18 O=C(OCC([O-])=O)Cc1ccccc1-n2c(c(c(n2)-c3ccccc3)-c4ccccc4)CC 6.1 19 O=C(NCC([O-])=O)CSCCn1c(c(c(n1)-c2ccccc2)-c3ccccc3)CC 6.1 20 [O-]C(=O)[C@@H]1c2c(CCO1)cn(n2)CCn3c(c(c(n3)-c4ccccc4)-c5ccccc5)CC 6.1 21 Clc1cccc(-n2c(c(c(n2)-c3ccccc3)-c4ccccc4)CC)c1CC(=O)NCC([O-])=O 6.1
22 O=C(Nc1ccccc1-n2c(c(c(n2)-c3ccccc3)-c4ccccc4)CC)CCC([O-])=O 6.1 23 O=C(Oc1ccc(cc1-n2c(c(c(n2)-c3ccccc3)-c4ccccc4)CC)C)CCC([O-])=O 6.0 24 O=C(NCCC([O-])=O)c1c(-n2c(c(c(n2)-c3ccccc3)-c4ccccc4)CC)nc(s1)N 6.0
25 [O-]C(=O)Cc1ccccc1OCCn2c(c(c(n2)-c3ccccc3)-c4ccccc4)CC 6.0
Table 1.13. 25 top scored compounds (predicted pIC50) derived from the series 6 of
the bioisosteric replacement.
1 [O-]C(SC1=[N+][C@](C[C@@]2(Nc3ccccc3N12)c4ccccc4)(c5ccccc5)C)=O 7.3 2 O=C(NC(C([O-])=O)C([O-])=O)[C@H](Cc1ccccc1)c2ccccc2 7.2 3 S=C(N(Nc1ccccc1)c2ccccc2)CCCC([O-])=O 6.6 4 S=C(NN=C(Cc1ccccc1)Cc2ccccc2)C([O-])=O 6.5 5 O=C([C@@H]1[C@H](O[C@](O1)(c2ccccc2)C)c3ccccc3)[C@H](OC)C([ O-])=O 6.5 6 O=C(OC([O-])=O)CS[C@H]1[C@@H](O[C@@H](C1)c2ccccc2)c3ccccc3 6.5 7 [O-]C(=O)NCC[C@@H](c1ccccc1)COc2ccccc2 6.4 8 [O-]C(=O)CC([C@@H]([C@H]([C@H](c1ccccc1)C)c2ccccc2)C)=C 6.4 9 [O-]C(=O)[C@H]1[C@H](OC[C@@H](O1)[C@@H](Cc2ccccc2)c3ccccc3)O C 6.4 10 O=C(N(Cc1ccccc1)Cc2ccccc2)[C@@H](CC([O-])=O)C 6.4 11 O=C1[C@@H](N2C(=O)[C@](O[C@@]2([C@@H]3CCCN13)c4ccccc4)( c5ccccc5)C)CC([O-])=O 6.3 12 [O-]C(=O)/C=C\C[C@H](Cc1ccccc1)c2ccccc2 6.3 13 O=C1C[C@@H]([C@@H]([C@@H]1c2ccccc2)/C=C/[C@H](O)C([O-])=O)c3ccccc3 6.3 14 [O-]C(=O)NC[C@H]1C[C@@H]2CC[C@]1([C@@]2(c3ccccc3)C)c4ccccc4 6.3 15 [O- ][N+](=O)c1c(N)cc2c(C[C@H]([C@](O2)(c3ccccc3)C)c4ccccc4)c1C([O-])=O 6.2 16 [O-]C(=O)C(OC[C@H](Cc1ccccc1)c2ccccc2)C([O-])=O 6.2 17 [O-]C(O[C@H](OC)CC/C(c1ccccc1)=C/c2ccccc2)=O 6.2 18 O[C@]1(CCC[C@]2(CC[C@@H](C[C@@]12c3ccccc3)C(C([O-])=O)=C)C)c4ccccc4 6.2 19 Clc1ccc(N(Cc2ccccc2)Cc3ccccc3)cc1C([O-])=O 6.2 20 O=C(OC)[C@@H]1[C@@]2(O1)[C@@H](O[C@@H]([C@@H]2c3ccccc 3)c4ccccc4)CC([O-])=O 6.2 21 O[C@@H]1CC(=C[C@H]([C@H]1c2ccccc2)c3ccccc3)C(=O)C([O-])=O 6.2
22 O[C@@H](C[C@H]1[C@@]([C@@H]1c2ccccc2)(c3ccccc3)C)C(=O)C([ O-])=O 6.2 23 O[C@H]1[C@@H](C[C@@H](C[C@H]1CC([O-])=O)c2ccccc2)c3ccccc3 6.2 24 [O-]C(=O)[C@H]1C[C@H]1CC[C@@H](Nc2ccccc2)c3ccccc3 6.2 25 O=S(=O)(NC1[C@@]([C@@]1(c2ccccc2)C)(c3ccccc3)C)N(C)C([O-])=O 6.2
Table 1.14. 50 top scored FDA approved drugs with their predicted pIC50.
Cefditoren 8.7 Febuxostat 8.4 Alatrofloxacin 8.2 Eprosartan 8.2 Quinapril 7.9 Nedocromil 7.7 Pentosan Polysulfate 7.7 Sacubitril 7.6 Enalaprilat 7.3 Ceftriaxone 7.1 Riboflavin Phosphate 7.1 Penicillin G 7.0 Tizoxanide 7.0 Amfenac 6.9 Apixaban 6.9 Argatroban 6.9 Cabergoline 6.9 Cefixime 6.9 Gemifloxacin 6.9 Apremilast 6.8 Axitinib 6.8 Bromfenac 6.8 Dolutegravir 6.8 Azilsartan Kamedoxomil 6.8 Nalidixic Acid 6.8 Sulfathiazole 6.8 Aztreonam 6.7 Lodoxamide 6.7 Lomefloxacin 6.7 Cefotaxime 6.6 Cidofovir 6.6 Cinoxacin 6.6
Ketoprofen 6.6 Lisinopril 6.6 Quinaprilat 6.6 Benazeprilat 6.5 Eluxadoline 6.5 Finafloxacin 6.5 Moxalactam 6.5 Sulfasalazine 6.5 Belinostat 6.4 Besifloxacin 6.4 Dinoprost 6.4 Doxycycline 6.4 Ethacrynate 6.4 Meloxicam 6.4 Valdecoxib 6.4 Carglumic Acid 6.3 Felbamate 6.3 Ketorolac 6.3
1.4.6 Evaluation of AST_1–3 in the 3D-QSAR model
Considering the designed thiazoles AST_1–3 promising from the synthetic point of view, and promising accordingly with the docking results, the three molecules were also evaluated in the 3D-QSAR model. The molecules were imported into Forge and aligned with the 3D-QSAR model. Once aligned the molecules were scored assuming that if the fields of AST_1–3 are very similar to that of the original compounds, the resulting compounds will have similar biological properties.[71, 72] Interestingly, even in the ligand-based approach, the
selected molecules gave positive results. The three molecules AST_1– 3 were predicted to have a predicted pIC50 of 5.4, 5.9 and 5.6,
respectively, which correspond to an IC50 of 3.98, 1.25 and 2.51 µM. 1.5. Synthesis of the leads compounds
Considering that the three thiazole-based compounds AST_1–3 gave promising results in both the structure- and the ligand-based approaches, a synthetic pathway for the three compounds was designed. The synthesis (Scheme 1.1) starts from commercially
available aldehydes: benzaldehyde, naphthaldehyde, and 4-chloro benzaldehyde, and the Grignard reagent generated in situ by benzyl bromide and magnesium. After obtaining the secondary alcohol, this was first oxidized with PCC and then monohalogenated, at the alpha position, with bromine under acidic conditions. The 2-aminobenzene-1-carbothioamide was generated from the respective amide and the Lawesson’s reagent. Then the thioamide was reacted with the compound 12 to give the thiazole derivatives. After obtaining the butynoic acid by the oxidation of the 3-butyn-1-ol, and the azide, from the amine portion of compound 15 treated with t-BuONO and azidotrimethylsilane, the final structure was assembled by the azide-alkyne Huisgen cycloaddition in the copper(I) catalyzed variant, in which organic azides and terminal alkynes are united to afford 1,4-regioisomers of 1,2,3-triazoles as sole products.
R H O MgX R OH R O R O Br S NH2 O NH2 H2N H2N H2N N S R N3 N S R CuSO4, THF, 12h, rt Br2, CHCl3, 4h, reflux OH O HO N N S R N N O HO Lawesson's reagent MeOH, reflux 24h PCC,CH2Cl2, 4h, rt Br Et2O, 1h, –40 °C Et2O, 3h, rt R = Mg, Et2O, 1-3h, –40 °C CrO3, H2SO4, CH2Cl2, 3h, 0 °C TbuONO, TMSN3 THF,1h, 0 °C AST_1–3 7 8 9 10 11 12 13 14 15 16 17 Cl AST_1 AST_2 AST_3
1.6. FABP4 inhibition evaluation
Inhibition activity assay for FABP4 was performed by using a commercially available FABP4 inhibitor screening assay kit. FABP4 inhibition activity was determined by measuring the decreasing in fluorescence of a detection reagent present in the kit when displaced by an inhibitor of FABP4. In fact, the detection reagent exhibits increased fluorescence when bound to FABP4, the binding of the detection reagent can be monitored by exciting at 370 nm and measuring the emission at 470 nm. Therefore, any powerful inhibitor of such a protein can displace the detection reagent, which binds to the same binding pocket and thereby reducing the fluorescence. Inhibition activity data are expressed as IC50 (µM) and obtained results
are outlined in Table 1.14. Arachidonic acid, a known powerful ligand of FABP4, was used as a positive control and revealed an IC50 of 3.06
µM. Our set of compounds, AST_1–3, revealed IC50 values of 5.59,
3.70, and 4.31, respectively.
Table 1.14. measured IC50 values for Arachidonic acid and AST_1–3 in FABP4.
Compounds IC50 (µM)
Arachidonic acid 3.06 ± 0.22
AST_1 5.59 ± 0.79
AST_2 3.70 ± 0.34
AST_3 4.31 ± 0.67
1.7. Conclusion and perspective
FABP4 provides an attractive therapeutic and diagnostic target for a variety of diseases. FABP4 plays a relevant role in the development of insulin resistance, atherosclerosis, and metabolic diseases; therefore, the inhibition of such a transporter can be useful for the treatment of these diseases, as demonstrated by the animal models.
[76-79] FABP4 inhibitors could also be effective for the treatment of
cancer patients via the inhibition or reduction of early-stage tumors and metastasis, and can also be effective as a biomarker for the diagnosis of different types of cancer.[80-86]
is possible to identify an agent for its effect on the treatment of a neurological disorder by testing the agent for its ability to modulate the interaction of an endocannabinoid with an intracellular FABP. Therefore, FABP inhibitors could also be used for the treatment of neurological disorders.
In this project, different molecules were theorized as possible inhibitors of FABP4 by means of CADD. Particularly, using a bimodal approach; structure-based followed by ligand-based, three new potent ligands of FABP4 were individuated and synthesized. Their effective binding properties toward FABP4 were tested by means of a displacement assay and the three molecules results as FABP4 binders with an IC50 between 3.70 and 5.59 µM. Moreover, a huge number of
different other molecules were theorized to be as effective as the three synthesized, and interesting results also came out from the scaffold hopping of the BMS309403 and from the evaluation of an FDA approved drugs database in the QSAR model. Accordingly, with these results, a simple modification of different part of the gold standard BMS309403 can retain the activity and in different cases can also improve the activity of the molecule, and different already approved drugs can be effective FABP4 binders. These findings, of course, should be verified but can be a good starting point for the researchers in the field, particularly considering that the same model that is predicting these results was effective in predicting the ability of the synthesized and tested compounds AST_1–3. Surely, all of these findings will lead our future research in the field of the development of FABP4 inhibitors considering this transporter as a very promising target the ultimate goal is to finally bring optimal molecules into clinical research phase.


![Table 1.2. Measured biological activity of the FABP4 inhibitors. Compound IC 50 or K i µ M BMS309403 [34] 0.71* HTS01037 [35] 0.67** 1 [36] 0.45* 2 [37] 1.00* 3 [38] 0.001** 4 [39] 4.00* 5 [40] 1.30* 6 [41] 0.033** *Measured IC 50 ; **Measured](https://thumb-eu.123doks.com/thumbv2/123dokorg/4480230.32303/18.748.92.600.139.370/table-measured-biological-activity-inhibitors-compound-measured-measured.webp)