Research Article
Oxidative Stress Biomarkers: Establishment of Reference
Values for Isoprostanes, AOPP, and NPBI in Cord Blood
Mariangela Longini,
1,2Elisa Belvisi,
1Fabrizio Proietti,
1Francesco Bazzini,
1Giuseppe Buonocore,
1and Serafina Perrone
11Department of Molecular and Developmental Medicine, University of Siena, Siena, Italy 2UOC Clinical Pathology AOU Senese, Siena, Italy
Correspondence should be addressed to Fabrizio Proietti; [email protected] Received 28 February 2017; Accepted 19 March 2017; Published 23 April 2017 Academic Editor: Emanuela Turillazzi
Copyright © 2017 Mariangela Longini et al. This is an open access article distributed under the Creative Commons Attribution License, which permits unrestricted use, distribution, and reproduction in any medium, provided the original work is properly cited.
Oxidative stress (OS) is a common pathogenic factor involved in the onset of several diseases in humans, from immunologic disorders to malignancy, being a serious public health problem. In perinatal period, OS has been associated with adverse outcome of pregnancy and neonatal diseases. Dangerous effects of OS are mediated by increased production of free radicals (FRs) following various mechanisms, such as hypoxia, ischemia reperfusion, hyperoxia, inflammation, mitochondrial dysfunction, Fenton chemistry, and prostaglandin metabolism. FRs have short half-life, and their measurement in vivo is faced with many challenges. However, oxyradical derivatives are stable and thus may be measured and monitored repeatedly. The quantification of OS is based on the measurement of specific biomarkers in biologic fluids and tissues, which reflect induced oxidative damage to lipids, proteins, and DNA. Prostanoids, non–protein-bound iron (NPBI), and advanced oxidation protein products (AOPP) are actually considered truly specific and reliable for neonatal injury. Defining reference values for these biomarkers is necessary to investigate their role in neonatal diseases or also to evaluate the success of treatments. In this work, we wanted to define laboratory reference values for biomarkers of OS in a healthy population of term newborns.
1. Introduction
Oxidative stress (OS) has been defined “a state where
oxidative forces exceed the antioxidant systems due to loss
of the balance between them” [1]. OS reflects the tissue
damage resulting from an imbalance between excessive gen-eration of oxidant compounds and insufficient antioxidant defense mechanisms [2]. Oxidant compounds are extremely reactive species capable of independent existence that con-tains one or more unpaired electron, named free radicals (FRs). They are either endogenous and/or exogenous [1, 3]. Because of their high reactivity, they can abstract electrons from other compounds to obtain stability. Thus, the attacked molecule loses its electron and becomes a FR itself,
begin-ning a chain-reaction cascade, which finally damages the
organism’s structure and functions. OS is well known to
be involved in the pathogenesis of lifestyle-related diseases, including hypertension, diabetes mellitus, ischemic diseases,
malignancies, or Alzheimer’s disease, Parkinson’s disease, and amyotrophic lateral sclerosis [1, 3, 4]. Oxidative
com-pounds are also physiologically relevant in inflammation
and tissue repair processes. Hence, they represent some defense mechanisms against microorganisms and malig-nant cells as well as tissue healing and remodeling [4]. OS is known to be harmful because of the FR that attacks biological molecules, like lipids or proteins, and also DNA. Still, OS has also a useful role in physiologic adaptation and in the regulation of intracellular signal transduction [5]. Oxidative damage has been identified in the pathogenesis of many preterm newborn diseases, such as retinopathy of prematurity (ROP), bronchopulmonary dysplasia (BPD), necrotizing enterocolitis (NEC), patent duc-tus arteriosus (PDA), periventricular leukomalacia (PVL), and
intraventricular hemorrhage (IVH) [6–11]. Hypoxia,
hyper-oxia, ischemia, and inflammation are main mechanisms of FR overproduction [12–19]. After the occurrence of
hypoxia-ischemia, iron ions, serving as transition metal mole-cules catalyzing hydroxyl radical production via the Fenton reaction and the Haber-Weiss cycle, accumulate in cells. Iron and FRs may result in DNA strand breaks [20],
pro-tein and lipid peroxidation [21], and cellular inflammation
and death [22, 23].
The accurate measurement of OS in vivo is necessary to investigate their role in lifestyle diseases or also to evaluate the success of treatment. FRs have very short half-life (of the order of few seconds), and their measurement in vivo is faced with many challenges. However, oxyradical derivatives (e.g., hydrogen peroxide or lipid hydroperoxides) are stable and have long half-life (hours to weeks) and thus may be measured and monitored repeatedly.
The quantification of OS is based on the measurement of specific biomarkers in biologic fluids and tissues, which reflect induced oxidative damage to lipids, proteins, and DNA or an increased risk for injury to macromolecules. Several biomarkers have been proposed for OS detection, but only a small number of them can be considered truly
specific and reliable for OS injury; these include prostanoids,
non–protein-bound iron (NPBI), and advanced oxidation protein products (AOPP) [11, 24, 25].
1.1. Prostanoids. Prostanoids are a family of lipid mediators generated by the action of cyclooxygenase on long-chain unsaturated fatty acids. The mechanism involved in their formation implies that FR insult causes hydrogen abstraction from arachidonic acid and addition of molecular oxygen to form a peroxyl radical [26]. The following intermediates undergo double 5-exo-trig cyclization and addition of second molecular oxygen to form prostaglandin G2-like compounds, which are rapidly reduced to F2-IsoPs [27, 28]. These pros-tanoids are more stable compared with other peroxidation products, such as aldehydes or peroxyl radicals; thus, they
can be detected in biologic fluids [29]. Prostanoids can be
measured in plasma, tissues, cells, urine, cerebral spinal fluid, bile, and bronchoalveolar lavage fluid [30] for the assessment of in situ oxidative injury. F2-IsoP detection and measurement requires sophisticated and expensive methods, such as liquid chromatography/mass spectrome-try. IsoPs are chemically stable in vitro and in vivo and are
specific and reliable markers of lipid peroxidation. They
are thus reliable markers of in situ oxidative injury [30]. 1.2. Non–Protein-Bound Iron (NPBI). In physiologic condi-tions, iron is safely sequestered by transport proteins, such as transferrin and lactoferrin, and stored in proteins, such as ferritin and hemosiderin [31].
Because iron ions cannot be free in plasma, the term NPBI was introduced to indicate a low-molecular-mass iron form, free from binding to plasma proteins. NPBI levels can be measured using high-performance liquid chromatography [32]. Iron toxicity is inversely proportional to the presence of ferritin, which is able to bind and detoxify ferrous ion, and directly proportional to the quantity of hydrogen peroxide to produce hydroxyl radicals through the Fenton reaction. Furthermore, lipid exposure to high concentration of NPBI leads to the formation of IsoPs.
Non–protein-bound iron is a marker of potential OS
because it indicates increased susceptibility to oxidative damage especially in in vivo studies [24].
1.3. Advanced Oxidation Protein Products (AOPP). AOPP is a very important biomarker of OS because the proteins are the major targets of FRs, being present and abundant in cells, plasma, and most tissues [11]. It was severally reported that AOPP level increases in hypoxic newborns, especially pre-term babies [25, 33]. Radical-induced damage to proteins is not the terminal process of a reaction but is an enhancer of tissue damages, very common in preterm babies. AOPP
remain stable during sample storage both at −20 and at
−80°C for six months, allowing for batched analysis of
progressive specimens [11]. AOPP are measured using spectrophotometry on a microplate reader. The instruments were calibrated with chloramine-T solutions that absorb at 340 nm in the presence of potassium iodide.
RIs of the OS biomarkers in cord blood are important for screening, diagnosis, and monitoring of perinatal diseases. Reference values for these biomarkers are currently lacking.
The aim of this study is to produce the reference intervals (RIs) for OS markers in cord blood.
2. Materials and Methods
The study was conducted in 120 term newborns (58 males and 62 females), with a gestational age (GA) between 38 and 42 weeks, born from vaginal delivery in Siena, Policlinico le Scotte, AOU Senese, Italy, from 01/01/2016 to 30/04/2016. None of the infants required medical care. Newborns with clinical signs of hypoxia ischemia, infection, major congeni-tal malformations, inborn errors of metabolism, and blood group incompatibility were excluded from the study. Birth weight was adequate for gestational age in all enrolled newborns. 120 samples of cord blood for F2-IsoPs, AOPP, and NPBI were examined. The treatment of the sample was previously standardized according to internal protocols of the laboratory. The cordo blood was collected in serum tubes (Sarstedt, S-Monovette Serum gel) and centrifuged promptly
after collection, and serum aliquots were preserved at−80°C
in Sarstedt Eppendorf Type D (CLSI/NCCLS document H18) [34].
In some aliquots (for the assay of F2-IsoPs), BHT (butylated hydroxytoluene) was added to inhibit the lipidic peroxidation in vitro. All samples were collected within four months.
Inclusion criteria were applied in the second days of life evaluating the clinical conditions and the history of the neonate.
The number of enrolled cases was decided following IFCC guidelines. The Clinical Laboratory Standards Institute (CLSI) recommends a minimum of 120 individuals; this is the minimum sample size required to determine 90%
confidence intervals (CI) for the 95th percentile reference
limits (2.5th and 97.5th percentiles).
The preanalytical phase has been standardized: the permanence time in the freezer is not higher than four
months; for these reasons, we have chosen to enlist a smaller number of cases, but certainly more homogeneous.
The LC-MS/MS method of Casetta et al. [30] was followed for determination of F2-IsoPs (API 4000 Tandem Mass Spectrometer coupled with HPLC Agilent 1200
series), the method of Paffetti et al. [24] for NPBI with
HPLC-DAD system (Agilent 1100 series), and the spectro-photometric method of Witko-Sarsat et al. [35] for AOPP detection.
The methods that we used describe the analytical imprecision, the limit of detection, the linearity, the recovery, the interference characteristic, and the traceability of the results. Hemolytic samples were excluded. All samples for each method were measured in double, in three different days in the same conditions, with the same lot and technologist variability, from the same people. Previously, tests on the storage stability were made.
3. Statistical Analysis
We used an“a posteriori” approach.
The indirect method of sampling suggested by Horn and Pesce [36] was used to estimate IRs for F2-IsoP, NPBI, and AOPP in cord blood sample of newborn.
The descriptive statistical analysis, after the D
’Agostino-Pearson test for normality of population was performed, included median and IQR. The RIs were calculated using a nonparametric method as described in the CLSI guidelines C28-A3. The IFCC recommends that a minimum number of subjects of 120 should be recruited to derive RIs.
Statistics were performed using SPSS version 20 (IBM Corporation, NY, USA).
4. Results
Serum samples from 120 umbilical cords were used to calculate reference RIs for 3 specific markers of OS measured with chromatography (HPLC), liquid chromatography/mass spectrometry (LC/MS/MS), or spectrophotometry methods. All infants were from a normal pregnancy ended in a spontaneous delivery. During pregnancy, the mothers followed the same living and eating style.
Demographic and clinical characteristics of the study population are reported in Table 1.
Sample size, median, 25 and 75 percentiles for OS
markers in cord blood, and P values computed by the
D’Agostino-Pearson test for normality (Sheskin, 2011) are detailed in Table 2.
RIs, 90% CI, and medians are calculated with a right side nonparametric method (CLSI C28-A3) for OS markers in cord blood and are provided in Table 3.
Our data showed a“right sided” distribution with only an
upper limit of reference and no lower limit. Outliers have been removed using the Tukey test.
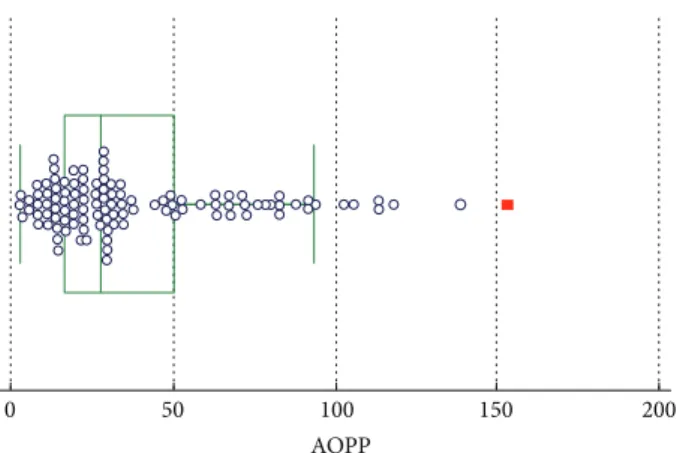
In Figures 1–3, groups of numerical data through their
quartiles are graphically depicted (box and whisker plot).
Outliers are plotted asfilled points.
5. Discussion
Our study was born from the need to provide reference values for markers of OS.
Clinical laboratory data are not used if they cannot be related with the own RIs. The value of a laboratory data is helpful only if it is compared with the RIs.
The RIs can be a single cut, a series of cut-offs, or a range of values containing 95% of the results of a reference population. There are more possibilities to compare the laboratory data: the most used are the reference collective values. These are essential for screening, detection, and mon-itoring of diseases. They are the most used but are not easy to produce.
They should be determined on a representative sample of the patient population where the test will be used. The most
common definition of the RIs is the range of values
con-taining the central 95% of the healthy population. If the reference limits are the values at 2.5% and 97.5%, the
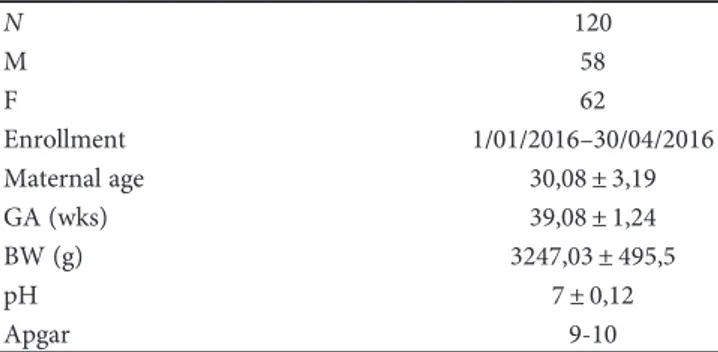
Table 1: Demographic and clinical characteristics of the study population. N 120 M 58 F 62 Enrollment 1/01/2016–30/04/2016 Maternal age 30,08± 3,19 GA (wks) 39,08± 1,24 BW (g) 3247,03± 495,5 pH 7± 0,12 Apgar 9-10
N: sample number; M: male; F: female; GA: gestational age; BW: birth weight.
Table 2: Summary statistic for oxidative stress markers in cord blood.
Sample size Median Percentiles (25°–75°) P (D’Agostino Pearson) AOPP 120 27.90 16.40–50.50 <0.0001 NPBI 120 0.80 0.2–3.53 <0.0001 Isoprostanes (pg/mL) 120 66.30 41.02–83.70 <0.0001
Table 3: Reference interval—right side nonparametric method (CLSI C28-A3) for OS markers in cord blood.
Analytes Upper limit Median Higher 90% CI (bootstrapaCI) AOPP (μmol/dL) 80.39 27.90 68.94–92.28 NPBI (μmol/L) 6.91 0.80 5.48–8.30 Isoprostanes (pg/mL) 124.47 66.30 114.31–136.58
other 5% of the “healthy” population is to be classified as “abnormal” or “positive”.
These data allow you to compare the values of a patient with the reference data of the reference population, but they have no value for the medical decision levels.
We decided to measure F2-isoprostanes, non
–protein-bound iron (NPBI), and advanced oxidation protein products (AOPP) as markers of OS damage since they are
considered truly specific and reliable to evaluate the OS damage. Moreover, we used methodologies with a high sensitivity and specificity.
The RIs were produced by following safe guidelines edited by the Clinical and Laboratory Standard Institute used for the making of sample collection, the process of analysis, and statistical processing.
Specific guidelines related to production protocol are
proposed for establishing RIs. These procedures include the choice of the preanalytical and analytical phases, the calcu-lation methods, and the requirements for estimating valid reference intervals [37–40].
Ideally, RIs should be determined by sampling a healthy population using a direct sampling method (“a priori”). The direct technique conforms to the International Federation of Clinical Chemistry and Laboratory Medicine (IFCC) recommendations, and it is preferred. However, the par-ticularity of populations and the time involved in obtaining a representative group of reference individuals may be overcome with the indirect method. The working groups acknowledge that, in this circumstance, it may be very diffi-cult to have a priori method and they advocate the use of indirect methods in which specific statistical tests for small populations are applied [41–43].
In a posteriori method, all the processes (exclusion and partition of reference individuals) occur after a biological sample is collected and analyzed.
It involves application of statistical methods to ana-lytical values collected in an already made database with-out previous choice of reference individuals. The indirect technique may have clinical utility in selected situations, including pediatrics and the elderly population where col-lecting a sufficient numbers of reference samples may be difficult [41–43].
This method is based on the concept that many results,
even on hospital patients, may be “normal.” Many studies
used data from all hospital patients to produce reference values. In this study, we enrolled neonates that were born healthy at the end of a physiological pregnancy and were discharged from hospital in the second days of life.
The production of reference values seems to be quick and easy, but it is quite a laborious process as reported in the lines of the expert group on the reference value theory (EPTRV) of the International Federation of Clinical Chemistry and Laboratory Medicine (IFCC) and in the Standing Committee on the reference values—International Council for the stan-dardization of procedures hematology (ICSH) [37].
In our study, the guidelines for the production of reference values have been produced by using the C28-A2 of the National Committee for Clinical Laboratory Standards (NCCLS).
We choose a representative group of the population that will be tested. The reference group should be free from
disease and conditions that could lead to an “abnormal”
result. We established criteria to exclude individuals with factors that can affect the test.
Reed et al. [42] suggest that a minimum of 120 observa-tions, each one from a referent subject, should be available for analysis. This has the advantage of also allowing 90%
0 50 100
AOPP
150 200
Figure 1: Box and whisker plot for AOPP.
0 5 10
NPBI
15 20
Figure 2: Box and whisker plot for NPBI.
0 50 100 150
Isoprostanes
200 250
confidence limits to be computed nonparametrically for each reference limit.
To estimate the reference limits for these same
percen-tiles with 95% confidence, a minimum of 146 reference
values are needed; for 99% confidence, a minimum of
210 reference values are needed. Linnet [43] proposes that up to 700 should be obtained for highly skewed distribu-tions of results. However, as a standard for general prac-tice, the working group supports the recommended minimum of 120 reference subjects. When fewer observa-tions are available, the use of the nonparametric method becomes problematic. The robust method, however, offers a potential alternative.
As noted by Horn and Pesce [36], calculating the refer-ence interval using robust methods involves an iterative process, where the initial location (center) is estimated by the median and the initial stairs (spread) and by the median absolute deviation about the median (MAD). In the process, actual observations are down weighted according to their distance from the central tendency of the sample. The quantity that represents the updated estimate of central tendency is calculated for each iteration, until the change in successive iterative values is negligible.
The decision to choose 120 cases is due to a desire to follow, for our small population, the ICSH guidelines that regulate the preanalytical phase and the analysis phase of the treatment of samples. To recruit a greater number of cases, we would have to wait more time; this could have led to an increase in the error in the preanalytical and in the analytical phases.
When it is not possible to reach the suggested number of cases, Horn and Pesce [36] have proposed the robust method as an alternative to estimate reference RIs. How-ever, we discarded this possibility because the CI intervals are estimated with the bootstrap [44] by using this method. When the sample contains too many same values, it may be impossible to calculate the CI. For NPBI, zero concentration values were reported many times and the CI was not calculated.
In conclusion, our study for thefirst time in literature
provides reference value for the most reliable markers of OS in newborns. These intervals are necessary for all clinical laboratory tests, and they are an important task for produc-ing diagnostic tests for clinical pathology.
Conflicts of Interest
The authors testify that they have no actual or potential
conflicts of interest including any financial, personal, or other
relationships with other people or organizations within three years from the beginning of the submitted work that
could inappropriately influence, or be perceived to influence,
their work.
Acknowledgments
The authors thank EURAIBI (EURope Against Infant Brain Injury) Foundation for its partial grant.
References
[1] T. Yoshikawa and Y. Naito,“What is oxidative stress?” Japan Medical Association Journal, vol. 45, no. 7, pp. 271–276, 2002. [2] H. Sies,“Oxidative stress: oxidants and antioxidants,”
Experi-mental Physiology, vol. 82, no. 2, pp. 291–295, 1997. [3] S. Nikam, P. Nikam, S. Ahaley, and A. Sontakke,“Oxidative
stress in Parkinson’s disease,” Indian Journal of Clinical Bio-chemistry, vol. 24, no. 1, pp. 98–101, 2009.
[4] C. Zhou, Y. Huang, and S. Przedborski,“Oxidative stress in Parkinson’s disease: a mechanism of pathogenic and therapeu-tic significance,” Annals of the new York Academy of Sciences, vol. 1147, pp. 93–104, 2008.
[5] G. J. Handelman, “Evaluation of oxidant stress in dialysis patients,” Blood Purification, vol. 18, no. 4, pp. 343–349, 2000. [6] S. Perrone, M. L. Tataranno, S. Negro et al.,“Early identifi-cation of the risk for free radical-related diseases in preterm newborns,” Early Human Development, vol. 86, no. 4, pp. 241–244, 2010.
[7] S. Perrone, M. L. Tataranno, and G. Buonocore, “Oxidative stress and broncopulmonary dysplasia,” Journal of Clinical Neonatology, vol. 1, no. 3, pp. 109–114, 2012.
[8] S. Perrone, P. Vezzosi, M. Longini et al., “Biomarkers of oxidative stress in babies at high risk for retinopathy of prematurity,” Frontiers in Bioscience (Elite Edition), vol. 1, no. 2, pp. 547–552, 2009.
[9] S. Perrone, M. L. Tataranno, S. Negro et al.,“May oxidative stress biomarkers in cord blood predict the occurrence of necrotizing enterocolitis in preterm infants?” The Journal of Maternal-Fetal & Neonatal Medicine, vol. 25, Supplement 1, pp. 128–131, 2012.
[10] G. Buonocore, S. Perrone, M. Longini et al., “Non protein bound iron as early predictive marker of neonatal brain damage,” Brain, vol. 126, Part 5, pp. 1224–1230, 2003. [11] S. Perrone, M. L. Tataranno, G. Stazzoni, and G. Buonocore,
“Biomarkers of oxidative stress in fetal and neonatal diseases,” The Journal of Maternal-Fetal & Neonatal Medicine, vol. 25, no. 12, pp. 2575–2578, 2012.
[12] G. S. Berkowitz and E. Papiernik, “Epidemiology of pre-term birth,” Epidemiologic Reviews, vol. 15, no. 2, pp. 414– 443, 1993.
[13] O. P. Mishra and M. Delivoria-Papadopoulos, “Cellular mechanisms of hypoxic injury in the developing brain,” Brain Research Bulletin, vol. 48, no. 3, pp. 233–238, 1999.
[14] B. H. Yoon, R. Romero, J. K. Jun et al.,“Amniotic fluid cytokines (interleukin-6, tumor necrosis factor-alpha, interleukin-1 beta, and interleukin-8) and the risk for the development of bronchopulmonary dysplasia,” American Journal of Obstetrics and Gynecology, vol. 177, no. 4, pp. 825–830, 1997.
[15] W. W. Andrews, R. L. Goldenberg, O. Faye-Petersen, S. Cliver, A. R. Goepfert, and J. C. Hauth, “The Alabama preterm birth study: polymorphonuclear and mononuclear cell placental infiltrations, other markers of inflammation, and outcomes in 23- to 32-week preterm newborn infants,” American Journal of Obstetrics and Gynecology, vol. 195, no. 3, pp. 803–808, 2006.
[16] R. M. Blumberg, E. B. Cady, J. S. Wigglesworth, J. E. McKenzie, and A. D. Edwards,“Relation between delayed impairment of cerebral energy metabolism and infarction following transient focal hypoxia-ischaemia in the developing brain,” Experimen-tal Brain Research, vol. 113, no. 1, pp. 130–137, 1997.
[17] L. Ciccoli, V. Rossi, S. Leoncini et al.,“Iron release in erythro-cytes and plasma non protein-bound iron in hypoxic and non hypoxic newborns,” Free Radical Research, vol. 37, no. 1, pp. 51–58, 2003.
[18] S. Frosali, P. Di Simplicio, S. Perrone et al., “Glutathione recycling and antioxidant enzyme activities in erythrocytes of term and preterm newborns at birth,” Biology of the Neonate, vol. 85, no. 3, pp. 188–194, 2004.
[19] M. Vento, M. Asensi, J. Sastre, F. García-Sala, and J. Viña,“Six years of experience with the use of room air resuscitation of asphyxiated newly born term infants,” Biology of the Neonate, vol. 79, no. 3–4, pp. 261–267, 2001.
[20] G. Barreto, D. Madureira, F. Capani, L. Aon-Bertolino, E. Saraceno, and L. D. Alvarez-Giraldez,“The role of catechols and free radicals in benzene toxicity: an oxidative DNA damage pathway,” Environmental and Molecular Mutagenesis, vol. 50, no. 9, pp. 771–780, 2009.
[21] R. M. Adibhatla and J. F. Hatcher, “Phospholipase A(2), reactive oxygen species, and lipid peroxidation in CNS pathol-ogies,” BMB Reports, vol. 41, no. 8, pp. 560–567, 2008. [22] M. C. Gongora, H. E. Lob, U. Landmesser et al.,“Loss of
extra-cellular superoxide dismutase leads to acute lung damage in the presence of ambient air: a potential mechanism underlying adult respiratory distress syndrome,” The American Journal of Pathology, vol. 173, no. 4, pp. 915–926, 2008.
[23] D. Wang, S. Fasciano, and L. Li,“The interleukin-1 receptor associated kinase 1 contributes to the regulation of NFAT,” Molecular Immunology, vol. 45, no. 15, pp. 3902–3908, 2008. [24] P. Paffetti, S. Perrone, M. Longini et al., “Non-protein-bound
iron detection in small samples of biological fluids and tissues,” Biological Trace Element Research, vol. 112, no. 3, pp. 221–232, 2006.
[25] G. Buonocore, S. Perrone, M. Longini, L. Terzuoli, and R. Bracci,“Total hydroperoxide and advanced oxidation protein products in preterm hypoxic babies,” Pediatric Research, vol. 47, no. 2, pp. 221–224, 2000.
[26] G. Tonni, S. Leoncini, C. Signorini, L. Ciccoli, and C. De Felice, “Pathology of perinatal brain damage: background and oxida-tive stress markers,” Archives of Gynecology and Obstetrics, vol. 290, no. 1, pp. 13–20, 2014.
[27] K. S. Leung, J. M. Galano, T. Durand, and J. C. Lee,“Current development in non-enzymatic lipid peroxidation products, isoprostanoids and isofuranoids, in novel biological samples,” Free Radical Research, vol. 79, no. 7, pp. 816–826, 2015. [28] U. Jahn, J. M. Galano, and T. Durand,“Beyond
prostaglan-dins: chemistry and biology of cyclic oxygenated metabolites formed by free-radical pathways from polyunsaturated fatty acids,” Angewandte Chemie (International Ed. In English), vol. 47, no. 32, pp. 5894–5955, 2008.
[29] J. M. Galano, E. Mas, A. Barden et al.,“Isoprostanes and neu-roprostanes: total synthesis, biological activity and biomarkers of oxidative stress in humans,” Prostaglandins & Other Lipid Mediators, vol. 107, pp. 95–102, 2013.
[30] B. Casetta, M. Longini, F. Proietti, S. Perrone, and G. Buonocore, “Development of a fast and simple LC-MS/ MS method for measuring the F2-isoprostanes in newborns,” The Journal of Maternal-Fetal & Neonatal Medicine, vol. 25, Supplement 1, pp. 114–118, 2012.
[31] S. Basu,“F2-isoprostanes in human health and diseases: from molecular mechanisms to clinical implications,” Antioxidants & Redox Signaling, vol. 10, no. 8, pp. 1405–1434, 2008.
[32] G. Papanikolaou and K. Pantopoulos, “Iron metabolism and toxicity,” Toxicology and Applied Pharmacology, vol. 202, no. 2, pp. 199–211, 2005.
[33] G. Buonocore, S. Perrone, M. Longini et al.,“Oxidative stress in preterm neonates at birth and on the seventh day of life,” Pediatric Research, vol. 52, no. 1, pp. 46–49, 2002.
[34] CLSI/NCCLS, Procedures for the Handling and Processing of Blood Specimens; Approved Guideline—Third Edition. CLSI/ NCCLS Document H18-A3, NCCLS, Wayne, PA, 2004. [35] V. Witko-Sarsat, M. Friedlander, C. Capeillère-Blandin et al.,
“Advanced oxidation protein products as a novel marker of oxidative stress in uremia,” Kidney International, vol. 49, no. 5, pp. 1304–1313, 1996.
[36] P. S. Horn and A. J. Pesce, Reference Intervals. A User’s Guide, AACC Press, Washington, DC, 2005.
[37] CLSI, Defining, Establishing, and Verifying Reference Inter-vals in the Clinical Laboratory; Approved Guideline—Third Edition. CLSI Document EP28-A3c, Wayne, PA, Clinical and Laboratory Standards Institute, 2008.
[38] K. Schnabl, M. K. Chan, Y. Gong, and K. Adeli,“Closing the gaps in paediatric reference intervals: the CALIPER initiative,” Clinical Biochemist Reviews, vol. 29, no. 3, pp. 89–96, 2008. [39] Y. O. Ilcol and D. Aslan,“Use of total patient data for indirect
estimation of reference intervals for 40 clinical chemical ana-lytes in Turkey,” Clinical Chemistry and Laboratory Medicine, vol. 44, no. 7, pp. 867–876, 2006.
[40] F. Tang, S. Messinger, and C. Cray,“Use of an indirect sam-pling method to produce reference intervals for hematologic and biochemical analyses in Psittaciform species,” Journal of Avian Medicine and Surgery, vol. 27, no. 3, pp. 194–203, 2013. [41] P. S. Horn, L. Feng, Y. Li, and A. J. Pesce,“Effect of outliers and nonhealthy individuals on reference interval estimation,” Clinical Chemistry, vol. 47, no. 12, pp. 2137–2145, 2001. [42] A. H. Reed, R. J. Henry, and W. B. Mason, “Influence of
statistical method used on the resulting estimate of normal range,” Clinical Chemistry, vol. 17, no. 4, pp. 275–284, 1971. [43] K. Linnet,“Two-stage transformation systems for
normaliza-tion of reference distribunormaliza-tions evaluated,” Clinical Chemistry, vol. 33, no. 3, pp. 381–386, 1987.
[44] B. Efron, The Jackknife, the Bootstrap and Other Resam-pling Plans, Society for Industrial and Applied Mathematics, Philadelphia, PA, 1982.
Submit your manuscripts at
https://www.hindawi.com
Stem Cells
International
Hindawi Publishing Corporationhttp://www.hindawi.com Volume 2014
Hindawi Publishing Corporation
http://www.hindawi.com Volume 2014 INFLAMMATION
Hindawi Publishing Corporation
http://www.hindawi.com Volume 2014
Behavioural
Neurology
Endocrinology
International Journal ofHindawi Publishing Corporation
http://www.hindawi.com Volume 2014
Hindawi Publishing Corporation
http://www.hindawi.com Volume 2014
Disease Markers
Hindawi Publishing Corporation
http://www.hindawi.com Volume 2014
BioMed
Research International
Oncology
Journal ofHindawi Publishing Corporation
http://www.hindawi.com Volume 2014
Hindawi Publishing Corporation
http://www.hindawi.com Volume 2014 Oxidative Medicine and Cellular Longevity Hindawi Publishing Corporation
http://www.hindawi.com Volume 2014
PPAR Research
The Scientific
World Journal
Hindawi Publishing Corporationhttp://www.hindawi.com Volume 2014
Immunology Research
Hindawi Publishing Corporation
http://www.hindawi.com Volume 2014
Journal of
Obesity
Journal ofHindawi Publishing Corporation
http://www.hindawi.com Volume 2014
Hindawi Publishing Corporation
http://www.hindawi.com Volume 2014 Computational and Mathematical Methods in Medicine
Ophthalmology
Journal ofHindawi Publishing Corporation
http://www.hindawi.com Volume 2014
Diabetes Research
Journal of Hindawi Publishing Corporationhttp://www.hindawi.com Volume 2014
Hindawi Publishing Corporation
http://www.hindawi.com Volume 2014
Research and Treatment
AIDS
Hindawi Publishing Corporation
http://www.hindawi.com Volume 2014 Gastroenterology Research and Practice
Hindawi Publishing Corporation
http://www.hindawi.com Volume 2014