Abstract
In the developed countries, the environment is mainly used as agricultural land. Nowadays, the increasing use of precision farming practices led to review the information on the agro-environmental production parameters along all the agricultural chain. In this Ph.D. research three parameters have been monitored: soil water content, crop nutritional status and fruit quality. The aim was to evaluate potential applications of rapid and non-destructive optoelectronic techniques to reduce environmental impact in in-field soil preparation, pre- and post-harvest phases. Regarding the in-field soil preparation the scope was to investigate the suitability of active infrared thermography and thermometry, combined with multivariate statistical analysis, for a rapid laboratory and in-field detection of soil water content. Concerning the pre-harvest two case studies were conducted. The first proposed the use of visible-near infrared portable spectrophotometer to evaluate citrus crop nutritional status through foliar analysis. The second evaluated the possibility and the accuracy of the same system, in comparison with conventional analyses, in estimating tomato leaf nitrogen concentration. In the post-harvest case study was developed a non-destructive estimation of citrus fruit internal quality parameters using the mentioned portable spectrophotometer. This Ph.D. activity could provide the basis for future applications such as monitoring and stabilising crop nutritional levels, assessing rapidly soil water content and fruit internal quality and reducing environmental impact. These case studies were finally published in international peer-reviewed journals with impact factors.
Riassunto
Nei paesi sviluppati, l’ambiente è principalmente utilizzato come terreno agricolo. Ad oggi, l’aumento delle pratiche di agricoltura di precisione ha portato a riesaminare le informazioni riguardanti i parametri di produzione agro-ambientale in tutte le fasi della catena agricola. In questo dottorato di ricerca, tre di questi parametri sono stati monitorati: il contenuto d’acqua del suolo, lo stato nutrizionale delle colture e la qualità dei frutti. L’obiettivo era quello di valutare le potenziali applicazioni delle rapide e non distruttive tecniche optoelettroniche per ridurre l’impatto ambientale nelle fasi di preparazione del terreno direttamente in campo ed in quelle di pre- e post-raccolta. Riguardo alla fase di preparazione del suolo, lo scopo era quello di valutare l’idoneità della termografia e della termometria attiva ad infrarossi, combinata con l’analisi statistica multivariata, per una rapida individuazione del contenuto idrico del suolo sia in laboratorio che in campo. Nella fase di pre-raccolta due casi di studio sono stati condotti. Il primo ha proposto l’utilizzo di uno spettrofotometro portatile del visibile e vicino infrarosso per valutare lo stato nutrizionale di colture di agrumi attraverso l’analisi fogliare. Il secondo ha valutato la possibilità e l’accuratezza dello stesso sistema, a paragone con le tecniche convenzionali, nello stimare la concentrazione fogliare di azoto in piante di pomodoro. Nel caso di studio della fase di post-raccolta è stato sviluppato un sistema non distruttivo per stimare dei parametri di qualità interna di agrumi usando il già menzionato spettrofotometro portatile. Questa attività di Ph.D. potrebbe fornire le basi per future applicazioni come il monitoraggio e la stabilizzazione dei livelli nutrizionali delle colture, la rapida valutazione del contenuto d’acqua del suolo e della qualità interna dei frutti e la riduzione dell’impatto ambientale. In fine, questi casi di studio sono stati pubblicati su riviste internazionali peer-reviewed con impact factor.
Acknowledgments
Ringrazio il Prof. Maurizio Petruccioli ed il Dr. Alessandro D’Annibale per avermi supportata in questo triennio di attività.
Ringrazio veramente con il cuore Paolo Menesatti per avermi dato fiducia e per avermi consigliata ed aiutata in tutti questi anni.
Grazie a Corrado che continua ad essere al mio fianco in questi momenti così importanti. Grazie a Federico, amico e collega sincero: grazie per tutto l’aiuto che mi hai dato. Voglio ringraziare anche tutto il CRA-ING e annessi, in particolare: Sara (Sari), Simone (Figo), Alessandro (Suard), Maurizio, Piero, Andrea, Marcello, Vilma, Stefano, Sandu, Marco (Scala), Simone (Bergo), Emiliano (Miano), Silvia Rita, Jacopo, Lola e Paolo ed infine grazie a tutti quelli che almeno una volta mi hanno supportata/sopportata in questi anni.
Grazie alla mia famiglia: mamma, papà, Fede, Otty, nonna Anna, nonno Giovanni, zii e cugini. Grazie ai due miei magnifici nonni Milena e Rinaldo.
Grazie a Ciccio che è sempre presente e continua ad aiutarmi in tutto e per tutto rendendo semplice tutto quello che riesco a complicare. Grazie a Anna, Armando, Gracco, Napulina e grazie al Nanetto e alla Fagiolina che arriverà.
Grazie ai biologi e annessi: Valentina, Fabrizio, Alice e Riccardo.
Infine voglio ringraziare i miei amici più cari: Elisa, Luca, Iole, Michele, Ico, Barbara, Velio, Ylenia, Cugio, Marcello, Gnappi.
Table of contents
Abstract...1
Riassunto...2
Acknowledgments...3
Table of contents...5
1. Aim and Objectives...7
2. Introduction...10
2.1 Agro-environmental sustainability...10
2.2 Precision Agriculture...13
2.2.1 Precision farming...14
2.2.2 Precision production...16
2.3 Agro-environmental production parameters...17
2.3.1 Map-based managing of agro-environmental production parameters...18
2.3.2 Sensor-based managing of agro-environmental production parameters...19
3. Optoelectronic applications...21
3.1 Signal acquisition...21
3.1.1 Nature of light...22
3.1.2 Biophotonics in the agro-environment...23
3.2 Signal analysis...29
3.2.1 Multivariate statistical analysis...29
4. In-field soil preparation...31
4.1 Soil water content estimation...33
4.1.1 Why monitor soil water content?...34
4.2 Case study...35
4.2.1 Antonucci F, Pallottino F, Costa C, Rimatori V, Giorgi S, Papetti P & Menesatti P (2011) Development of a rapid soil water content detection for in-field applications by active infrared thermal methods. Sensors, 11, 10114-10128. (IF2010=1,771)...36
5. Pre-harvest...54
5.1 Crop nutritional status estimation...55
5.1.1 Why monitor crop nutritional status?...57
5.2 Case studies...58
5.2.1 Menesatti P, Antonucci F, Pallottino F, Roccuzzo G, Allegra M, Stagno F & Intrigliolo F (2010) Estimation of plant nutritional status by VIS-NIR spectrophotometric analysis on orange leaves [Citrus sinensis (L) Osbeck cv Tarocco]. Biosystem Engineering, 105, 448-454. (IF2010=1,241)...59
5.2.2 Ulissi V, Antonucci F, Benincasa P, Farneselli M, Tosti G, Guiducci M, Tei F, Costa C, Pallottino F & Menesatti P (2011) Nitrogen content estimation on tomato leaves by VIS-NIR non destructive spectral reflectance system. Sensors, 11(6), 6411-6424. (IF2010=1,771)73 6. Post-harvest...90
6.1 Fruit quality evaluation...91
6.1.1 Why evaluate fruit quality?...94
6.2 Case study...95
6.2.1 Antonucci F, Pallottino F, Paglia G, Palma A, D’Aquino S & Menesatti P (2011) Non-destructive estimation of mandarin maturity status through portable VIS-NIR spectrophotometer. Food and Bioprocess Technology, 4(5), 809-813. (IF2010=3,576)...96
7. Overall conclusions and recommendations... 106
8. List of publications... 108
8.1 International peer-reviewed scientific publications with Impact Factor (IF)... 108
8.2 Peer-reviewed scientific publications... 110
8.3 Others scientific publications... 110
8.4 Congress oral communications and Posters... 111
8.6 Patents... 114 9. References... 115
1. Aim and Objectives
In the developed countries, the environment is mainly used as agricultural land. Agriculture shapes half of European landscapes by providing large seasonal, functional and structural variations impacting on key components of the biosphere (soil-water-vegetation-air). Moreover, it plays an essential role in maintaining the environment in a healthy state even if the links between the natural environment and farming practices are complex. In fact, agriculture and environment exercise a profound influence over each other. On the one hand, farming has contributed over the centuries to creating and maintaining a variety of valuable semi-natural habitats which now host a relevant part of European biodiversity and often represent an important cultural heritage. On the other hand, agricultural practices can also exert an adverse impact on natural resources. Pollution of soil, water and air, fragmentation of habitats and loss of wildlife can represent the result of inappropriate agricultural practices and land use (http://agrienv.jrc.ec.europa.eu/index.htm).
Generally, the term “sustainable”, or “eco-compatible”, agriculture refers to a system capable of maintaining its productivity and usefulness to society over the long run. As reported by van der Werf and Petit (2002), farmers adjust their production practices (e.g., tillage operations, sowing, and fertilisation) in order to optimally combine inputs based on natural capital (soil, solar energy, rain, fossil energy) and inputs from human-made capital (fertilisers, seeds, pesticides) yielding desired outputs (products) and undesired emissions to the environment. As a consequence, in these last years, the demand of new equipments, and/or devices, able to realize innovative analytical and quality control strategies, strongly increased. Thanks to these innovations it is possible to fulfil specific targets related to a more strict monitoring of production and products in order to realize a precise standardization, both in qualitative terms and marketable goods characteristics, reducing, at the same time, the environmental impact (Bonifazi et al., 2004). Systems and devices such as for example Geographical Positioning System (GPS) and sensors, are of a foremost importance for an efficient data collection required in agricultural practices and in others activities such as precision agriculture that represents a kind of agriculture increasing the number of correct decisions per unit area of land per unit time with associated net benefits (McBratney et al., 2005). For example, the precision agriculture allows producers to perform a tailored use of fertilizers in lieu of an arbitrary application at uniform rates over large areas. For these reasons, the concepts of precision agriculture and sustainability are inextricably linked (Bongiovanni & Lowenberg-Deboer, 2004). The concept of precision agriculture refers to precision farming and to precision production that are strictly correlated. The goal of precision farming is to improve the profits of farmers and harvest yields with a concomitant reduction of negative impacts on the
environment mainly due to a misuse of agrochemicals. All these practices determine the level of the agricultural production (precision production).
In these terms there is an increasing need to review information on the agro-environmental production parameters along all the agricultural chain “from the cradle to the grave” represented for example by: yield distributions, soil fertility (N, P, K, Ca, Mg, C, Fe, Mn, Zn, and Cu content), soil density, soil mechanical strength, soil water content, crop density, crop height, crop nutritional status (N, P, K, Ca, Mg, C, Fe, Mn, Zn, and Cu), crop water stress, weed infestation, insect infestation, tillage practice, crop rotation, fertilizer application, irrigation pattern, fruit quality, etc.
In this Ph.D. research three of these agro-environmental production parameters have been monitored:
1. soil water content; 2. crop nutritional status; 3. fruit quality.
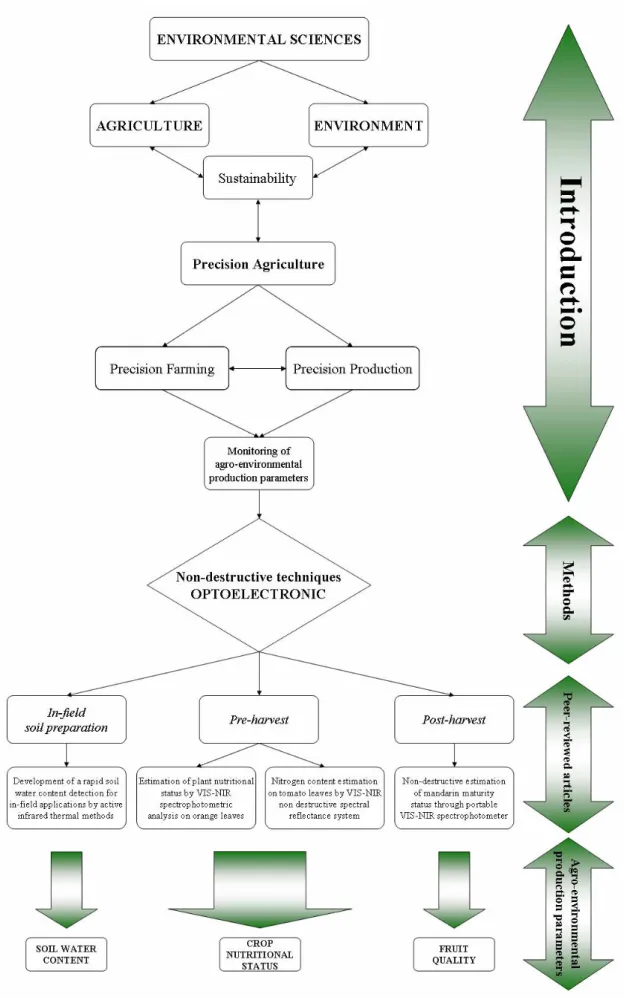
The general aim of this Ph.D. activity was to evaluate potential applications of non-invasive, rapid and non-destructive optoelectronic techniques to reduce environmental impact in the in-field soil preparation, pre- and post-harvest phases (Fig. 1.1).
Regarding the in-field soil preparation a rapid soil water content detection by active infrared thermal methods was developed. The aim was to investigate the suitability of active infrared thermography and thermometry, combined with multivariate statistical analysis, for a rapid laboratory and in-field detection of soil water content. These techniques allowed fast soil water content measurements helpful in both agricultural and environmental fields (Fig. 1.1).
Concerning the pre-harvest phase, two case studies were conducted. The first proposed the use of visible-near infrared portable spectrophotometer to evaluate citrus crop nutritional status represented by various macroelements (i.e., N, P, K, Ca, Mg, Fe, Zn and Mn) through foliar analysis. The second evaluated the possibility and the accuracy of the same system, in comparison with conventional analyses (i.e., chemical standard analyses, chlorophyll meter readings and N-NO3 concentration in petiole sap), in estimating tomato leaf nitrogen concentration (Fig. 1.1).
For the post-harvest phase one case study was developed in order to assess possibility and limits of a non-destructive estimation of citrus fruit internal quality parameters (i.e., total soluble solids and titratable acidity) presenting thick peel by using the mentioned portable
2. Introduction
2.1 Agro-environmental sustainability
Over the past two decades, increasing awareness of the ecosystems fragility and increasing concern for the state of the environment has focused attention on the effect of agricultural activities on crop, soil and water quality. In many countries, research studies and extension programs have been instituted by governments and universities to encourage farmers to adopt conservation practices such as forage rotations and cover crops, reduced tillage, maintenance of crop residues and reduced fallowing. As a result, considerable adjustment of land use and production activities has occurred.
Recently, as reported by Huffman et al. (2000), as the concept of sustainable production becomes more accepted, decision-makers are striving to develop environmentally friendly policies and programs. The need for quantitative information on the extent, degree and regional variability of the environmental impact of agricultural production practices, and on the adoption of conservation practices, has become immediate.
The implications of this in terms of data, especially in the complex, interrelated and broad spatial context of ecosystems is massive (Huffman et al., 2000). In the absence of complete information about these relationships, the concept of rapid in-field applications serving as proxies for a wider variety of parameters has been proposed.
Agriculture today must balance a wide array of demands and environmental challenges that are continually evolving in their nature and complexity. A major challenge is achieving long term environmental sustainability of production (McRae, 2000). As reported by Pacini et al. (2003) agricultural researchers widely recognise the importance of sustainable agricultural production. The word sustainable is derived from the Latin sustinere meaning to keep in existence, implying permanence or long-term support. In the context of agricultural production, Ikerd (1993) defines a sustainable agriculture as capable of maintaining its productivity and usefulness to society over the long run. Moreover, it must be environmentally-sound, resource-conserving, economically viable and socially supportive, commercially competitive, and environmentally sound. The complex nature of the interrelationships between agricultural production and the natural environment means that we far from know which methods and systems in different locations will lead to sustainability (Youngberg & Harwood, 1989). As reported by Rigby & Cáceres (2001) this seems to be a crucial issue in the debate, and leads one to ask how long should an agro-system behave sustainably to be considered sustainable, and how
energy) and inputs from human-made capital (fertilisers, seeds, pesticides) yielding desired outputs (products) and undesired emissions to the environment (van der Werf & Petit, 2002).
Crop nutrients and pesticides are added to agroecosystems to improve crop production. When not used wisely, these amendments can reduce the quality of soil, water, and air and can affect biodiversity (McRae, 2000). Generally, fertilizer application methods that reduce nutrient losses were quite prevalent, although room for improvement exists. Applying nitrogen in excess of crop needs reflects inefficient nutrient management, incurs unnecessary costs, and poses a threat to water quality. Movement of nitrogen into the atmosphere as ammonia and nitrous oxide contributes to poor air quality and potentially to global warming. As agriculture continues to move to larger and more intensive operations, sound input management practices will be critical for both environmental protection and farm profitability. In most cases, improving input management goes hand in hand with enhancing farm profitability (McRae, 2000).
The intensification of production methods caused increasing environmental pollution and consequently, the limitation of the environmental impacts to acceptable level became increasingly important in agricultural research (van der Werf & Petit, 2002). This generated a large amount of research concerning the impacts of agriculture on the environment (e.g. Wauchope, 1978; Ryden et al., 1984). As reported by Yang et al. (2003) modern conventional agriculture is heavily dependent on chemical inputs to promote high crop yields. Moreover, conventional agriculture tends to ignore spatial variability within fields. Agrochemicals have been applied uniformly over production areas, resulting in excesses in some locations and insufficient intervention at others. The over-application of these agrochemicals has become one of the main sources of pollution (Mannion, 1995; Paice et al., 1996). The extra agrochemicals remain in the soil, leach into the ground water and/or drain into surface water bodies (Smith et al., 1995; Paice et al., 1996). Pollution and contamination from agrochemicals in soil, ground water and runoff can cause various illnesses, including disorders of the nervous system (Peralta et al., 1994; Mannion, 1995). Pesticides also reduce the population of some natural predators of harmful pests, thus occasionally resulting in an increase rather than a decrease in the population of the target pest, and causing increased losses (Mannion, 1995). Consequently, improved management practices that reduce the over-application of agrochemicals have become an important focus of research. One approach to reducing chemical inputs is precision farming also called site-specific farming. This allows farmers to manage what happens in the field at a very fine spatial resolution and can thus increase the efficiency of the farming enterprise (Ascheman, 1993; Blackmore, 1994; Paice et al., 1996). It enables the application of agrochemical inputs and the adoption of other farming practices that match the inherent variability in a field (Paice et al., 1996). Although many of the technologies used in precision farming require further research and
development, it has already yielded considerable benefits by lowering costs, increasing production and improving the environmental condition (Yang et al., 2003).
Work on impact assessment raises the issue of which are the key aspects of a system’s performance that should be measured, that is, what are the key aspects of agricultural sustainability (Rigby & Cáceres, 2001). The level of production of agro-ecosystems mainly depends on natural and human-made capital inputs. Herdt & Steiner (1995) indicate that it is hard to know whether current agro-ecosystems are sustainable in the sense of remaining productive in the long run.
Environmental impact of agriculture depends to a large extent on farmer production practices. The link however is indirect, as emissions to the environment depend on the state of the farming system, which in turn depends on farmer production practices but also on random factors such as rainfall and temperature (van der Werf & Petit, 2002). Modern conventional agriculture is heavily dependent on chemical inputs to promote high crop yields. Conventional agriculture has tended to ignore spatial variability within fields. Agrochemicals have been applied uniformly over production areas, resulting in excesses in some locations and insufficient intervention at others (Yang et al., 2003).
In order to effectively evaluate environmental impact, rapid, destructive and non-invasive evaluation methods should take into account a range of objectives covering both local and global effects. The number of objectives should be sufficiently large to avoid the inadvertent creation of new problems, and as small as possible to maintain feasibility, they should not be redundant. The procedure used for the selection of objectives should be stated. Numerous attempts to develop on-the-go sensor techniques to analyse agro-environmental properties and to increase the efficiency of precision farming (Pierce & Nowak, 1999) have been developed in the last years. Moreover, to an appropriate management of agricultural practices, methods increasing the density of soil characterisation at a relatively low cost are required (Sonka et al. 1997).
Engineering knowledge and expertise make important contributions to all portions of the system. Systems and devices such as for example Geographical Positioning System (GPS), sensors and sample collection equipment, are essential for the efficient collection data required in agricultural practices and in others activities such as precision farming (Sudduth, 1999). These developments have led to a variety of methods for the evaluation of the environmental impacts of agriculture. The development of such tools is considered by many authors as a condition for the implementation of a sustainable agriculture (e.g. Hansen, 1996). These methods take into
2.2 Precision Agriculture
Precision agriculture has generated a very high profile in the agricultural industry over the last decade of the second millennium. With the advent of the satellite-based GPS, farmers gained the potential to take account of spatial variability. The topic has been technology-driven and so many of the engineering developments are in place, with understanding of the biological processes on a localized scale lagging behind. Precision agriculture, as a crop management concept, can meet much of the increasing environmental, economic, market and public pressures on arable agriculture (Stafford, 2000) and it represents a kind of agriculture that increases the number of (correct) decisions per unit area of land per unit time with associated net benefits (McBratney et al., 2005). It should be considered as a philosophical shift in the management of variability within agricultural industries. It must be aimed at improving profitability and or environmental impact both short and long term (Whelan & McBratney, 2000).
Some of the competitive advantage of precision agriculture will come from the in-field separation of product into quality classes. Economic benefits will come especially if there are non-linearities in the payment of quality premiums. Quality criteria are particularly important for the high-value crops. A secondary benefit of this approach is the mapping of quality characteristics to improve agronomic management for optimising the quantity/quality. A lot of work is needed on developing quality criteria and sensor systems in a product-chain approach which will make it feasible to interact effectively with customers (McBratney et al., 2005). This scenario calls for the introduction of modern technologies to improve crop yield, provide information to enable better in-field management decisions, reduce chemical and fertilizer costs through more efficient application, permit more accurate farm records, increase profit margin and reduce pollution (Sparovek & Schnug, 2001).
Generally, precision agriculture requires a method of gathering information about the spatial variability of soil that reduces the need for expensive and intensive sampling (McBratney & Pringle, 1999). It potentially provides producers improved tools to manage those inputs that must be brought to the farm. Instead of indiscriminately applying fertilizer or pesticides at uniform rates over large areas, it allows producers to better target applications. The hope of PA is that its use will be less disruptive of natural systems than uniform application of physical inputs has been (Bongiovanni & Lowenberg-Deboer, 2004).
The concepts of precision agriculture and sustainability are inextricably linked as reported by Bongiovanni & Lowenberg-Deboer (2004). From the first time a global positioning system was used on agricultural equipment the potential for environmental benefits has been discussed. Intuitively, applying fertilizers and pesticides only where and when they are needed, should reduce environmental loading.
In this context it is possible to distinguish the precision agriculture into two main points: farming and production.
2.2.1 Precision farming
Precision farming is a farming management concept based on observing and responding to intra-field variations. The concept of precision agriculture first emerged in the United States in the early 1980s. Towards the end of the 1980s, this technique was used to derive the first input recommendation maps for fertilizers and pH corrections (http://en.wikipedia.org/wiki/Precision_agriculture). The goal of precision farming is to improve farmers’ profits and harvest yields while reducing the negative impacts of farming on the environment that come from over-application of chemicals.
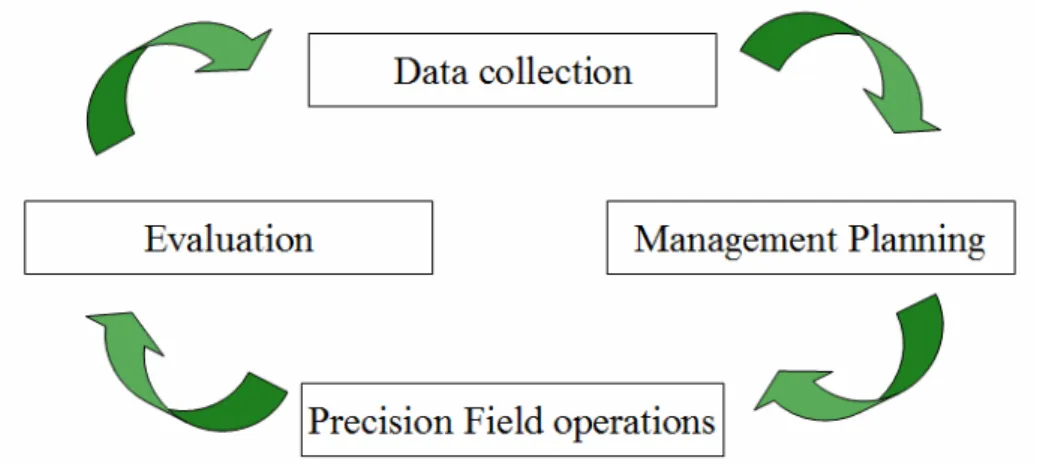
As reported by Sudduth (1999) the precision farming approach to crop production may be viewed as a four-step process (Fig. 2.2.1.1).
Figure 2.2.1.1: The cyclic scenery of the precision farming approach (adapted from Sudduth, 1999).
An initial step in this process is spatial measurement of those factors that limit or otherwise affect crop production. These variability data are then used to develop a management plan for the variable application of inputs such as fertilizers and herbicides. Inputs are applied in precision field operations. Finally, the effectiveness of the precision farming system is evaluated with respect to economics and environmental impacts. This evaluation becomes a part of the data collection process for the next cropping season. Multiple iterations through the cycle allow for refinement of the precision management plan in succeeding seasons.
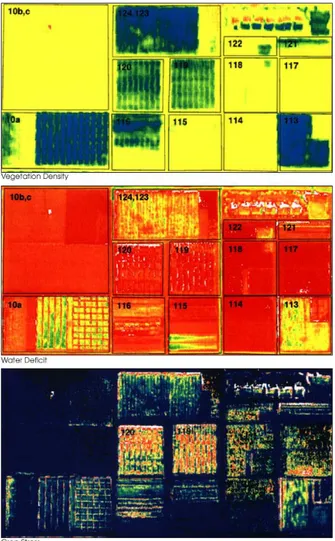
measurements. Greens and blues indicate wet soil and reds are dry soil. The bottom image shows where crops are under serious stress, as is particularly the case in Fields 120 and 119 (indicated by red and yellow pixels). These fields were due to be irrigated the following day. (http://earthobservatory.nasa.gov/IOTD/view.php?id=1139).
Figure 2.2.1.2: Three false-colour images to demonstrate some of the applications of remote sensing in precision
farming: the top image shows the colour variations determined by crop density; the middle image is a map of water deficit, derived from reflectance and temperature measurements and the bottom image shows where crops are under
serious stress (from http://earthobservatory.nasa.gov/IOTD/view.php?id=1139).
As reported by Batte & Arnholt (2003) the precision farming has the potential to help farmers improve input allocation decisions, thereby lowering production costs or increasing outputs, and, potentially, increasing profits. However, with the enlargement of fields and intensive mechanization, it has become increasingly more difficult to take account of within-field variability without a revolutionary development in technologies (Stafford, 2000). In this context precision farming is conceptualized by a system approach to re-organize the total system of agriculture towards a low-input, high-efficiency and sustainable agriculture (Shibusawa, 1998). Zhang et al. (2002) indicates that this new approach mainly benefits from the emergence and
convergence of several technologies such as: GPS, geographic information system (GIS), miniaturized computer components, automatic control, in-field and remote sensing, mobile computing, advanced information processing, and telecommunications. Agricultural industry is now capable of gathering more comprehensive data on production variability in both space and time. The desire to respond to such variability on a fine-scale has become the goal of precision farming (Whelan et al., 1997).
At the close of the 20th century, precision farming has evolved into a current research topic all over the world. Today, most agricultural disciplines participate in this effort, encouraging progress in agricultural technology, which originally supplied the impetus through the integration of information technology into tractors, machines and implements. Moreover, the term is almost always associated with the site-specific fertilisation and generally, farmers using this new technology to decrease in fertiliser required for the same yield and or higher yields with the use of the same amounts of fertiliser. Precision farming today aims at heterogeneities within a crop, attempting to take into account the requirements and environment. Thus, this agricultural system is geared toward large-scale farming, increasing its existing production advantages (Auernhammer, 2001).
2.2.2 Precision production
The precision production is measured as the ratio of agricultural outputs to agricultural inputs. These output values may be compared to many different types of inputs such as labour and land (yield). Although the use of some inputs like fertilizer and machinery increased, these increases were more than offset by reductions in cropland and especially the amount of labor employed in agriculture (Fuglie et al., 2007).
Agricultural practices determine the level of food production and, to a great extent, the state of the global environment (Tilman et al., 2002). Agriculturalists are the chief managers of terrestrial useable lands of which about half of these is already in pastoral or intensive agriculture (Tilman et al., 2001). Adapting production inputs site-specifically within a field and individually for each animal allows better use of resources to maintain the quality of the environment while improving the sustainability of the food supply (Gebbers & Adamchuk, 2010).
In these terms, the precision production could provide a tool to supervise food production chain managing both the quantity and quality of agricultural produce. In the past, it was difficult for farmers to correlate production techniques and crop yields with land variability. This limited
thus reducing expenses, producing a higher yield, and creating a more environmentally friendly farm (http://www.gps.gov/applications/agriculture/).
In these last years, the demand of new equipments to realize innovative quality control strategies and to review information on the agro-environmental production parameters strongly increased.
2.3 Agro-environmental production parameters
As reported by Zhang et al. (2002) the variability influencing agricultural production can be categorized into six groups and for each group some of agro-environmental production parameters can be considered:
1. yield variability: historical and present yield distributions;
2. field variability: field topography elevation, slope, aspect, and terrace, proximity to field boundary and streams, etc.;
3. soil variability: soil fertility representing by N, P, K, Ca, Mg, C, Fe, Mn, Zn, and Cu content; soil fertility as provided by manure; soil physical properties-texture, density, mechanical strength, moisture content, and electric conductivity; soil chemical properties/pH, organic matter and salinity; soil plant-available water-holding capacity and hydraulic conductivity; and soil depth;
4. crop variability: crop density; crop height; crop nutrient stress for N, P, K, Ca, Mg, C, Fe, Mn, Zn, and Cu; crop water stress; crop biophysical properties/leaf-area index (LAI), intercepted photosynthetically active radiation, and biomass; crop leaf chlorophyll content; and crop grain quality;
5. variability in anomalous factors: weed infestation; insect infestation; nematode infestation; disease infestation; wind damage, and hay damage;
6. management variability: tillage practice; crop hybrid; crop seeding rate; crop rotation; fertilizer application; pesticide application; and irrigation pattern.
Generally among these variability types, yield variability is often considered the ultimate dependent variable, whereas most other variability types are treated as independent variables. The most extensively studied independent variable to date has been soil nitrogen fertility level. In fact, most variable-rate technologies for chemical applications have been developed on nitrogen-fertilizer applicators (Zhang et al., 2002).
Many types of variability are both spatial and temporal in nature. Weed infestation serves as an example. Spatial weed-patch patterns may change during the crop-growing season. Variability in climate parameters is mostly temporal in nature. However, intensive precipitation
monitoring across fields is also important to assisting decision making for fertilizer applications (O’Neal et al., 2000).
Zhang et al. (2002) reported as two kind of approaches can be achieved to manage the variability: the map-based approach and the sensor-based approach. Moreover, control decisions for variable rate application can be implemented either on-line or off-line. In the on-line or sensor-based approach, the controlled equipment incorporates onboard sensors and the sensor data are used immediately for automatic control. In the off-line or map-based approach, data are collected and stored in one operation, and the controlled equipment uses the information in a separate field operation. The map-based approach allows more flexibility in data manipulation and pre-processing but requires that the location of equipment in the field be precisely defined, as with GPS. Most systems currently available are map-based, but more on-line systems will likely become available as real-time sensing technologies become more mature. Hybrid systems which rely on a combination of both mapped and real-time data may also come into more widespread use (Sudduth, 1999).
2.3.1 Map-based managing of agro-environmental production parameters
The map-based approach requires the following procedure: grid sampling a field, performing laboratory analyzes of soil samples, generating a site-specific map, and, finally, using this map to control a variable-rate applicator. A positioning system, such as a GPS, is usually required for this approach. Site-specific applications of agricultural inputs can be implemented by dividing a field into smaller management zones that are more homogeneous in properties of interest than the field as a whole. A management zone is defined by Doerge (1998) as a portion of a field that expresses a homogeneous combination of yield-limiting factors for which a single rate of a specific crop input is appropriate. A management zone also can be delineated by more than one specific crop inputs. In this case, a single rate is applied for each of the specific inputs within a zone. The number of distinct management zones within a field is a function of the natural variability within the field, the size of the field, and certain management factors. The minimum size of a zone is limited by the ability of the farmer to differentially manage regions within a field (Zhang et al., 2002). If a GPS is involved to control the application or to guide the implement, there seems no reason for restrictions on the shape of the zone. However, in reality, the pattern in which the application equipment traverses the field should be considered when delineating the management zones (Kvien & Pocknee, 2000).
2.3.2 Sensor-based managing of agro-environmental production parameters
The sensor-based approach, on the other hand, measures the desired properties, such as soil and plant properties, using real-time sensors in an “on-the-go” fashion and controls variable-rate applicator based on the measurements. For this approach, a positioning device is not always needed. Sudduth (1999) reports that it is especially important to develop and implement sensor technology for those parameters, such as soil nitrate and soil moisture, which can change rapidly (both spatially and temporally) and must be measured in real-time or near real-time to be useful for input control. Sensors will allow the collection of data on a much finer spatial resolution than is currently feasible with manual and/or laboratory methods, to more accurately characterize within-field variability.
As reported by Auernhammer (2001) historical data are not enough if high yields are based on nitrogen fertilisation, livestock breeding ensures adequate nutrient supply with P and K, and the weather is subject to great changes. For such conditions, the sensor approach monitors actual growth conditions over time. To do this, plant chlorophyll reflectance is a very useful measurement because it correlates closely with nitrogen content of the plant and with resulting plant mass. At the same time, reflectance in the near infrared area is distinguishable easily from surrounding plant matter and soil. In combination with type-specific growth functions for individual plants, growth deficits may be detected and remedied by real-time application of nitrogen-fertilisers.
With respect to fertilisation, the problems lie in plant-specific application of nitrogen taking into account the soil water available to the plant. Several improvements are needed.
Some examples of sensor-based managing are represented by the optoelectronic techniques as the near infrared (NIR) soil sensor measuring soil spectral reflectance to predict soil organic matter and moisture contents of surface and subsurface soils (Hummel et al., 2001). The on-line, real-time soil spectrophotometer measures soil spectral reflectance in the visible and NIR wavebands at a ground speed of 3.6 km/h. Field tests demonstrated linear relationships between reflectance at certain wavelengths and various soil properties, including soil organic matter and moisture content (Shibusawa et al., 2000). Another example is reported by Thai et al. (1999): in their study a field spectral-imaging system with a liquid crystal tunable filter in peanut and cotton fields was used. In the work of Stafford & Bolam, (1998) a near-ground scanning radiometer was mounted on a tractor to map vegetative-indices. Sudduth et al. (2000) designed an electromechanical sensor to count corn plants. Cotton plant height was measured using mechanical fingers and infrared light beams (Searcy & Beck, 2000). An infrared thermometer was used to measure canopy temperature to control irrigation events (Evans et al., 2000). A microwave sensor, and a NIR sensor were tested to measure moisture content of forage
(Marcotte et al., 1999). An on-line, real-time spectrophotometer developed by Anom et al. (2000) was used to map plant water, nutrient, disease, and salinity stresses. Michels et al. (2000) designed an infrared plant-temperature transducer to sense plant temperature changes caused by water stress. Ahmad et al. (1999) used a chlorophyll meter coupled with a DGPS to map nitrogen stress in corn. A multispectral radiometer was employed to detect crop salinity stress.
However, there is a particular interest to complete and improve in terms of time and data collection amount these methodologies using faster and non-destructive techniques. Optoelectronic tends to provide less accurate measurements than conventional laboratory analysis, facilitating the collection of larger amounts of data using cheaper and less time-consuming methods and reducing any accuracy deficit.
3. Optoelectronic applications
3.1 Signal acquisition
Optoelectronic is the study and the application of electronic devices that source, detect and control light.
Optoelectronic devices impact many areas of society, from simple household appliances and multimedia systems to communications, computing, spatial scanning, optical monitoring, 3D measurements and medical instruments (Sergiyenko, 2011). It is a complex multidisciplinary system that brings together different aspects of image analysis, machine vision, electronics and computer science for the acquisition and management of images (Jain et al., 2005; Steger et al., 2007). It represents one of the most evolutionary and sophisticated methodology between the electronic applications.
The application of these innovative optical technologies in medicine, biology, agriculture, environmental sciences and public health has emerged as one of the new paradigms in today’s knowledge economy. This convergence between optical and biosciences is due to the recent significant advances of photonics and biotechnologies driven by the various health, environment, and defence challenges faced by humanity at the beginning of 21st century (Tanev et al., 2008).
The photonic is the science and technology of generation, manipulation, and detection of photons, quantum units of light. Photonic is related to electronic in that it is believed that photons will play a similar central role in future information technology as electrons do today. Therefore, this discipline has become the established general term for all techniques dealing with the interaction between biological items and photons. This refers to emission, detection, absorption, reflection, modification, and creation of radiation from biomolecular, cells, tissues, organisms and biomaterials. Photonics utilizes photons instead of electrons to transmit, process, and store information and thus provides a tremendous gain in capacity and speed in information technology. Photonics is an all-encompassing light-based optical technology that is being hailed as the dominant technology for this new millennium (Prasad, 2003).
A new extension of photonics is biophotonics, which involves a fusion of photonic and biology (Birge, 2004). Biophotonic includes all the technological and engineering disciplines that use the electromagnetic radiation as the main carrier of information (light=photos, in all its extension and bands) in earth sciences and biosystems applications. It offers great hope for the early detection of diseases and for new modalities of light-guided and light-activated therapies. Also, biology is advancing photonics, since biomaterials are showing promise in the development of new photonic media for technological applications (Prasad, 2003).
3.1.1 Nature of light
Light is an electromagnetic field consisting of oscillating electric and magnetic disturbances that can propagate as a wave through a vacuum as well as through a medium.
Electromagnetic spectrum comprises of radio waves, microwaves, infrared rays, visible light, ultraviolet rays, X-rays, and gamma rays (Fig. 3.1.1.1).
Figure 3.1.1.1: Electromagnetic spectrum (from Kaiser, 1996).
The electromagnetic spectrum is the range of all possible frequencies of electromagnetic radiation and represents the characteristic distribution of electromagnetic radiation emitted or absorbed by that particular object. It extends from low frequencies used for modern radio communication to gamma radiation at the short-wavelength (high-frequency). The types of electromagnetic radiation are broadly classified into the following classes: gamma radiation, X-ray radiation, ultraviolet radiation, visible radiation, infrared radiation, microwave radiation and radio waves. This classification goes in the increasing order of wavelength, which is characteristic of the type of radiation. While, in general, the classification scheme is accurate, in reality there is often some overlap between neighbouring types of electromagnetic energy (http://en.wikipedia.org/wiki/Electromagnetic_spectrum).
Depending on the optical regions, different units are used to characterize the wave. For the visible region, the common practice is to use the nm [or angstrom (Å)=10-1 nm] unit of wavelength or cm-1 unit of wave number. For the near-IR to mid-IR region, one often uses the wavelength in micrometers or microns (mm). From the mid-IR to far-IR region, one uses the wave number in cm-1 to characterize a wave (Prasad, 2003). Figure 3.1.1.2 defines the wavelength of a wave.
Figure 3.1.1.2: Schematic of a wave defining its wavelength reported by (from Prasad, 2003).
The interaction of light at the molecular level produces absorption, refraction, reflection, and scattering during the propagation of light through a bulk sample crating various photophysical and photochemical processes produced in the excited state generated by light absorption (Prasad, 2003).
These manifestations also play an important role in understanding the interaction of a biological bulk specimen such as a tissue with light. A major branch of interaction between light and matter is spectrophotometry, which involves the study of a transition between quantized levels.
3.1.2 Biophotonics in the agro-environment
The use of biophotonic in agricultural engineering discipline is growing in relation to the high innovation rate (based on high-tech sectors: optics, electronics, computers and algorithms) and the needs of research, production monitoring and control systems, highly informative, multiparametric, rapid and non destructive, for applications in the field (on-the-go) or in the process line (on-line) (Menesatti, 2010). Numerous studies have been analyzed and reported for agricultural applications in: robotics (vision), tractors and self-propelled machines (automatic or assisted guide), agricultural field machines (fertilizers and pesticide precise distribution), test and certification of operational characteristics and work quality, post-harvest machines (fruit selection based on external and internal qualities), quality of agricultural products (meat, fruit and vegetables, fish) and food (cheese, bread). In particular, n agriculture biophotonic research has made it possible to examine the quality of foodstuffs and the effect of different measures on them (Oikarinen, 1996).
The optoelectronic play an important role in agriculture and food industry for the rapid, non destructive and objective detection of quality represented by the organoleptic properties (Guidetti et al., 1998; Menesatti, 2000).
Among such a variety of applications this Ph.D. activities considers two of the most innovative technical-methodological sector of application: spectrophotometry and thermal analysis which have been reported in experimental applications published all on international ISI journals.
3.1.2.1 Visible (VIS) and Near Infrared (NIR) spectrophotometry
The study of radiation absorbed or reflected (i.e. determination of absorption or reflectance spectrum with spectrophotometers) is a valid and quantitative method to characterize and identify many compounds. Generally, spectrophotometry is based on the ability of the material to absorb or reflect a certain amount of incident light energy.
Spectral-based systems can be separated into two classes: 1) probe or punctual systems; 2) imaging systems. The first type provides an averaged measure of spectral values of the area acquired by the probe, integrating sphere or other devices. The second system acquires a whole sample image, extracting the spectrum for each pixel (Urbani et al., 2002).
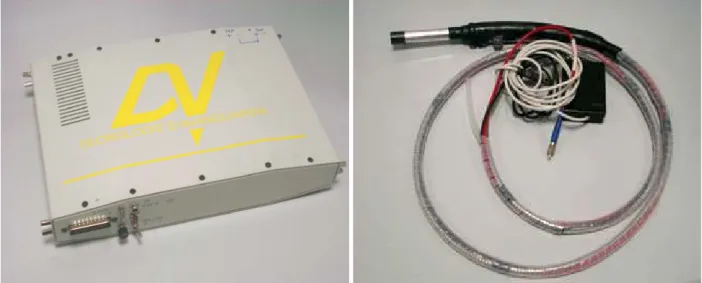
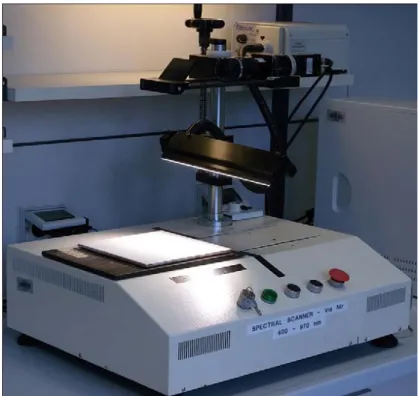
The spectrophotometer is an instrument for spectral components acquisition of reflected or transmitted light by objects. The measured value is mediated on object area framed by the capture probe. Within this area, the system is unable to distinguish the spectral contributions of different structures. The system especially consists of a spectrometer (passive optical device) and the electronic equipment to generate light and acquisition, elaboration and transmission cable of the light signal converted into an electrical signal. A timely example of a system is illustrated in Figure 3.1.2.1.1.
700-1180). For the full range of sensitivity, the system provides spectral data on average every 3 nm (300 wavelengths), with a maximum dynamic of signal of 14 bits (65,000 levels). The reflectance is also influenced by the spectrum of the illumination light. Generally, illumination systems are based on halogen lamps with dichroic (non-reflective infrared) or aluminium base (reflecting infrared spectrum) to illuminate the target with a full spectra white light.
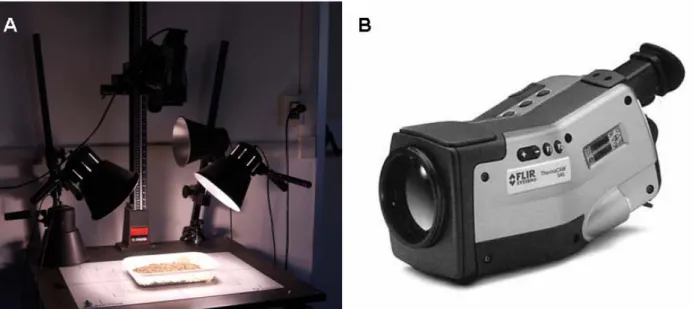
The imaging systems with VIS-NIR and NIR spectrophotometers (Fig 3.1.2.1.2) were composed of four parts: (1) a sample transportation plate (spectral scanner DV, Padova, Italy) (common to both systems); (2) a collimated illumination device (Fiber-lite, Dolan-Jenner, MA, USA) with a 150 W halogen lamp and an illumination opening in the optical fibre measuring 200 mm long by 2 mm width, positioned at 45° to the transportation plate for minimum light divergence (common to both systems); (3) an imaging spectrographs (VIS-NIR: ImSpec V10; NIR: ImSpec N17, Specim Ltd, Oulu, Finland) coupled with a standard C-mount zoom lens; and (4) digital camera (VIS-NIR: Teli charge-coupled device (CCD) monochrome camera, Toshiba-Teli CS8310BC; NIR: Pixelvision SU128 InGaAs IR camera).
Figure 3.1.2.1.2: Visible-Near Infrared (VIS-NIR) spectrophotometer for the spectral images acquisition.
The imaging spectrometers were used to acquire images ranging from 400 to 970 nm and from 1000 to 1700 nm respectively. The two spectrographs are based on a patented prism-grating-prism (PGP) construction (a holographic transmission grating). The incoming line image (frame) was projected and dispersed onto the 2D CCD. Each frame contained the line pixels in one dimension (spatial axis) and the spectral pixels in the other dimension (spectral axis),
providing full spectral information for each line pixel. The reconstruction of the entire hyperspectral image of the sample was performed by scanning the sample line-by-line as the transportation plate moved it through the field of view. The resolution of the line image was 700 pixels by 10 bits for the VIS-NIR and 128 pixels by 12 bits for NIR. The system was operated in a dark laboratory to minimize interference from ambient light. All spectral values were expressed in terms of relative reflectance (R), following equation 1:
b w b s r r r r R − − =
where R is the relative reflectance of the sample at a given wavelength; rs is the absolute signal value (radiance) measured for the sample at the wavelength; rb is absolute signal value (radiance) measured at each wavelength for the black background (noise); rw is absolute signal value (radiance) measured at the wavelength for a standard white background (100% of reflectance).
3.1.2.2 Thermal analysis
Temperature measurement is an important aspect in any industrial process and infrared and thermal applications have revolutionized the concept of temperature measurement. Temperature measurements were generally performed using thermometers, thermocouples, thermistors and resistance temperature detectors. These instruments can only determine temperature at specific points and most of these instruments need to establish a contact with the material, while, infrared thermal imaging is a non-contact and non-destructive technique which provides temperature mapping of a material. For these reasons the use of infrared thermal imaging is widely increasing in many fields (Vadivambal & Jayas, 2010). All objects above 0 K (−273.15°C) emit infrared rays which are part of the electromagnetic spectrum. The wavelength of infrared rays is in the range of 0.78– 1,000 μm. The infrared region is further divided into different regions: near infrared (0.75–3 μm), mid infrared (3–6 μm), far infrared (6–15 μm), and extreme infrared (15– 1,000 μm) (Meola & Carlomagno, 2004). The intensity of radiation emitted by an object is a function of its surface temperature, i.e., the higher the temperature of the body, the greater is the intensity of infrared radiation emitted by the object. Thermal imaging is a technique which converts this radiation emitted by an object into temperature data without establishing contact with the object (Vadivambal & Jayas, 2010).
molecules vibrate slower and energy of longer wavelengths is emitted. When the temperature of the object rises, its molecules vibrate faster and the wavelength becomes shorter (Antonucci et al., 2011).
Among the different image analysis techniques and technologies, thermography has the capability to associate to the image information, the thermal punctual information, which is the temperature of each single pixel, in order to operate comparison between objects inside the same image. Thermal imaging devices provide the observer with instruments that can collect (just like a video or still camera) and convert the thermal infrared radiation emitted (and reflected) by objects into images that can be seen on a view screen or computer display (Menesatti et al., 2007).
Thermal imaging has a wide application in various fields such as civil engineering, industrial maintenance, aerospace, medicine, pharmacy, and veterinary.
The application of thermal imaging is gaining popularity in agriculture and food industry in recent years. The major advantages of thermal imaging are non-contact, non-invasive, and rapid technique which could be used for online applications. The thermal cameras are easy to handle and highly accurate temperature measurements are possible. With the thermal imaging, it is possible to obtain temperature mapping of any particular region of interest with fast response times which is not possible with thermocouples or other temperature sensors which can only measure spot data. Repeatability of temperature measurements is high in thermal imaging. Also, thermal imaging does not require an illumination source unlike other imaging systems (Vadivambal & Jayas, 2010).
Infrared thermal imaging system comprises of thermal camera equipped with infrared detectors, a signal processing unit and an image acquisition system, usually a computer.
All objects with a temperature greater than absolute zero (–273°C) emit infrared radiation. The emissivity, absorptivity, transmissivity, and reflectivity of infrared radiation vary for different materials. In general, the objects which are good absorbers of infrared radiation are also good emitters (Manickavasagan et al., 2005). The infrared detectors absorb the infrared energy emitted by the object and convert it into an electrical impulse. The electrical impulse is sent to the signal processing unit which translates the information into thermal image. Most of the thermal imaging devices scan at a rate of 30 times per second and can sense temperature ranging from −20 to 1,500°C, but the temperature range can still be increased by using filters (Meola & Carlomagno 2004). Detectors are the most important part of thermal imaging system which converts the radiant energy into electrical signals proportional to the amount of radiation falling on them. Thermal imaging devices can be classified into uncooled and cooled. The uncooled thermal imaging device is the most common one and the infrared detector elements are contained
in a unit that operates at room temperature. They are less expensive but their resolution and image quality tend to be lower than the cooled device. In the cooled thermal imaging device, the sensor elements are contained in a unit which is maintained below 0°C. They have a very high resolution and can detect temperature difference as low as 0.1°C but they are expensive. Cooled thermal imaging devices are used in military and aerospace applications. An infrared imaging system is evaluated based on thermal sensitivity, scan speed, image resolution, and intensity resolution (Vadivambal & Jayas, 2010). Thermal imaging has a potential application in many operations involved in agriculture, starting from assessing the seedling viability, estimating soil water status, estimating crop water stress, scheduling irrigation, determining disease and pathogen affected plants, estimating fruit yield, and evaluating maturity of fruit and vegetables. This section elaborates on studies conducted to determine potential use of thermal imaging in agriculture (Vadivambal & Jayas, 2010). This method is suitable for making quality determination of surface temperature than quantitative measurement (Davis & Lettington 1988). This technology can be used in all agricultural materials and processes, where heat is generated or lost in space and time (Hellebrand et al. 2002). Small variations (below 1°C) can also be successfully measured with proper equipment and methodology.
3.2 Signal analysis
3.2.1 Multivariate statistical analysis
Multivariate analyses are generally divided into two main categories: unsupervised and supervised. For unsupervised techniques, grouping or clustering methods for multivariate elements (x-block) are based on functional relationships among the same elements (distances, variances). They do not need for an a priori knowledge of the class categories. Differently, in supervised techniques, the class attribution is given by a single or multiple variables (y-block). In this way, multivariate methods are forced to cluster into a priori established classes. Unsupervised methods are mainly applied in an exploratory sense, when the aim is to analyze or visualize non-forced aggregating relationships (unsupervised) among elements (Forina, 2006).
Concerning supervised techniques, it is possible to distinguish two main analytical approaches: modelling and classification. Supervised methods are derived from the observation and then the use of known classes, called the training set. The derived classification criteria can then be used to classify each new object within a test set. This can be applied for both classification and the computing of efficiency parameters. Classification analysis needs a decision rule, called the “classification criterion”, to distinguish objects into classes on the basis of selected quantitative features (Jayas et al., 2000). For modelling, it is instead possible to attribute objects not only into one or more classes but also to none (i.e. in this case, the object is an outlier). Modelling techniques calculate the “prediction probability” with a classification threshold for each modelled class. The modelling efficiency is indicated by statistical parameters such as “sensitivity” and “specificity”.
Sensitivity represents the percentage of the objects of a category accepted by the modelled class. Specificity is the percentage of objects different from the modelled classes, as rejected by this classification criterion. On the other hand, for the classification, a matrix of correct classification can be used (Forina, 2006). The statistics used to investigate ratios and shape indices are normally descriptive and represented by simple regression (Li et al., 2004), ANOVA (Brewer et al., 2007), PCA and canonical discriminant analysis (Brewer et al., 2007). Many other studies uses instead shape-based methods in association with PCA (Ohsawa et al., 1998; Paulus & Schrevens, 1999; Currie et al., 2000; Cannon & Manos, 2001; Beyer et al., 2002; Goto et al., 2005; Morimoto et al., 2005; Brewer et al. 2006). This is because different shapes exhibit a certain level of quantitative variation related to genotypic and environmental effects. While shape can be categorized in some way for species, sub-species, cultivar, merceologic classes, crops, etc., the quantitative variation in fruit shape can be analysed by methods based on classification and modelling such as PLS-based (PLS, PLSDA; Sjöström et al., 1986; Sabatier et al., 2003; Bylesjo et al., 2006; Tominaga, 2006; Menesatti et al., 2008; Antonucci et al., 2011;
Costa et al., 2011), soft independent modelling of class analogy (SIMCA; Bylesjo et al., 2006; Tominaga, 2006; Casale et al., 2007; Aguzzi et al., 2009a, b), clustering of the Fourier coefficients (Costa et al., 2009a, b) and standard non-linear Bayesian discriminant analysis (Blasco et al., 2009). Also, ANNs have been widely used for quantifying the variation in the shape of fruit (Morimoto et al., 2000). ANNs are very effective in many applications and are particularly useful as generalized non-linear regression tools (Costa et al., 2009b). They can perform arbitrary non-linear mappings in patterns of information.
4. In-field soil preparation
The basic objectives of in-field management of agricultural inputs are to increase profitability of production, improve product quality and protect the environment. As reported by Adamchuk et al. (2004) information about the variability of different soil attributes within a field is essential for the decision-making process. The inability to obtain soil characteristics rapidly and inexpensively is one of the biggest limitations of precision agriculture. It is observed that generally, data are collected, processed and stored in different physical location making the analysis operations very slow and not suitable to managing agricultural practices to be carried out immediately (e.g., crop plantation, cropping decision, irrigation scheduling, fertilization rates, etc.).
One of the most critical aspects of soil testing is actually obtaining representative soil samples (i.e. collected with adequate spatial density at the proper depth and during the appropriate time) (Adamchuk et al., 2004). In addition, with mechanization and intensification of agriculture in Europe, fields and farms are becoming larger. Nowadays, random, adaptive and grid sampling techniques are often used. In random sampling, soil cores are obtained from random locations within the field. In adaptive sampling, selected locations depend on prior information. Grid sampling, on the other hand, involves systematically collecting samples from predetermined points in the field.
Numerous researchers and manufacturers have attempted to develop on-the-go soil sensors to measure mechanical, physical and chemical soil properties (Sonka et al., 1997). However, currently inputs, such as for example fertilizer, pesticides and irrigation, are applied uniformly despite numerous variations in the soil type and crop density (West et al., 2003). Recent developments in agricultural machinery have made it possible to spatially adjust farm applications (Secher, 1997). As reported by Hellebrand et al. (2002) since precision farming utilises higher spatial resolution than traditional farming, extensive soil and plant data have to be managed. For these reasons fast measuring techniques (i.e., sensor-based managing; see paragraph 2.3.2) are looked for, which provide information on the state of soil and plants. The main advantage of these methods is that they are usually non-destructive. Moreover, knowledge on heterogeneity of the fields, in particular on soil spatial variability, is essential for a good agricultural practices management. Information on the state of the soil and plants may be getting as on-the-go monitoring of variable quantities in line with immediate responds of the machine system. The other possibility is the separation in time of sensing and control action. The number of data sets increases in dependence with the spatial resolution: the smaller the sites, which are treated uniformly within the field, the more data sets must be supplied.
Generally, in-field sensor-based managing is needed in site-specific crop production for the control of soil and plant properties, which are spatially variable. Essential for economy and environment, and which cannot be recognised by the farmer during field-work immediately (Hellebrand et al., 2002).
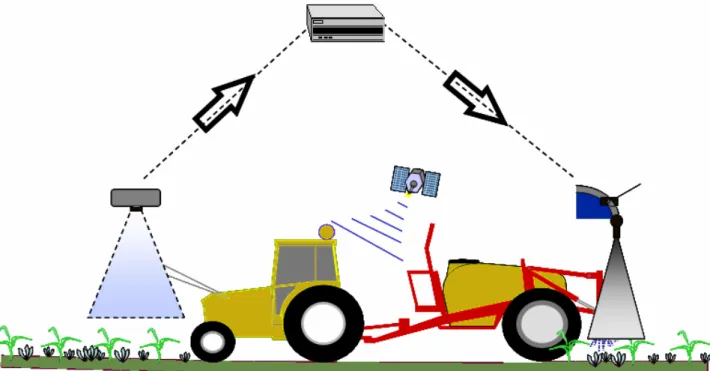
Appropriate sensors mounted on a ground-based vehicle (Fig. 4.1) could have a high resolution, allowing the possibility to collect data for soil survey (McKenzie & Austin, 1993), soil evaluation for sustainable use (Fu et al., 2000) and specific agricultural planning and management (Lark, 1999).
Figure 4.1: Example of sensors mounted on a ground-based vehicle for in-field applications (adapted from Oberti,
2009).
In this context, an important agro-environmental production parameter to rapidly monitor directly in field is the soil water content, which, if not monitored regularly and intensively, could represent a serious problem in farm management practices. The effects of crop management practices on soil water content may vary geographically and temporally depending upon environmental and climatic conditions (Doran & Smith, 1987). Greater knowledge of the short- and long-term effects of various agricultural management practices on soil biological, chemical, and physical properties is needed to assess the contribution of these practices to sustainable land management (Franzluebbers et al., 1995).
4.1 Soil water content estimation
As all soil properties, water content is variable in three dimensional space and in time. This variability complicates the tasks of measuring, modelling, estimating or forecasting of soil properties. Variability has been dealt with in numerous ways, including the collection of a great number of samples and through various statistical approaches (Hignett & Evett, 2008) but this is too expensive and is not possible in some circumstances.
The standard method of soil water content measurement involves taking a physical sample of the soil, weighing it before any water is lost, and drying it in an oven before weighing it again. The mass of water lost on drying is a direct measure of the soil water content. This measure is normalized either by dividing by the oven-dry mass of the soil sample, or by converting the mass of water to a volume (by dividing the mass of water by the density of water) and dividing this volume of water by the volume of the sample.
The mass basis water content of a field soil can be used for comparative purposes and is useful when soil volume changes, as with tillage. However, for most irrigation, cropping decisions, crop water use, and water use efficiency work, what is required is the volume of water in a certain volume of soil or the equivalent depth of water in a certain depth of soil. Both of these require knowledge of the volumetric water content. The standard measures of soil water only apply to the position in the soil that was sampled. A single such sample is of limited value to an irrigator, crop or environmental scientific or hydrologic managements. Moreover, the use of direct soil sampling is destructive of the field, labour intensive, is often slow, not timely and may be costly. Also, by its nature, direct sampling cannot measure the water content in the same place twice. For work that depends on the change in water content with time, this fact adds further variability to the data due to the inherent small scale variability of water content (Hignett & Evett, 2008).
In the past few decades, a great number of automated techniques for point measurement of soil water content have been developed and tested because of the important role soil water content plays in guiding the management of for example irrigation and drainage (Luhr & Kleisinger, 1998; Evett, 2008). Generally, as reported by Chow et al. (2009) those techniques can be classified into the various categories: i) tensiometers (a plastic tube with a porous ceramic cup attached at one end and a vacuum gauge or a pressure transducer on the other end, measuring the soil water tension or suction in units of kPa; ii) resistance blocks (two electrodes imbedded in a porous material determining soil water according to electrical resistance measured with an alternating current bridge); iii) heat dissipation type (derives soil water by measuring how much heat is dissipated in a ceramic medium buried in a soil); iv) dielectric sensors (obtain soil water by measuring the apparent dielectric constant of a soil); v) connector type sensors
(based on dielectric properties of a soil); vi) neutron method (consisting of a radioactive fast neutron source probe and a helium-3 detector, estimating soil water by the recorded count of thermal neutrons which are thermalized by the hydrogen present in the soil).
All these methods are destructive and time-consuming. A new method to overcome these difficulties and indirectly determine soil water content by measuring its temperature changes after heating is represented by the active infrared thermal analysis.
4.1.1 Why monitor soil water content?
Soil water content is an important factor used in agriculture to make decisions regarding land managers making decisions concerning livestock grazing patterns, crop planting, irrigation scheduling, and soil stability for agricultural machinery operations (Qiu et al., 2001). Moreover, the spatial variation of soil water content is a necessary and preliminary part for parametric soil and land survey (McKenzie & Austin, 1993), spatial prediction of soil moisture (Ladson & Moore, 1992; Grayson & Western, 1998; Lark, 1999; McKenzie & Ryan, 1999), soil and land evaluation for sustainable use (Fu et al., 2000), specific farm planning and management (Odeh et al., 1994; Lark, 1999), hydrologic modelling and watershed management (Western & Grayson, 1998) and irrigation scheduling (Jones, 2004).
Cultivation of crops involves several activities undertaken by farmers over a period of time. These activities or tasks are referred to as agricultural practices (e.g., preparation of soil, sowing, adding manure and fertilisers, irrigation, protecting from weeds, harvesting and storage). The preparation of soil is the first step before growing a crop. One of the most important tasks in agriculture is to turn the soil and loosen it. The process of loosening and turning of the soil is called tilling or ploughing. If the soil is very dry, it may need watering before ploughing. For this reason it is very important to know the soil water content as first step to prepare soil for crop planting.
Also in the irrigation scheduling it is fundamental to fast detect the soil water content. In fact, irrigation is an increasingly important practice in the management of valuable water resources in agricultural regions. The increasing worldwide shortages of water and costs of irrigation are leading to an emphasis on developing methods of irrigation that minimize water use (maximize the water use efficiency). The advent of precision irrigation methods such as trickle irrigation has played a major role in reducing the water required in agricultural and horticultural crops, but has highlighted the need for new methods of accurate irrigation
In addition land use, an alternative attribute that is easily obtained, also plays an important role in controlling spatial patterns of soil moisture by influencing the infiltration, runoff and evapotransipiration, particularly during the growth season (Fu & Chen, 2000; Fu et al., 2000).
4.2 Case study
For the in-field soil preparation phase a rapid soil water content detection by active infrared thermal methods was developed. This case study was published in an international peer-reviewed journal with impact factor.
The aim was to investigate the suitability of active infrared thermography and thermometry, combined with multivariate statistical partial least squares analysis, as rapid soil water content detection techniques both in laboratory and in-field. These techniques allowed fast soil water content measurements helpful in both agricultural and environmental fields (Fig. 1.1).