code for the numerical simulation of fuel behavior.
With respect to the European fuel pin performance code TRANSURANUS (Lassmann et al., 2014), several developments allowed for the more accurate description of fuel pin behavior in liquid-metal-cooled FRs. In particular, Politecnico di Milano (POLIMI) performed extensive preliminary modeling and analysis of the ALFRED (Advanced Lead Fast Reactor European Demonstrator) fuel pin behavior (Luzzi et al., 2014a; Luzzi et al., 2014b; Aly et al., 2015).
The first part of the present report summarizes the development introduced in this direction. More in detail, POLIMI developed a grain-boundary micro-cracking model for the description of transient fission gas release (burst release) and validated it against experimental data. Moreover, POLIMI present a new algorithm dedicated to the solution of the intra-granular effective diffusion equation in time-varying conditions. In the end, POLIMI present a recently developed preliminary model for the behavior of fission gas in the high burnup structure.
The second part of the report belongs to the PCMI Benchmark and constitutes the in kind contribution of ENEA of the first year. The document contains the simulations by TRANSURANUS fuel performance code (version 2012) of the hypothetical cases released in the framework of the project: case 1 and case 2.
In particular:
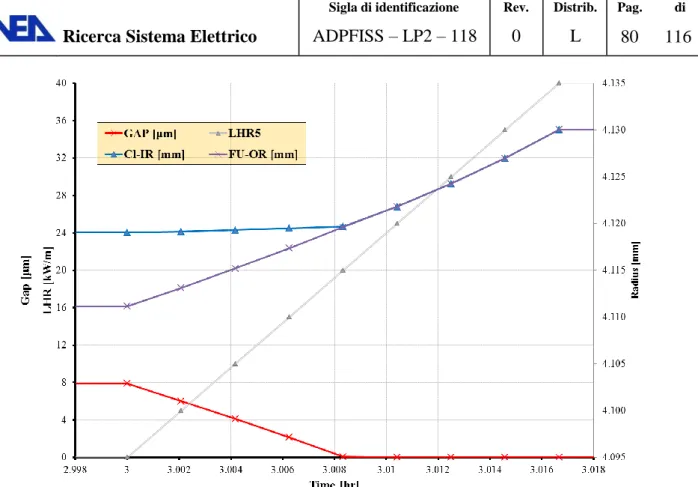
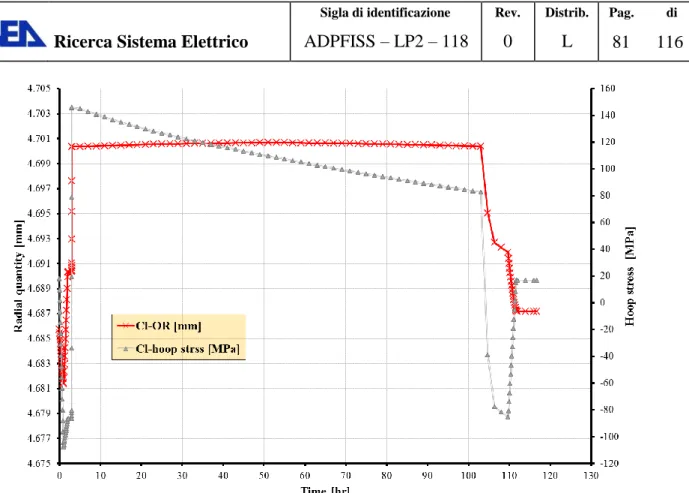
Case 1 is intended to simulate an hypothetical beginning-of-life ramp of a short PWR rod-let (10 pellets) to a rod average rating of 40 kW/m. A ramp-up over 1 minute (at a constant ramp rate), followed by a hold for 100 hours is to be simulated.
Case 2 is complementary to Case 1, in that it simulates a hypothetical beginning-of-life ramp of a full-length commercial PWR rod to a peak local rating of 40 kW/m. As in Case 1, a ramp-up over 1 minute (at a constant ramp rate), followed by a hold for 100 hours is to be simulated.
P
ARTEA.
S
UPPORTO ALLA PROGETTAZIONE DEL COMBUSTIBILENUCLEARE PER IL REATTORE
LFR
–
C
ONTRIBUTOPOLIMI-CIRTEN………7
P
ARTEB.
S
UPPORTO ALLA PROGETTAZIONE DEL COMBUSTIBILEAdvancement in FGR modeling
for transient analysis of FR fuel
Lelio Luzzi, Tommaso Barani, Elisa Bruschi, Davide Pizzocri
CERSE-POLIMI RL 1506/2016
Milano, Agosto 2016
Lavoro svolto in esecuzione dell’Attività LP2.A3_a
AdP MSE-ENEA sulla Ricerca di Sistema Elettrico - Piano Annuale di Realizzazione 2015 Progetto B.3.1 "Sviluppo competenze scientifiche nel campo della sicurezza nucleare
LP2.A.3_a 8 CERSE-POLIMI RL 1506/2016
LP2.A.3_a 9 CERSE-POLIMI RL 1506/2016
Index
INTRODUCTION ... 11
LIST OF ACRONYMS ... 13
LIST OF FIGURES ... 15
1. MODELING OF GRAIN-BOUNDARY FISSION GAS BEHAVIOR DURING TRANSIENTS... 17
1.1GENERAL CONSIDERATIONS ... 17
1.2EXPERIMENTAL EVIDENCE ... 18
1.3FISSION GAS BEHAVIOR MODEL ... 22
1.3.1 Diffusion-based model ... 22
1.3.2 Burst release model ... 23
1.4VALIDATION RESULTS ... 27
2. MODELING OF INTRA-GRANULAR FISSION GAS BEHAVIOR DURING TRANSIENTS ... 33
2.1GENERAL CONSIDERATIONS ... 33
2.2MATHEMATICAL PROBLEM ... 35
2.3POLYPOLE-1 ALGORITHM DEVELOPMENT ... 37
2.4POLYPOLE-1 ALGORITHM VERIFICATION ... 39
3. PRELIMINARY MODELING OF HIGH BURNUP STRUCTURE FISSION GAS BEHAVIOR DURING TRANSIENTS ... 45
3.1GENERAL CONSIDERATIONS ... 45
3.2MODELING ... 46
3.2.2. Fission gas diffusion ... 47
3.2.3 Xenon depletion... 48
CONCLUSION AND FUTURE WORK ... 51
LP2.A.3_a 10 CERSE-POLIMI RL 1506/2016
LP2.A.3_a 11 CERSE-POLIMI RL 1506/2016
Introduction
Fuel pin performance analysis is of fundamental importance in the wide and complex framework of the safety analysis of liquid-metal-cooled Fast Reactors (FRs). In fact, the thermo-mechanical behavior of the nuclear fuel (intended as fuel and cladding) has feedback on the neutronic and thermo-hydraulic behavior of the reactor core. Considering the large amount of tightly coupled phenomena occurring in nuclear fuel and in the cladding (e.g., creep, cracking, relocation, fission gas release, swelling), the accurate representation of fuel performance requires the development of dedicated codes, i.e., fuel pin performance codes.
With respect to the European fuel pin performance code TRANSURANUS (Lassmann et al., 2014), several developments allowed for the more accurate description of fuel pin behavior in liquid-metal-cooled FRs. In particular, Politecnico di Milano (POLIMI) performed extensive preliminary modeling and analysis of the ALFRED (Advanced Lead Fast Reactor European Demonstrator) fuel pin behavior (Luzzi et al., 2014a; Luzzi et al., 2014b; Aly et al., 2015).
These preliminary analyses pointed out the need to improve TRANSURANUS capabilities of fission gas behavior modeling (i.e., fission gas release and gaseous swelling) during both base irradiations and power transients.
The present report summarizes the development introduced in this direction. More in detail, we developed a grain-boundary micro-cracking model for the description of transient fission gas release (burst release) and validated it against experimental data. Moreover, we present a new algorithm dedicated to the solution of the intra-granular effective diffusion equation in time-varying conditions. In the end, we present a recently developed preliminary model for the behavior of fission gas in the high burnup structure.
LP2.A.3_a 12 CERSE-POLIMI RL 1506/2016
LP2.A.3_a 13 CERSE-POLIMI RL 1506/2016
List of acronyms
BC Boundary Condition
EPMA Electron Probe Micro Analysis
FGB Fission Gas Behavior
FGR Fission Gas Release
FR Fast Reactor
FUMAC FUel Modelling in Accident Conditions
FUMEX FUel Modelling at EXtended burnup
HBS High Burnup Structure
IAEA International Atomic Energy Agency
IC Initial Condition
IFPE International Fuel Performance Experiments
KJMA Kolmogorov-Johnson-Mehl-Avrami
LWR Light Water Reactor
NEA Nuclear Energy Agency
OECD Organization for Economic Co-operation and Development
PIE Post-Irradiation Examination
POLIMI Politecnico di Milano
SEM Scanning Electron Microscope
LP2.A.3_a 14 CERSE-POLIMI RL 1506/2016
LP2.A.3_a 15 CERSE-POLIMI RL 1506/2016
List of figures
Figure 1. Experimental evidence of burst release during post-irradiation annealing. (a) Burst release kinetics during heating and cooling transients (Rothwell, 1962). (b) UO2 annealing experiment in which maximum burst release appears to be a peaked function of temperature (Une and Kashibe, 1990). (c) Burst release triggered by temperature variations during Vercors experiment under severe accident conditions (Ducros et al., 2013). ... 19 Figure 2. SEM image of transient-tested oxide fuel. The separation of grain faces is clearly recognizable (White, 2004). ... 21 Figure 3. (a) Experimental data of the maximum burst release temperature, Tcent, as a function of
burnup and best-estimate fitting curve. (b) Micro-cracking parameter, 𝑚, and its derivative d𝑚d𝑇, as a function of temperature. The asymptotic value of central temperature is fixed at 1773 K (i.e., burnup above 50 GWd tU-1). ... 26 Figure 4. Summary of the experiments considered in this work from the OECD/NEA IFPE database. In particular, experiments 1–18 are from the Super-Ramp PWR program, 19–25 are from the Super-Ramp BWR program, 26–36 are from the Inter-Ramp BWR program, 37–48 are from the Risø-3 program, 49 is from the REGATE program, and 50 is IFA 597.3. ... 29 Figure 5. Summary of the validation results of the burst release model in TRANSURANUS against fifty experiments from the IFPE database. Each point corresponds to a simulation. The distance of each point from the 45° line is a measure of the accuracy. The reported uncertainty bands are in agreement with Pastore et al. (2015). ... 31
LP2.A.3_a 16 CERSE-POLIMI RL 1506/2016
Figure 6. FGR and fuel central temperature as a function of time for the AN3 rod during the ramp test. Comparison between the results calculated with TRANSURANUS and the experimental data, with (w/) and without (w/o) the burst release model. ... 32 Figure 7. Comparison between the URGAS, FORMAS and PolyPole-1 algorithms in terms of relative error with respect to the reference finite difference algorithm. Each data point corresponds to a calculation with randomly generated conditions. ... 42 Figure 8. Comparison between the computational times associated with the finite difference, URGAS, FORMAS and PolyPole-1 algorithms. Each data point corresponds to a calculation with randomly generated conditions. ... 43 Figure 9. Comparison of the intra-granular xenon concentration measured by EPMA (Walker, 1999) on several samples with the calculation of the present model, as a function of local effective burnup. The impact of assuming a different initial grain radius, 𝑎0, is also shown, with bigger radii delaying the xenon depletion. The comparison with the model from Lassmann et al. (1995) is reported. ... 49
LP2.A.3_a 17 CERSE-POLIMI RL 1506/2016
1. Modeling of grain-boundary fission gas behavior during transients
In this Section, the modeling of grain-boundary fission gas behavior during transient (i.e., burst release model) is presented. The model has been implemented in the TRANSURANUS fuel performance code, and validated against experimental data from the OECD/NEA International Fuel Performance Experiments (IFPE) database (Sartori et al., 2010).
1.1 General considerations
The fission gas behavior consists of many processes: fission gas generation, diffusion, retention and release. Each of them has a strong impact on the thermo-mechanical behavior of the nuclear fuel rods (Olander, 1976). The focus of this work is the burst release, which consists in the abrupt release of gas during temperature transients. The rapid kinetics of this process cannot be explained with a diffusion-based model. Representing this effect is essential for the proper performance analysis of fission gas behavior, since it can be critical during operational reactor transients and design-basis accidents.
The modeling of fission gas behavior in oxide fuel requires the treatment of several complex and concomitant processes (Olander, 1976; Matzke, 1980; White and Tucker, 1983; White, 2004; Van Uffelen et al., 2010). The first process to be considered is the formation of a population of intra-granular fission gas bubbles, exchanging gas with the polycrystalline plutonium and uranium dioxide matrix through the trapping and resolution mechanisms. The second one is the diffusion of the fission gas atoms generated in the fuel grains towards the grain boundaries. At the grain boundaries, the inflow of fission gas atoms causes the growth of inter-granular lenticular bubbles. The interconnection of the inter-granular bubble population contributes to the fission gas release (FGR) to the rod free volume.
LP2.A.3_a 18 CERSE-POLIMI RL 1506/2016
In addition to this diffusion-interconnection process, experimental observations suggest that gas release from the grain faces may occur by a mechanism of grain-face separation due to micro-cracking. In the burst release model, the micro-cracking mechanism is assumed to be responsible for the sudden FGR observed in transient tests. The model also includes an irradiation-induced micro-crack healing process, which gradually restores the original grain-face gas storing capacity.
1.2 Experimental evidence
Fission gas release bursts during transients have been observed experimentally, both during post-irradiation annealing (Rothwell, 1962; Une and Kashibe, 1990; Ducros et al., 2013) and during irradiation (Notley and MacEwan, 1966; Carroll et al., 1969; Hasting et al., 1986; Walker et al., 1988; Nakamura et al., 1999; Sartori et al., 2010) of oxide and mixed oxide nuclear fuel. In post-irradiation annealing experiments, release rate peaks (bursts) were observed during fuel temperature variations, for both heating and cooling. Moreover, burst release mostly occurred within a certain temperature range, with the maximum release rate observed at temperatures around 1500°C (Rothwell, 1962; Une and Kashibe, 1990; Ducros et al., 2013). Figure 1 presents results from post-irradiation annealing experiments.
LP2.A.3_a 19 CERSE-POLIMI RL 1506/2016
Figure 1. Experimental evidence of burst release during post-irradiation annealing. (a) Burst release kinetics during heating and cooling transients (Rothwell, 1962). (b) UO2 annealing experiment in
which maximum burst release appears to be a peaked function of temperature (Une and Kashibe, 1990). (c) Burst release triggered by temperature variations during Vercors experiment under severe accident conditions (Ducros et al., 2013).
LP2.A.3_a 20 CERSE-POLIMI RL 1506/2016
In experimental fuel rod irradiations, the kinetics of transient FGR has been inferred through measurements of rod inner pressure. Notley and MacEwan (1966) first observed a stepwise kinetics during power transients. They ascribed such behavior to release of gas stored at the grain boundaries following fuel micro-cracking during the transients. Also Carroll et al. (1969) attributed to micro-cracking along grain boundaries an increase of the FGR rate observed during UO2 irradiation experiments. This rapid kinetics, incompatible with a purely diffusion-based description, supports the hypothesis of micro-cracking as the underlying mechanism of burst release. Examinations of transient-tested fuel rods (Hasting et al., 1986; Walker et al., 1988, White et al., 2006) directly demonstrated the presence of grain-face separations. In these papers, micro-cracking was postulated to be responsible for the high FGR observed during the transient tests. Scanning Electron Microscope (SEM) analyses of transient-tested UO2 from the Advanced Gas Reactor/Halden Ramp Test Programme (White, 2004; White et al., 2006) clearly indicated the presence of grain-face separations (i.e., cracks). Such SEM images suggest that micro-cracking triggers the gas depletion of a fraction of the grain faces, without affecting the gas inventory and the gas storing capacity of non-cracked grain faces (Fig. 2). Burst release has been observed also at low burnups, when the inter-granular bubble population is not fully interconnected (Baker and Killeen, 1987; Small, 1988; Une and Kashibe, 1990).
LP2.A.3_a 21 CERSE-POLIMI RL 1506/2016 Figure 2. SEM image of transient-tested oxide fuel. The separation of grain
LP2.A.3_a 22 CERSE-POLIMI RL 1506/2016 1.3 Fission gas behavior model
This Section presents the developed burst release model. In Section 1.3.1, the purely diffusion-based model (Luzzi et al., 2013; Pastore et al., 2013; Pastore et al., 2015) for coupled fission gas release and gaseous fuel swelling is described. Section 1.3.2 presents the extension of the diffusion-based model, accounting for the transient fission gas behavior (Pastore et al., 2014; Pizzocri et al., 2015).
1.3.1 Diffusion-based model
The fission gas transport towards grain boundaries is accounted solving numerically the diffusion equation in one-dimension spherical geometry, assuming spherical grains:
𝜕𝐶𝑖𝑔
𝜕𝑡 =
b
b + gDig∇2𝐶𝑖𝑔+ β (1)
where 𝐶𝑖𝑔 (at m-3) is the intra-granular gas concentration (both as single atoms and gas in bubbles), 𝑡 (s) the time, g (s-1) the rate of gas atoms trapping into intra-granular bubbles, b (s-1
) the rate of gas atom re-solution from bubbles back into the lattice, Dig (m2 s-1) the intra-granular gas atom diffusion coefficient, and β (at m-3 s-1) the gas generation rate. The term b+gb Dig represents the effective intra-granular diffusion coefficient according to Speight (1969).
The grain-boundary gas behavior entails a physics-based treatment of both fission gas swelling and release, whose main features are:
Assuming the absorption rate at the grain-face bubbles be equal to the arrival rate of gas at the grain boundaries (Olander, 1976; White, 2004, Van Uffelen et al., 2010).
Neglecting the nucleation of grain-face bubbles during irradiation (White, 2004).
Considering equal-size lenticular grain-face bubbles (semi-dihedral angle of 50°) (White and Tucker, 1983).
LP2.A.3_a 23 CERSE-POLIMI RL 1506/2016
Accounting for grain-face bubbles growth (or shrinkage) through the inflow of gas atoms and concomitant absorption (or emission) of vacancies from grain boundaries.
The gas atom inflow rate is obtained solving Eq. 1, while the absorption/emission rate of vacancies at the bubbles is calculated using the model of Speight and Beere (1975).
Grain-face bubble coalescence is considered through an improved model of White (White, 2004; Pastore et al., 2013). The variation rate of the bubble number density, Ngf (m-2), due to coalescence, is calculated as a function of the variation rate of the bubble projected area on the grain face, Agf (m2). The total volume of the lenticular grain-face bubbles represents the grain-boundary contribution to fission gas swelling (Massih and Forsberg, 2008).
The fission gas release in this model is considered as a consequence of bubble interconnection, which leads to a saturation of the grain faces. In fact, when the fractional coverage, 𝐹 = 𝑁𝑔𝑓𝐴𝑔𝑓 (/), attains a constant saturation value, 𝐹𝑠𝑎𝑡, gas release from the grain faces compensates further bubble growth, in order to satisfy the saturation coverage condition:
d𝐹
d𝑡 = 0 if 𝐹 = 𝐹𝑠𝑎𝑡 (2)
In this model, fission gas swelling and release are described as inherently coupled. The constant saturation coverage, 𝐹𝑠𝑎𝑡, value is equal to 0.5 (White, 2004; Pastore et al., 2013).
This representation allows reproducing the incubation behavior of fission gas release and the coupling with grain-boundary swelling as well.
1.3.2 Burst release model
The general diffusion-based model outlined in Section 1.3.1 has been extended (Pastore et al., 2014; Pizzocri et al., 2015) to introduce the effect of grain boundary micro-cracking on the loss of gas inventory and storing capacity.
Gas depletion of a fraction of the grain faces is modelled as a reduction of the fractional coverage, 𝐹, which is scaled by a factor, 𝑓 (/), corresponding to the fraction of non-cracked grain faces. The
LP2.A.3_a 24 CERSE-POLIMI RL 1506/2016
reduction of the fractional coverage effectively leads to a decrease of the amount of gas retained in the fuel (and, as a consequence, of fission gas swelling) and to a corresponding increase of fission gas release. This contribution to fission gas release adds to the diffusion-interconnection mechanism considered in the model outlined in the previous Section.
In detail, the lost gas-storing capacity of cracked grain faces is accounted by scaling the saturation coverage, 𝐹𝑠𝑎𝑡, by the factor 𝑓. Eventually, a healing process of cracked grain faces is considered as a progressive restoration of the grain-face gas-storing capacity.
Hence, the fractional coverage and the saturation coverage obey the following relationships:
{ d𝐹 d𝑡 = [ d𝐹 d𝑡]d+ 𝐹 [ d𝑓 d𝑡]c d𝐹𝑠𝑎𝑡 d𝑡 = 𝐹𝑠𝑎𝑡([ d𝑓 d𝑡]c + [ d𝑓 d𝑡]h) (3)
where the subscript 𝑑 stands for diffusion-controlled processes (Section 1.3.1), 𝑐 for micro-cracking, and ℎ for micro-crack healing. The initial (maximum) value for the saturation coverage, corresponding to all intact grain-faces, is 𝐹𝑠𝑎𝑡,𝑖 = 0.5.
From the experimental evidence presented in Section 1.2, the following main aspects of transient fission gas behavior emerge:
Transient release occurs through micro-cracking which entails gas depletion of a fraction of grain faces.
Transient release is triggered by temperature variations.
The rate of transient release presents a maximum around a certain temperature (central temperature), which depends on the local burnup.
The reduction rate due to micro-cracking of the fraction of intact grain faces 𝑓, i.e. [d𝑓 d𝑡⁄ ]c, is expressed as a function of a micro-cracking parameter, 𝑚
LP2.A.3_a 25 CERSE-POLIMI RL 1506/2016
[d𝑓
d𝑡]c = − d𝑚
d𝑡 𝑓 (4)
which depends on temperature and burnup. In particular, the temperature dependence respects the experimentally observed characteristic of burst release to be triggered by temperature variations (Rothwell, 1962; Baker and Killeen, 1987; Small, 1988; Une and Kashibe, 1990; Ducros et al., 2013), i.e.
[d𝑓
d𝑡]c = 0 if d𝑇
d𝑡 = 0 (5)
Under the condition expressed by Eq. 5 and considering the initial conditions 𝑓(𝑡0) = 𝑓0 and 𝑚(𝑡0) = 𝑚0, the analytic solution of Eq. 4 yields
𝑓(𝑡) = 𝑓0 exp(−(𝑚(𝑡) − 𝑚0)) (6)
The functional form of 𝑚 (-) is a temperature- and burnup-dependent sigmoid function 𝑚(𝑇, 𝑏𝑢) = 1 − [1 + 𝑄 exp (𝑠𝑇−𝑇𝑐𝑒𝑛𝑡(𝑏𝑢)
𝐵 )] −𝑄1
(7) where 𝑇𝑐𝑒𝑛𝑡 (K) is the central temperature, 𝐵 (K) is a measure of the temperature-domain width of the phenomenon, 𝑄 (-) is an empirical parameter, and 𝑠 (-) is set to +1 during heating transients and to −1 during cooling transients, so that m increases during both heating and cooling transients. Based on several semi-qualitative experimental observations, the chosen value for 𝐵 and 𝑄 are 𝐵 = 10 K and 𝑄 = 33, respectively (Pastore et al., 2014; Pizzocri et al., 2015).
LP2.A.3_a 26 CERSE-POLIMI RL 1506/2016
𝑇𝑐𝑒𝑛𝑡(𝑏𝑢) = 𝛼 + 𝛽 exp (−𝑏𝑢𝛾 ) (8)
where 𝑏𝑢 (GWd tU-1) is the average burnup, 𝛼 = 1773 K, 𝛽 = 520 K, and 𝛾 = 10 GWd tU-1. This expression is derived from the best-estimate fit of quantitative experimental data (Fig. 3a). The micro-cracking parameter, 𝑚, and its derivative, d𝑚 d𝑇⁄ , are reported in Fig. 3b. The inflection point at the central temperature allows for the maximum rate of burst release to occur at the central temperature. The asymmetry around the inflection point is justified, since experimental observations indicate that burst release during heating transients is higher in the temperature region above the central temperature than below, and conversely (Rothwell, 1962).
In the model, the effects of the micro-cracks healing are also considered. The variation rate due to micro-crack healing in Eq. 3 of the fraction of cracked grain faces, i.e. [d𝑓 d𝑡⁄ ]h, is governed by a healing parameter, 𝑢 (-)
Figure 3. (a) Experimental data of the maximum burst release temperature, Tcent, as a function of burnup and
best-estimate fitting curve. (b) Micro-cracking parameter, 𝑚, and its derivative d𝑚 d𝑇⁄ , as a function of temperature. The asymptotic value of central temperature is fixed at 1773 K (i.e., burnup above 50 GWd tU-1).
LP2.A.3_a 27 CERSE-POLIMI RL 1506/2016
[d𝑓 d𝑡]h =
d𝑢
d𝑡(1 − 𝑓) (9)
The healing parameter is taken as a function of burnup, i.e., 𝑢 = 𝑢(𝑏𝑢(𝑡)), where 𝑏𝑢 is the burnup. Considering the initial conditions 𝑓(𝑡0) = 𝑓0 and 𝑢(𝑡0) = 𝑢0, the solution of Eq. 9 is
𝑓(𝑡) = 𝑓0 + (1 − 𝑓0)[1 − exp(𝑢(𝑡) − 𝑢0)] (10)
The functional form of the healing parameter is
𝑢(𝑏𝑢) = 𝑏𝑢 𝜏⁄ (11)
where 𝜏 = 1 GWd tU-1 according to Hering (1982) and Pizzocri et al. (2015).
The treatment of burst release as here presented conforms to the experimentally observed peculiarities of transient fission gas release, guaranteeing the continuity of the fission gas behavior model described in Section 1.3.1 in both time and space, without introducing any discrete thresholds, in line with a physically sound description of fission gas behavior.
1.4 Validation results
We validated the FGB model presented in Section 1.3 against 50 irradiation experiments from the OECD/NEA IFPE database (Sartori et al., 2010). The power histories of the selected experiments are constituted of a base irradiation performed in normal operation followed by a ramp test at high power. Some of these experiments were included in the IAEA Coordinated Research Projects FUMEX-II (2012) and FUMEX-III (2013). We carried out the TRANSURANUS simulations coherently with the pre-irradiation characterization data, power histories and coolant conditions provided in the IFPE database. In Fig. 4, we present a summary of the experiments considered in this work.
In a limited number of the irradiation experiments considered (AN3, AN4, II3, and IFA 597.3) the FGR was measured directly on-line during the ramp test (through a pressure transducer installed in the rod plenum) and during the Post-Irradiation Examination (PIE) as well. For all the other
LP2.A.3_a 28 CERSE-POLIMI RL 1506/2016
irradiation experiments, only the PIE measurements are available. Thus, for coherence, we always considered the PIE measurements when referring to the final value of the measured integral FGR. The on-line measurement of FGR, when available, provides valuable information about the kinetics of FGR during the ramp test.
LP2.A.3_a 29 CERSE-POLIMI RL 1506/2016 Figure 4. Summary of the experiments considered in this work from the OECD/NEA IFPE database. In particular, experiments 1–18 are from the Super-Ramp PWR program, 19–25 are from the Super-Ramp BWR program, 26–36 are from the Inter-Ramp BWR program, 37–48 are from the Risø-3 program, 49 is from the REGATE program, and 50 is IFA 597.3.
Figure 5 presents the overall results of the validation performed with the TRANSURANUS fuel performance code. In the Figure, we show the results obtained with the sole diffusion-based model (Section 1.3.1) and those obtained considering the burst release model (Section 1.3.2). The distance from the 45° line is a measure of the accuracy of the predictions. The figure shows an improvement of the TRANSURANUS FGR predictions when the burst release model is considered, and a
LP2.A.3_a 30 CERSE-POLIMI RL 1506/2016
satisfactory agreement between the predictions and the experimental data, in line with the intrinsic FGR modeling uncertainties (Pastore et al., 2015).
In Fig. 6, we report the FGR during the AN3 ramp test calculated with the TRANSURANUS fuel performance code. The prediction is significantly improved, in terms of integral result and kinetics, with the introduction of the burst release model. In particular, the burst release model allows reproducing the stepwise releases occurring at 48 and 72 hours from the beginning of the test. However, the magnitude of the recorded and calculated release during those temperature transients is different, with an under-prediction being observed. Indeed, part of the rapid increase in the recording of the inner pressure during power reductions has been ascribed to gap and cracks reopening, which triggers a delayed detection of the gas released before the power reduction (Cayet, 1996). Such hypothesis may partly explain the discrepancies, but the reopening effect cannot represent the only contribution to the recorded FGR increase, because similar increases have been observed in cooling annealing experiments, in which no cladding was present (Rothwell, 1962; Nakamura et al., 1999).
LP2.A.3_a 31 CERSE-POLIMI RL 1506/2016 Figure 5. Summary of the validation results of the burst release model in TRANSURANUS against fifty experiments from the IFPE database. Each point corresponds to a simulation. The distance of each point from the 45° line is a measure of the accuracy. The reported uncertainty bands are in agreement with Pastore et al. (2015).
LP2.A.3_a 32 CERSE-POLIMI RL 1506/2016 Figure 6. FGR and fuel central temperature as a function of time for the AN3 rod during the ramp test. Comparison between the results calculated with TRANSURANUS and the experimental data, with (w/) and without (w/o) the burst release model.
LP2.A.3_a 33 CERSE-POLIMI RL 1506/2016
2. Modeling of intra-granular fission gas behavior during transients
In this Section, a new numerical algorithm (PolyPole-1) is presented. It has been specifically developed to efficiently solve the fission gas diffusion equation in time-varying conditions. The results of a numerical experiment, performed to verify the PolyPole-1 solution and to compare the solution accuracy to other state-of the-art algorithms currently used in fuel performance codes, are also reported.
2.1 General considerations
During irradiation of nuclear fuel in the reactor, various isotopes of the noble gases xenon and krypton are directly created inside the fuel grains by fission, but may also originate from decay processes. Fission gas atoms can diffuse to the grain boundaries where they precipitate into inter-granular bubbles contributing to fuel swelling. A fraction of the gas that reaches the grain boundaries can eventually be released to the fuel rod free volume through linkage of the inter-granular bubbles (Olander, 1976; Matzke, 1980; White and Tucker, 1983; White, 2004; Van Uffelen et al., 2010; Pastore et al., 2013).
Hence, the first and basic step of FGR and gaseous swelling is gas atom transport to the grain boundaries. It follows that modeling of this process is a fundamental component of any fission gas behavior model in a fuel performance code. Intra-granular fission gas transport occurs by thermal and enhanced diffusion of single gas atoms, coupled to trapping in and irradiation-induced re-solution from intra-granular bubbles. Diffusion of intra-granular bubbles becomes relevant at high temperatures, above ~1800°C (Matzke, 1980; Lösönen, 2000b). Thus, modeling the process of gas transport to the grain boundaries calls for the treatment of different concomitant processes, namely, diffusion coupled with trapping and re-solution of gas atoms. Extensive literature deals with the evaluation of the parameters characterizing these mechanisms, both
LP2.A.3_a 34 CERSE-POLIMI RL 1506/2016
experimental and theoretical work (e.g., Ham, 1958; Nelson, 1969; Turnbull, 1971; Matzke, 1980; Turnbull et al., 1982; White and Tucker, 1983; Lösönen, 2002; Govers et al., 2008; Parfitt and Grimes, 2009; Schwen et al., 2009; Andersson et al., 2014). Rather, in this work we deal with the numerical problem associated with the computational solution of the equations describing the process. Clearly, this problem has an enormous practical importance for fission gas behavior calculations in fuel performance analysis.
Speight (1969) proposed a simplified mathematical description of intra-granular fission gas release. He lumped the trapping and re-solution rates into an effective diffusion coefficient, restating the mathematical problem as purely diffusive. Such simplification implies the assumption of equilibrium between trapping and re-solution (quasi-stationary approach). To the best of our knowledge, the formulation of Speight is universally adopted for models employed in fuel performance codes (e.g., Rashid et al., 2004; Suzuki et al., 2013; Lassmann et al., 2014; Hales et al., 2014; Geelhood et al., 2015). In addition, the assumption of spherical grain geometry (Booth, 1957) is applied. The solution of the diffusion equation for constant conditions is well known. Nevertheless, time-varying conditions are involved in realistic problems. Therefore, the solution for time-varying conditions is the issue of interest for applications to fuel performance analysis, which calls for the development of dedicated numerical algorithms. Given the very high number of calls of each local model (such as the fission gas behavior model) in a fuel performance code during the analysis of a detailed fuel rod irradiation history, in addition to the requirement of suitable accuracy for the numerical solution, there is a requirement of low computational cost. Clearly, the numerical solution of the diffusion equation in time-varying conditions may be obtained using a spatial discretization method such as a finite difference scheme. However, the high associated computational effort can make a space-discretization based solution impractical for application in fuel performance codes. Several alternative algorithms that provide approximate solutions at high speed of computation and can be used in fuel performance codes have been developed (Matthews and Wood, 1980; Väth, 1981; Forsberg and Massih, 1985; Elton and Lassmann, 1987; Lassmann and Benk, 2000; Lösönen, 2000a; Hermansonn and Massih, 2002; Cheon et al., 2006). In this work,
LP2.A.3_a 35 CERSE-POLIMI RL 1506/2016
we propose a new numerical algorithm for the accurate and fast solution of the diffusion equation in time-varying conditions, which we call PolyPole-1.
2.2 Mathematical problem
The problem of gas atom diffusion during bubble trapping and resolution can be stated mathematically with a single diffusion equation for the total concentration of gas in the grain 𝑐𝑡 (at m-3) 2 eff β D t t c c t (12)
The effective diffusion coefficient Deff (m2 s-1) accounts for the reduced diffusion rate of single gas atoms due to the trapping and resolution effects in presence of immobile intra-granular bubbles, whereas β (at m-3
s-1) is the source term of fission gas atoms.
The analytic solution of Eq. 12 for constant conditions (constant and Deff) in spherical grain geometry is well known (e.g., Lassmann and Benk, 2000). For the purpose of modeling intra-granular fission gas release, we focus on the spatial average in the grain of the total gas concentration, c t . A perfect sink boundary condition at the grain boundary, with a (m) being the t
radius of the spherical grain, and initial condition ct
0 c0 are considered. The analytic expression of c t for constant conditions is obtained by integrating the solution of Eq. 12, over the spherical t
domain, and reads
2 eff 2 2 4 1 4 eff 2 2 eff 2 2 2 1 2 0 D exp 1 90 1 D 15 β D exp 1 6 a t n n a a t n n c t c n n t (13)LP2.A.3_a 36 CERSE-POLIMI RL 1506/2016
This solution, however, is not directly applicable to realistic problems, for which time-varying conditions need to be considered. Therefore, the mathematical problem of intra-granular fission gas release of interest for fuel performance analysis and considered in the present work is
2 eff β D t t c t t c t (14)with Dirichlet boundary condition c a tt
, 0 and the symmetry condition
0
/ 0
t
c r
. Eq. 14 needs to be solved numerically with dedicated algorithms. In the following, we present the recently developed PolyPole-1 algorithm.
LP2.A.3_a 37 CERSE-POLIMI RL 1506/2016 2.3 PolyPole-1 algorithm development
In this Section, we present the new numerical algorithm developed for the solution of Eq. 14 in fuel performance codes (e.g.,TRANSURANUS), called PolyPole-1. The objective of the PolyPole-1 development is the obtainment of improved accuracy and similar computational cost relative to state-of-the-art algorithms, such as URGAS (Lassmann and Benk, 2000) and FORMAS (Hermansonn and Massih, 2002).
Applying a modal expansion, we write the sought approximated solution of Eq. 14 in the form
* * 1 , t n n n c r t z t r
(15)where z t are the time coefficients and *n
n
r are the spatial modes. The time coefficients contain the information about the time dependency of the approximated solution (i.e., the characteristic poles of the system). The spatial modes are the same of the analytic solution for constant conditions (see the Appendix in Pizzocri et al., 2016a for a full derivation) and are the orthonormal eigenfunctions of the radial part of the spherical Laplacian (i.e., normalized cardinal sins, with the ansatz that they are basis for the solution).The other fundamental assumption of the proposed method is that the time coefficients, z t , may *n
be expressed as the time coefficients of the analytic solution for constant conditions, z t , n
multiplied by an appropriate polynomial factor. Thus, we write
*
1 1 1,
n i n i J i
z t z t P t dt (16)
LP2.A.3_a 38 CERSE-POLIMI RL 1506/2016
1 j J
J j J
P a dt a dt (17)
The time dependency of the diffusion coefficient and of the source term is thus addressed by the polynomial factor. To calculate the coefficients aj of P tJ
i1 , J equations are needed. This set of equations is obtained by sampling the time-varying parameters, Deff
t and β t , at
J uniformly distributed instants along the time-step dt. The sets of sampled values, Deff
j and β j , contain
the information on the variation of the parameters along the time step and are used to calculate the corrective polynomial, as follows.The time coefficients defined by Eq. 16 approximately satisfy the governing equation at the sampling times t j ,
ti t j
ti1
* * β n n n n t j z j j z t j t (18)
( ) β n J n n n J t j z P j j z t j P t j t (19)with βn
j n β
j and
n
j Deff
j n
2
2 /a2. Eq. 19 defines a linear system of Jequations for the polynomial coefficients, aj, and is used to determine the polynomial, P tJ
i1 . The PolyPole-1 solution is then reconstructed as a linear combination of the spatial modes with the corrected time coefficients using Eq. 15. The series is approximated by a finite number of terms (number of modes), which is determined on the basis of the D’Alembert remainder criterion, bounded by an a priori limiting value.LP2.A.3_a 39 CERSE-POLIMI RL 1506/2016
The newly developed PolyPole-1 algorithm thus combines the physical poles of the analytic solution with a corrective polynomial to account for the time dependency of the coefficients. In short, the idea behind the PolyPole-1 approach is that the spatial dependency of the solution for time-varying conditions can be approximated by the spatial dependency of the solution for constant conditions, which is known analytically. The deviation from constant conditions is fully embodied in the time-dependent part of the solution and approximated by the time coefficients of the solution for constant conditions multiplied by an appropriate correction. Exploiting an analytic representation of the spatial dependency avoids using spatial discretization and is therefore expected to allow for significantly lower computational time compared to spatial discretization methods. In view of this concept, the algorithm may be labeled as semi-analytic, as opposed to spatial discretization methods such as finite difference schemes. The URGAS and FORMAS algorithms may also be considered as semi-analytic methods.
2.4 PolyPole-1 algorithm verification
In this Section, we present the numerical experiment aimed at (i) verifying the PolyPole-1 solution and (ii) comparing the accuracy of the PolyPole-1 solution to other state-of-the-art algorithms currently used in fuel performance codes.
The numerical experiment is applied to three semi-analytic algorithms for the solution of Eq. 14, namely: (1) URGAS (Lassmann and Benk, 2000), (2) FORMAS1 (Hermansonn and Massih, 2002), and (3) PolyPole-12. The numerical experiment consists of application of each algorithm to the numerical solution of Eq. 14 for 1000 randomly generated operation histories. Results from the
1 Among the various versions of the FORMAS algorithm, we use the FORMAS algorithm from Hermansonn and
Massih (2002).
2
For this numerical experiment, we consider a second-order corrective polynomial (Eq. 17) and a 10-7 limiting value for the D’Alembert remainder.
LP2.A.3_a 40 CERSE-POLIMI RL 1506/2016
three semi-analytic algorithms are compared to a reference finite difference solution (Pizzocri et al., 2016a).
The considered operation histories are in terms of temperature and fission rate, from which the time-dependent parameters of Eq. 14, i.e., Deff
t and β t , are calculated
3 and applied to the numerical algorithms by the program. The figure of merit for testing and comparing the algorithms is the fractional intra-granular fission gas release at the end of the considered operation history, defined as
end created end t end created t c t c t c f : (20)where ccreated (at m-3) is the concentration of gas created (i.e., the time integral of β t ) and
tend (s) is the final time of the operation history. The randomly generated operation histories have the following characteristics: Each individual history is piecewise-linear with varying temperature and fission rate.
In each individual history, the following quantities are considered as random variables: - number of linear steps (1–11);
- time duration of each linear step (0–100 hours); - temperature (500–2000 K);
3 The temperature- and fission rate dependent diffusion coefficient from Turnbull et al. (1982) is used as
effD t .
β t is calculated as the fission rate times the yield of fission gas atoms (~0.3). For the purpose of this numerical experiment, as long as dependencies are realistic, the specific choices are arbitrary.
LP2.A.3_a 41 CERSE-POLIMI RL 1506/2016
- fission rate (0–3·1019
fiss m-3 s-1).
With these principles, the numerical experiment approximately covers the whole range of intra-granular fission gas release (0 ≤ f ≤ 1).
To investigate the accuracy of the three semi-analytic algorithms, Fig. 7 shows the relative error of the solution obtained with each algorithm with respect to the finite difference reference solution. The efficiency and accuracy of the URGAS and FORMAS algorithms were previously analyzed by Lassmann and Benk (2000). Although a more recent version of FORMAS is considered here, the results in Fig. 7 are consistent with the conclusions of Lassmann and Benk (2000) that: (i) the FORMAS algorithm is superior to the URGAS algorithm at fission gas release above f ≈ 0.05; and (ii) the FORMAS algorithm presents a deficiency for low values of f, which is ascribed to an approximation involved in the method. Although both algorithms were evaluated as sufficient to be used in a fuel performance code, drawbacks were attributed to each of them in line with the conclusions above. Choice of one of the two algorithms based on the specific applications was recommended. The results in Fig. 7 indicate that the PolyPole-1 algorithm represents a significant path forward in this respect. First, it is evident that the overall accuracy of PolyPole-1 is vastly superior to both FORMAS and URGAS.
The relative error associated with PolyPole-1 is highly consistent over the whole range of intra-granular fission gas release. This also confirms practically the theoretical considerations on the inherent capability of PolyPole-1 to allow for a more consistent level of accuracy over different conditions through automatic adaptation of the number of considered series terms.
LP2.A.3_a 42 CERSE-POLIMI RL 1506/2016 Figure 7. Comparison between the URGAS, FORMAS and PolyPole-1 algorithms in terms of relative error with respect to the reference finite difference algorithm. Each data point corresponds to a calculation with randomly generated conditions.
Besides accuracy, speed of computation is an essential feature for an algorithm to be effectively employed in a fuel performance code. The computational time (i.e., the time took for the analysis of a single operation history) for the three semi-analytic algorithms and all histories considered in the numerical experiment is illustrated in Fig. 8. PolyPole-1 requires a computational time similar to the other algorithms, which are successfully used in fuel performance codes. Such efficiency of computation, combined with the demonstrated accuracy, makes PolyPole-1 suitable for implementation in any fuel performance code. The computational time for the finite difference solution is also shown. Clearly, if a spatial discretization method such as a finite difference method
LP2.A.3_a 43 CERSE-POLIMI RL 1506/2016
is used to solve the intra-granular fission gas release problem in a fuel performance code, the associated higher computational time can result in significantly decreased speed of computation of fuel rod analysis, even with modern computational resources. This highlights the value of developing numerical algorithms that allow for a faster computation while preserving accuracy, such as PolyPole-1.
Figure 8. Comparison between the computational times associated with the finite difference, URGAS, FORMAS and PolyPole-1 algorithms. Each data point corresponds to a calculation with randomly generated conditions.
LP2.A.3_a 44 CERSE-POLIMI RL 1506/2016
LP2.A.3_a 45 CERSE-POLIMI RL 1506/2016
3. Preliminary modeling of high burnup structure fission gas
behavior during transients
This Section describes a new semi-empirical model for High Burnup Structure (HBS), which embraces the polygonisation/recrystallization process and the depletion of intra-granular fission gas, describing them as inherently related.
3.1 General considerations
In the rim zone of UO2 nuclear fuel pellets, the combination of high local burnup (>50-60 GWd/tU, i.e., high radiation damage and high fission product concentration) and low temperature (<1000°C, i.e., limited thermal recovery of the radiation damage) drives a microstructural change, leading to the formation of the HBS. This process always includes four characteristic phenomena (Cunningham et al., 1992; Walker et al., 1992; Kinoshita et al., 1998; Baron et al., 2009; Rondinella and Wiss, 2010): (i) pile-up of dislocations forming an entangled network, (ii) the polygonisation/recrystallization of the original micrometric grains into sub-micrometric grains free of extended defects (Ray et al., 1997; Sonoda et al., 2002; Spino et al., 2006), (iii) the decrease of the intra-granular fission gas concentration (depletion, Walker, 1999), and (iv) the formation of a novel population of inter-granular spherical bubbles (Spino et al., 1996). These processes are not strictly sequential, but may be thought as (partially) concomitant.
The proper modeling of the formation and evolution of the HBS is a critical aspect of nuclear fuel performance analysis. The increase of porosity characteristic of the HBS formation contributes to decrease both thermal conductivity and elastic modulus, thus affecting the fuel rod thermo-mechanical performance. This, in turn, represents a potential concern for the safe operation of nuclear fuel to extended burnup, especially under design basis accident conditions.
LP2.A.3_a 46 CERSE-POLIMI RL 1506/2016
Several semi-empirical models describing the formation and the evolution of the HBS are available in fuel performance codes (Lassmann et al., 1995; Khvostov et al., 2005; Lemes et al., 2015). In addition, Veshchunov and Shestak (2009) provided a mechanistic model for the evolution of dislocations under irradiation up to high burnups. This model allows for a mechanistic interpretation of the temperature and burnup conditions under which the high burnup structure develops. Nevertheless, with the exclusion of the latter model, these models do not allow for the physical coupling between the phenomena occurring during the restructuring (i-iv).
3.2 Modeling
In this work, we present a model based on new measurements of average grain size performed at JRC-Karlsruhe (Pizzocri et al., 2016b), which consistently couples the reduction of the average grain size (i-ii) with a simultaneous depletion of intra-granular fission gas driven by diffusion (iii). The model is also applicable to fuel performance codes.
The grain-size experimental data reported in Pizzocri et al. (2016b), together with data from Ray et al. (1997) and Spino et al. (2006), are used to derive an empirical relation between the fuel grain radius and the local effective burnup (defined as in Holt et al., 2014):
d𝑎 d𝑏𝑢eff = − 1 𝜏(𝑎 − 𝑎∞) IC 𝑎(𝑏𝑢eff,0) = 𝑎0 (21)
where 𝑎 (μm) is the 3D-equivalent spherical grain radius, 𝑏𝑢eff (GWd/tU) is the local effective burnup, and 𝜏 = 7.0 GWd/tU and 𝑎∞= 0.15 μm are determined by least-square method data fitting. The initial condition given at 𝑏𝑢eff,0 = 50 GWd/tU (Holt et al., 2014) accounts for the effect of the initial grain-size 𝑎0 (μm) on the formation of the high burnup structure (Noirot et al., 2015). The thermal grain growth model is effectively switched-off when bueff > bueff,0 under normal operating conditions.
LP2.A.3_a 47 CERSE-POLIMI RL 1506/2016 3.2.2. Fission gas diffusion
In fuel performance codes, intra-granular fission gas diffusion is usually modelled via an effective diffusion equation solved in the equivalent spherical domain (Lassmann and Benk, 2000; Lösönen, 2000b).
For the purpose of modeling the fission gas behavior in the high burnup structure, the present model also applies diffusion theory for a spherical grain. We adopt a relative radial coordinate, 𝜌 = 𝑟 𝑎⁄ , instead of the dimensional radial coordinate 𝑟 (μm). Accordingly, the perfect sink boundary conditions (BC) is expressed at 𝜌 = 1, rather than at 𝑟 = 𝑎(𝑏𝑢eff,0). In addition, the time coordinate is represented by the effective burnup. Therefore, we write the fission gas diffusion equation in the spherical grain as
d𝑐 d𝑏𝑢eff = D 𝑎2 1 𝜌2 𝜕 𝜕𝜌𝜌2 𝜕 𝜕𝜌𝑐 + 𝑦F IC 𝑐(𝜌, 𝑏𝑢eff,0) = 𝑐0(𝜌) BC 𝑐(1, 𝑏𝑢eff) = 0 [𝜕𝑐 𝜕𝜌⁄ ]0 = 0 (22)
where 𝑐 (wt.%) is the intra-granular fission gas concentration, D (μm2 GWd/tU -1) is the effective diffusion coefficient, 𝑦 (wt.% fiss-1) is the fission yield, and F (fiss GWd/tU -1
) is the fission rate. Brémier and Walker (2002) discussed the applicability of single gas atom diffusion coefficients in the HBS zone (e.g., Matzke, 1980; Turnbull et al., 1982). They also considered the possibility of including fission gas trapping into and re-solution from intra-granular bubbles as lumped in the diffusion coefficient (i.e., using an effective diffusion coefficient, Speight, 1969).
Considering the very limited knowledge available about intra-granular fission gas behavior in the HBS, we choose a simple a-thermal diffusion coefficient in agreement with Brémier and Walker (2002), namely D = 7.8 10−3 F.
LP2.A.3_a 48 CERSE-POLIMI RL 1506/2016 3.2.3 Xenon depletion
Combining Eqs. 21 and 22 leads to a model for the coupled grain size evolution and depletion of intra-granular fission gas (xenon) in the HBS. In this model, gas depletion results from the reduction of grain radius with increasing burnup (Eq. 21) as the diffusion rate 𝐷/𝑎2 (Eq. 22) correspondingly increases.
In Fig. 9 (taken from Pizzocri et al., 2016b), the intra-granular concentration of xenon calculated with the present model is compared to the EPMA data discussed by Walker (1999). Considering the uncertainties in both the experimental data (obtained from 38 different UO2 fuel samples, with different irradiation histories) and in the model parameters, the agreement appears to be satisfactory. For comparison, also the results of the model by Lassmann et al. (1995) are shown. Figure 9 also shows the impact of the initial grain size. If higher initial grain radii are considered, the model predicts a delayed depletion of the intra-granular xenon, thus a delayed formation of the HBS. This trend is coherent with the one experimentally observed by Noirot et al. (2015).
These results indicate that gas depletion in the HBS can be described by diffusion theory as grain size decreases during recrystallization/polygonisation. In a semi-empirical approach, the present model combines an empirical relation for grain size evolution to physics-based calculation of diffusion.
LP2.A.3_a 49 CERSE-POLIMI RL 1506/2016 Figure 9. Comparison of the intra-granular xenon concentration measured by EPMA (Walker, 1999) on several samples with the calculation of the present model, as a function of local effective burnup. The impact of assuming a different initial grain radius, 𝑎0, is also shown, with bigger radii delaying the xenon
LP2.A.3_a 50 CERSE-POLIMI RL 1506/2016
LP2.A.3_a 51 CERSE-POLIMI RL 1506/2016
Conclusion and future work
Preliminary analyses performed with the TRANSURANUS fuel pin performance code pointed out the need to improve its capabilities of fission gas behavior modeling for FR fuel. This need is of particular relevance for the safety analysis of liquid-metal-cooled FRs, such as the ALFRED lead-cooled reactor.
In this work, we pursued a threefold objective:
1. The development of a new model for the transient fission gas release from the grain boundaries. The model describes the micro-cracking of the grain boundaries induced by temperature variations as the physical phenomenon underlying the rapid release of fission gas during transients. This model has been implemented in the TRANSURANUS code. Validation against a huge number of integral experiments highlighted the capabilities of the model to quantitatively improve TRANSURANUS integral fission gas release predictions and improve its representation of FGR kinetics as well.
2. The development of a new algorithm (PolyPole-1) for the solution of the intra-granular diffusion equation in time-varying conditions. The verification of this algorithm demonstrated its improved accuracy with respect to state-of-the-art algorithms used in fuel performance codes, with comparable computational requirements.
3. The development of a preliminary model for the formation of the high burnup structure and the coupled depletion of intra-granular fission gas.
In perspective, these three developments combined lay the foundation for a complete model describing the fission gas behavior in FR fuel. The further development of this model, its implementation in the TRANSURANUS code and its extensive validation are going to be addressed in future projects.
LP2.A.3_a 52 CERSE-POLIMI RL 1506/2016
LP2.A.3_a 53 CERSE-POLIMI RL 1506/2016
References
Aly, A., Rozzia, D., Del Nevo, A., Luzzi, L., and Pizzocri, D., 2015. Supporto alla progettazione del combustibile nucleare per Il reattore LFR. Technical Report RdS/PAR2014/194. Available from:
http://www.enea.it/it/Ricerca_sviluppo/documenti/ricerca-di-sistema-elettrico/nucleare-iv-gen/2014/rds-par2014-194.pdf.
Andersson, D.A., Garcia, P., Liu, X.-Y., Pastore, G., Tonks, M., Millett, P., Dorado, B., Gaston, D.R., Andrs, D., Williamson, R.L., Martineau, R.C., Uberuaga, B.P., and Stanek. C.R., 2014. Atomistic modeling of intrinsic and radiation-enhanced fission gas (Xe) diffusion in UO2±x: Implications for nuclear fuel performance modeling. Journal of Nuclear Materials, 451, 225-242. Baker, C., and Killeen, J.C., 1987. Fission Gas Release during Post Irradiation Annealing of UO2. International Conference on Materials for nuclear reactor core applications, BNES, 1, 153-159, Bristol, United Kingdom, October 27-29.
Baron, D., Kinoshita, M., Thevenin, P., and Largenton, R., 2009. Discussion about HBS transformation in high burn-up fuels. Nuclear Engineering and Technology, 41, 199–214.
Booth, A.H., 1957. A Method of Calculating Fission Gas Diffusion from UO2 Fuel and its Application to the X-2-f LOOP TEST. Tech. Report CRDC 721, Atomic Energy of Canada Limited.
Brémier, S., and Walker, C.T., 2002. Radiation-enhanced diffusion and fission gas release from recrystallised grains in high burn-up UO2 nuclear fuel. Radiation Effects and Defects in Solids, 157, 311–322.
Carroll, R.M, Morgan, J.G., Perez, R.B., and Sisman, O, 1969. Fission Density, Burnup, and Temperature Effects on Fission Gas Release from UO2. Nuclear Science and Engineering, 38, 143– 155.
LP2.A.3_a 54 CERSE-POLIMI RL 1506/2016
Cayet, N., 1996. Investigation of Delayed Fission Gas Release. Technical Report HWR 488, OECD Halden Reactor Project.
Cheon, J.S., Koo, Y.-H., Lee, B.-H., Oh, J.-Y., and Sohn, D.-S, 2006. A two-zone method with an enhanced accuracy for a numerical solution of the diffusion equation. Journal of Nuclear Materials, 359, 139-149.
Cunningham, M.E., Freshley, M.D., and Lanning, D.D., 1992. Development and characteristics of the rim region in high burnup UO2 fuel pellets. Journal of Nuclear Materials, 188, 19–27.
Ducros, G., Pontillon, Y., and Malgouyres, P.P., 2013. Synthesis of the VERCORS Experimental Program: Separate-Effect Experiments on Fission Product Release, in support of the PHEBUS-FP Programme. Annals of Nuclear Energy, 61, 75–87.
Elton, P.T., and Lassmann, K., 1987. Calculational methods for diffusional gas release. Nuclear Engineering and Design, 101, 259-265.
Forsberg, K., and Massih, A.R., 1985. Diffusion theory of fission gas migration in irradiated nuclear fuel UO2. Journal of Nuclear Materials, 135, 140-148.
FUMEX-II, 2012. Fuel Modelling at Extended Burnup. Technical Report IAEA-TECDOC-1687. Available from: http://www-pub.iaea.org/MTCD/Publications/PDF/TE_1687_web.pdf.
FUMEX-III, 2013. Improvement of Computer Codes used for Fuel Behaviour Simulations.
Technical Report IAEA-TECDOC-1697. Available from:
http://www-pub.iaea.org/MTCD/Publications/PDF/TE-1697_CD/PDF/IAEA-TECDOC-1697.pdf.
Geelhood, K.J., Luscher, W.G., Raynaud, P.A., and Porter, I.E., 2015. FRAPCON-4.0: A computer code for the calculation of steady-state, thermal-mechanical behavior of oxide fuel rods for high burnup. Technical Report PNNL-19418, Vol.1 Rev.2, Pacific Northwest National Laboratory, USA. Govers, K., Lemehov, S., and Verwerft, M., 2008. In-pile Xe diffusion coefficient in UO2 determined from the modeling of intragranular bubble growth and destruction under irradiation.
LP2.A.3_a 55 CERSE-POLIMI RL 1506/2016
Journal of Nuclear Materials, 374, 461-472.
Hales, J.D., Williamson, R.L., Novascone, S.R., Pastore, G., Spencer, B.W., Stafford, D.S., Gamble, K.A., Perez, D.M., Gardner, R.J., and Liu, W., 2014. BISON theory manual: The equations behind nuclear fuel analysis. Technical Report INL/EXT-13-29930, Rev.1, Idaho National Laboratory, ID, USA.
Ham, F.S., 1958. Theory of diffusion-limited precipitation. Journal of Physics and Chemistry of Solids, 6, 335-351.
Hasting, I.J., Smith, A.D., Fehrenbach, P.J., and Carter, T.J., 1986. Fission Gas Release from Power-Ramped UO2 Fuel. Journal of Nuclear Materials, 139, 531–543.
Hering, W., 1982. The KWU Fission Gas Release Model for LWR Fuel Rods. Journal of Nuclear Materials, 114, 41–49.
Hermansonn, P., and Massih, A.R., 2002. An effective method for calculation of diffusive flow in spherical grains, Journal of Nuclear Materials, 304, 204–211.
Holt, L., Schubert, A., Van Uffelen, P., Walker, C.T., Fridman, E., and Sonoda, T., 2014. Sensitivity study on Xe depletion in the high burn-up structure of UO2. Journal of Nuclear Materials, 452, 166–172.
Khvostov, G., Novikov, V., Medvedev, A., and Bogatyr, S., 2005. Approaches to modeling of high burn-up structure and analysis of its effects on the behaviour of light water reactor fuels in the START-3 fuel performance code. In: Proceedings WRFPM-2005 (CD ROM, Paper 1104), Kyoto, Japan.
Kinoshita, M., Kameyama, T., Kitajima, S., and Matzke, Hj., 1998. Temperature and fission rate effects on the rim structure formation in a UO2 fuel with a burnup of 7.9% FIMA. Journal of Nuclear Materials, 252, 71–78.
LP2.A.3_a 56 CERSE-POLIMI RL 1506/2016
Lassmann, K., Walker, C.T., van de Laar, J., and Lindström, F., 1995. Modelling the high burnup UO2 structure in LWR fuel. Journal of Nuclear Materials, 226, 1–8.
Lassmann, K., and Benk, H., 2000. Numerical Algorithms for Intragranular Fission Gas Release. Journal of Nuclear Materials, 280, 127-135.
Lassmann, K., Schubert, A., Van Uffelen, P., Györi, C., and van de Laar, J., 2014. TRANSURANUS Handbook, Copyright ©1975-2014, Institute for Transuranium Elements, Karlsruhe, Germany.
Lemes, M., Soba, A., and Denis, A., 2015. An empirical formulation to describe the evolution of the high burn-up structure. Journal of Nuclear Materials, 456, 174–181.
Lösönen, P., 2000a. Methods for calculating diffusional gas release from spherical grains. Nuclear Engineering and Design, 196, 161–173.
Lösönen, P., 2000b. On the behaviour of intragranular fission gas in UO2 fuel. Journal of Nuclear Materials, 280, 56-72.
Lösönen, P., 2002. Modelling intragranular fission gas release in irradiation of sintered LWR UO2 fuel, Journal of Nuclear Materials, 304, 29-49.
Luzzi, L., Pastore, G., and Botazzoli, P., 2013. Modelli di rilascio dei gas di fissione per combustibili MOX ad elevato burnup. Technical Report RdS/2013/022. Available from:
http://www.enea.it/it/Ricerca_sviluppo/documenti/ricerca-di-sistema-elettrico/nucleare-iv-gen/2012/rds-2013-022.pdf.
Luzzi, L., Cammi, A., Di Marcello, V., Lorenzi, S., Pizzocri, D., and Van Uffelen, P., 2014a. Application of the TRANSURANUS code for the fuel pin design process of the ALFRED reactor. Nuclear Engineering and Design, 277, 173–187.
Luzzi, L., Lorenzi, S., Pizzocri, D., Rozzia, D., Aly, A., and Del Nevo, A., 2014b. Modeling and Analysis of Nuclear Fuel Pin Behavior for Innovative Lead Cooled FBR. Technical Report
LP2.A.3_a 57 CERSE-POLIMI RL 1506/2016
RdS/PAR2013/022. Available from: http://www.enea.it/it/Ricerca_sviluppo/documenti/ricerca-di-sistema-elettrico/nucleare-iv-gen/2013/rds-par2013-022.pdf.
Massih, A.R., and Forsberg, K., 2008. Calculation of Grain Boundary Gaseous Swelling in UO2. Journal of Nuclear Materials, 377, 406–408.
Matthews, J.R., and Wood, M.H., 1980. An efficient method for calculating diffusive flow to a spherical boundary. Nuclear Engineering and Design, 56, 439-443.
Matzke, Hj., 1980. Gas release mechanism in UO2–a critical review. Radiation Effects, 53, 219-242.
Nakamura, J., Suzuki, M., and Uestsuka, H., 1999. Re-Irradiation Tests of LWR Spent Fuel at JMTR. Enlarged Halden Programme Group Meeting, Loen, Norway, May 24-29.
Nelson, R.S., 1969. The stability of gas bubbles in an irradiation environment. Journal of Nuclear Materials, 31, 153-161.
Noirot, J., Pontillon, Y., Yagnik, S., and Turnbull, J.A., 2015. Post-irradiation examinations and high-temperature tests on undoped large-grain UO2 discs. Journal of Nuclear Materials, 462, 77–84. Notley, M.J.F., and MacEwan, J.R., 1966. Stepwise Release of Fission Gas from UO2 Fuel. Nuclear Applications, 2, 477.
Olander, D.R., 1976. Fundamental aspects of nuclear reactor fuel elements. Technical Information Center – Energy Research and Development Administration, University of California, Berkeley, CA, USA.
Parfitt, D.C., and Grimes, R.W., 2009. Predicting the probability for fission gas resolution into uranium dioxide. Journal of Nuclear Materials, 392, 28-34.
Pastore, G., Luzzi, L., Di Marcello, V., and Van Uffelen, P., 2013. Physics-Based Modelling of Fission Gas Swelling and Release in UO2 applied to Integral Fuel Rod Analysis. Nuclear Engineering and Design, 256, 75–86.