She was born in Castel San Pietro Terme (BO) on 27/05/1987. She graduated in Architecture and Building Engineering (M.Sc) at the School of Engineering and Architecture of University of Bologna on 18/07/2013 with full marks. The master degree thesis subject was Organization of Building Site with Prof. Eng. Marco Alvise Bragadin as supervisor.
Genetic Algorithms for Construction Time-Cost-Quality Trade-Off: A Road
Project Case Study
Algoritmi genetici per il controllo integrato tempi-costi-qualità nel
con-struction management: caso di studio di un progetto stradale
Construction projects must satisfy time cost and quality requirements and Project Management is basically focused on this trade-off. In fact, in every project these three parameters are interdependent: it’s impossible to change an element without conditioning at least one of the other two. The paper presents the development of a practical and automated system that uses an artifi cial intelligence technique for the planning of an infrastructural construction work, with the aim of optimizing time-cost-quality simultaneously. The model is developed as a multi-objective genetic algorithm to provide the capability of quantifying and considering quality in construction optimization. The purpose is to provide planners a useful technique to explore all possible project confi gurations.
I progetti di costruzione devono soddisfare requisiti in termini di tempi, costi e qualità e il Project Management è fondamentalmente concentrato su questo compromesso. In ogni progetto questi tre parametri sono interdipendenti: non si può modifi care un elemento senza infl uenzare almeno uno degli altri due. Questo lavoro presenta l’uso di una tecnica di intelligenza artifi ciale per la pianifi cazione delle attività di un progetto infrastrutturale, in vista di una ottimizzazione multi obbiettivo in termini di tempi-costi-qualità. L’approccio si basa sull’utilizzo di algoritmi genetici, implementati in Matlab, per valutare set di combinazioni di opzioni per le attività di costruzione. Lo scopo è quello di fornire una tecnica effi cace per esplorare adeguatamente tutte le possibili confi gurazioni progettuali.
Keywords: Construction Management; Key Performance Indicators (KPIs); Time-Cost-Quality trade-off analysis; road construction; Genetic Algorithms (GAs); Multi-objective Optimization
tempi-INTRODUCTION
The realization of construction works must satisfy a lot of complex requirements, made up by often contrasting, if not contradictory, elements: on one hand, parameters of time and cost must be respected, on the other the safety of works and the environmental impact must be reduced to a minimum, adequately compensated by mitigation and improvement works; fi nally, the materials and processes must gain the highest quality. From the outset, time-cost-quality trade-off has been the basis of the Project Manager’s activity: in every project there is in fact a triangle made by these three interdependent parameters. The role of the Project Manager is to ensure the integrity of that triangle: it’s impossible to change the budget, the schedule or the project’s quality objectives without affecting the other parts.
The Construction Management involves everything related to planning, monitoring and controlling of the project. A perfect project involves minimal time, low cost and high quality: clearly this is not always possible and if problems show up during the work, the Management must be ready to intervene by changing the relationship between the vertices of the “triangle”.
In literature many are the researches related to the study of time-cost trade-off analysis, but very few the ones related to the simultaneous compromise between time, cost and quality. These studies refer mostly to heuristic methods for the identifi cation of the optimal solution: in particular, it is possible to fi nd a good solution of the problem in less time than in the exact approaches. In recent years, there has been an increasing use of optimization algorithms because during the design process the optimization phase is gaining more and more importance.
RESEARCH METHOD AND OBJECTIVES
During the development of the master degree thesis in Organization of Building Site (2013), it has been developed a practical and automated system that uses genetic algorithm for the planning of road construction projects, with the aim of optimizing time-cost-quality simultaneously. The thesis was supervised by Prof. Eng. Marco Alvise Bragadin, Prof. Eng. Andrea Simone and Prof. Eng. Alessandro Marzani of the School of Engineering and Architecture of University of Bologna. The objectives of the thesis was to analyze the role of Project Management in the construction industry. In particular, a method of project planning that involves the use of genetic algorithms was experimented, as a result of studies on the existing scientifi c literature. A project example was analyzed in order to illustrate the use of the optimization model and demonstrate its capabilities. The case study examined the planning of the road SP4 “Galliera” project. Matlab software was used for the implementation of genetic algorithms, in order to obtain a multi-objective optimization in terms of time-cost-quality. The paper presents the results of the research with the purpose to provide planners an effi cient technique to adequately explore all possible design confi gurations, even in an advanced stage of planning, and to fi nd not only the optimal solution, but a set of optimal solutions for designers’ choices. CONSTRUCTION MANAGEMENT
Construction Management is the overall planning, coordination, and control of a project, from beginning to completion. In fact, in every complex project there are four main phases: planning, scheduling, execution and control. These phases are in continuous evolution and they represent the “life cycle” of the project. In addition to this, in all kind of projects there is also the cycle of quality, represented by the Deming Cycle, also called the “Plan-Do-Check-Act Cycle”.
The measurement of the performance of a construction project is usually based upon different metrics relating to time, cost, resources, quality and project specifi c indicators. But while for time, cost and resource usage it is simple to transfer project performance into meaningful indexes, relating to work packages or to the entire project, it is diffi cult to defi ne and evaluate quality (Bragadin, 2012). That is a relative concept and, as such, can be defi ned in many ways, because it consists of
one part strongly objective (the technical requirements that have to meet the specifi cations of the regulations) but also to a whole subjective one (the elements that need to meet expectations and desires of the client through the achievement of the objectives for which the project was realized). CONSTRUCTION QUALITY
In recent years, many scholars addressed the problem of measuring quality: one of the most important approaches is given by the use of Key Performance Indicators (KPIs). Key Performance Indicators are those critical metrics that can defi ne in a concise and proper way the project status and can be used to forecast the future project performance. The KPIs are the information needed by project team and stakeholders for decision making. In the international literature there are different approaches to the problem (Bragadin, 2012) :
1. The KPIs Working Group (2000) defi nes the quality KPIs basically as the frequency of defects in the end product. The Group assumes that quality in construction is subjective.
2. Another approach comes from the Construction Industry Development Board of Singapore, that developed an objective quality measurement System for building construction called CONQUAS (Building and Construction Authority, 2008).
3. The third approach to quality index evaluation is the one used by El Rayes and Kandil (2005, 2006) in studies for highway construction, in order to facilitate the measurement and quantifi cation of construction quality.
In recent years, literature has mainly focused on analyzing time and cost with little or no reported research on models for optimizing construction time, cost and quality jointly. All over the world and also in Italy many state departments of transportation have recently started to utilize innovative contracting methods that provide new incentives for improving construction quality, especially for road projects. The plan model is designed to transform the traditional two-dimensional time-cost tradeoff analysis to an advanced three-dimensional time-cost-quality trade-off analysis (Fig.1). The model is developed as a multi-objective genetic algorithm to provide the capability of quantifying and considering quality in construction optimization.
An application example is analyzed to illustrate the use of the model and demonstrate its capabilities in generating and visualizing optimal tradeoffs among construction time, cost, and quality. Other methods found in literature used integer programming models to optimize the trade-offs between construction time and cost (El Rayes and Kandil, 2005).
GENETIC ALGORITHMS
Genetic algorithms are a useful tool for planning and controlling the activities of a project. GAs are search and optimization tools that assist decision makers in identifying optimal or near-optimal solutions for problems with large search space. They are inspired by the mechanics of evolution and they adopt the survival of the fi ttest and the structured exchange of genetic materials among population members over successive generations as a basic mechanism for the search process (Goldberg 1989). As such, the model is implemented in three major phases: 1) Initialization phase that generates an initial set of possible solutions for this resource utilization problem; 2) fi tness evaluation phase that calculates the cost, time, and quality of each generated solution; and 3) population generation phase that seeks to improve the fi tness of solutions over successive generations.
So, GAs employ a random but yet directed search for locating the globally optimal solution. Typically, a GA encodes feasible solutions to a linear string called a chromosome, which can be viewed as boxed arranged in a linear manner, as indicated in Figure 2. Each box (gene) in the string represents an activity in the project. The number on the top of the box indicates its activity number in the network and the content in the box is the selected option for the corresponding activity.
The fi tness of solutions are evaluated by the objective function. This gives each solution different fi tness values, which represents the possibility of selection into next generation. Then, the selected parent chromosomes undergo stochastic transformations by means of genetic operations to form offsprings. There are two types of transformation: crossover, which creates new individuals by exchanging parts of information at randomly selected crossing point(s) from two parents, and mutation, which creates new individuals by making a sudden change in a single parent (Fig. 2 (a),(b)). New individuals are then evaluated. The better/“fi tter” offsprings from the current generation, then, form the parent population for the next generation. After several generations, the algorithm converges to the best solution, which is expected to represent the optimal solution to the problem (Daisy, S.Thomas, Mohan, 2002).
MULTIOBJECTIVE GENETIC ALGORITHM
With evolutionary techniques being used for single-objective optimization for over two decades, the incorporation of more than one objective in the fi tness function has fi nally gained popularity in the research rim (Coello 2000). Mainly, there is no clear defi nition of an “optimum” in multi-objective optimization as in the case of single-objective issues; and there even does not necessarily have to be an absolutely superior solution corresponding to all objectives due to the incommensurability and confl ict among objectives. The ‘‘best’’ solution generated from optimization would correspond to human decision-makers’ subjective selection from a potential solution pool, in terms of their particulars.
The concept of the Pareto optimum is the commonly accepted tool for comparing two solutions in multi-objective optimization that have no unifi ed criterion with respect to optima. Such solutions (normally referred to as non-dominated or Pareto optimal solutions) do necessitate improvement in any objective function without sacrifi cing at least one of the other objective functions. The region defi ned by Pareto optimal solutions is called the Pareto front, and the objective of multi-objective optimization is to establish the entire Pareto front for the problem instead of a single best solution (Daisy, S.Thomas, Mohan, 2004).
CASE STUDY
The case study is the road construction project for the “Strada Provinciale n°4 - Galliera (SP4)”. It includes the construction of a new axis road that bypass the towns of Castel Maggiore and Funo. The project essentially consists of a main axis at ground level, with some underpasses/overpass. The focus was only on the construction of the Main Axis. The project requirements are:
Figure 1 (left). Impact of new contracting methods on decision making in Construction (by El-Rayes Khaled, Kandil Amr, 2005)
Figure 2 (right). On the left, crossover molecular biology (a) and binary string crossover (b). On the bottom, string con-tained the activity sequence and option chosen for each one. On the right, General structure of a genetic algorithm.
a. ensure structural stability during the lifetime of the infrastructure, evaluated in about 20 years; b. ensure acceptable functional characteristics in all weather conditions, both for the adhesion
(therefore the safety of the circulation), and the regularity of the road surface (therefore the comfort of motion);
c. allow a decreased environmental impact in terms of saving valuable aggregates and quarry resources and reduce the noise emitted by tyre;
d. ensure short and reliable execution time, an easy and low maintenance and a good functionality throughout its useful life.
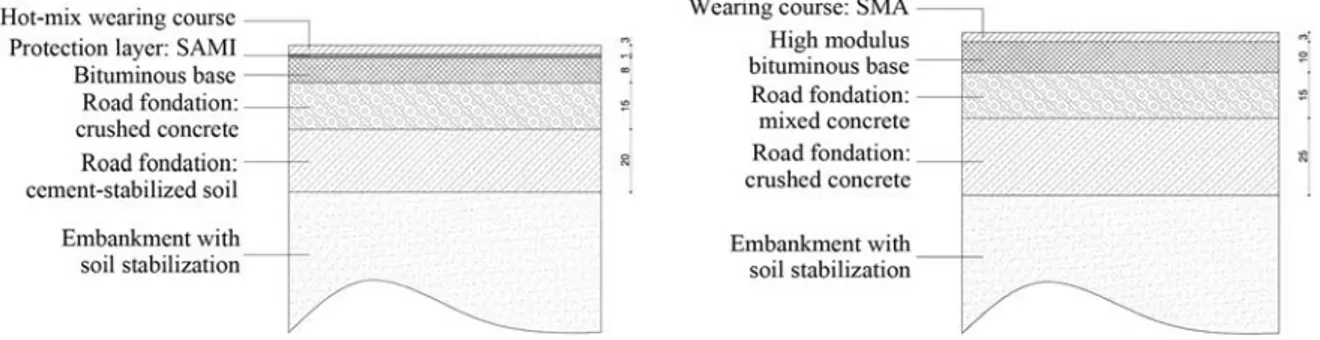
The original project provides a semi-rigid pavement characterized by a bituminous base, a fi rst road foundation in crushed concrete and a second one made of cement-stabilized soil. The subbase of the foundation consists of an embankment with soil stabilization high at least 80 cm. It’s composed of lime-stabilized soil or lime and cement stabilized soil; part of this soil came from the excavations.
Moreover, another proposal of an improved alternative variance from structural and functional point of view is obtained by using high modulus and mixed concrete. So, a change proposal was defi ned with Professor A.Simone; that different road project has both structural and functional better performance, thanks to its high modulus and mixed concrete.
PLANNING PROJECT ACTIVITIES
The main purpose of this phase is to plan project activities for both the proposals, by composing two different estimates. Thanks to the Price Analysis, which is the breakdown into simple items of work, it’s possible to identify the driving resource for each activity. The driving resource is the one that determines the duration of the activity: in a building construction site such resource is usually represented by labor; but in a road construction project, the driving resources are often the various machines used, because of high mechanization levels. After determining that resource, it’s possible to know how long it will take for the achievement of the specifi c activity, through the calculation of the time requirement. The time thus obtained becomes the deterministic time; it will be included in the project work-program.
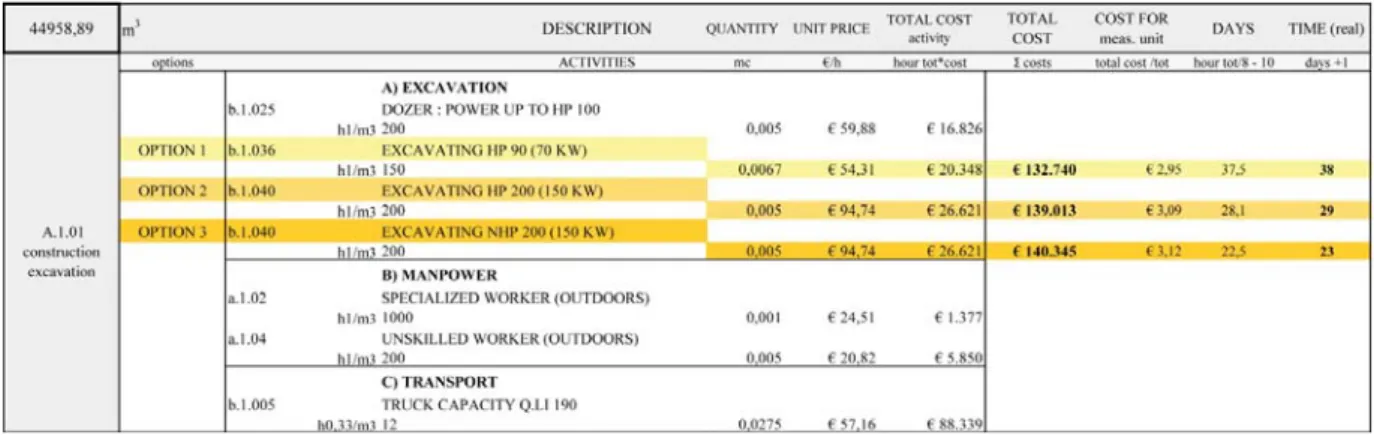
So, a set of different options in terms of time and cost for each activity are obtained by changing the driving resource identifi ed: more powerful machines reduce the execution time, but increase activity cost. There are 3 options for each activity, two according to the power of the machine used and the third including 2 hours of overtime (Fig.4).
QUANTIFYING QUALITY PERFORMANCE
Estimating and quantifying the quality of a construction activity and of the entire project is a more challenging task than predicting its impact on construction cost and duration. The development of a QBS for the project provides the capability of estimating the overall construction quality performance
at both the activity and the project levels using the hierarchical structure shown in Figure 5.
The developed QBS is designed to predict quality performance related to Key Performance Indicators chosen for each activity. After the laboratory test an expected quality performance is conferred to each KPIs as a percent number. These are selected from bearing capacity, aderence maintenance, environmental impact, and safety/durability, according to the type of activity. Specifi c weights are assigned both to the project activities performance indicators and to the individual activities referring to the fi nal result of the project.
Finally the relative and absolute quality indexes are calculated as following.
So, the laboratory tests are done for both the project superstructuresoptions, in order to have a quantitative validation about quality performance. With the program BISAR, it’s possible to
Figure 4. Price Analysis for activity 1: Construction Excavation
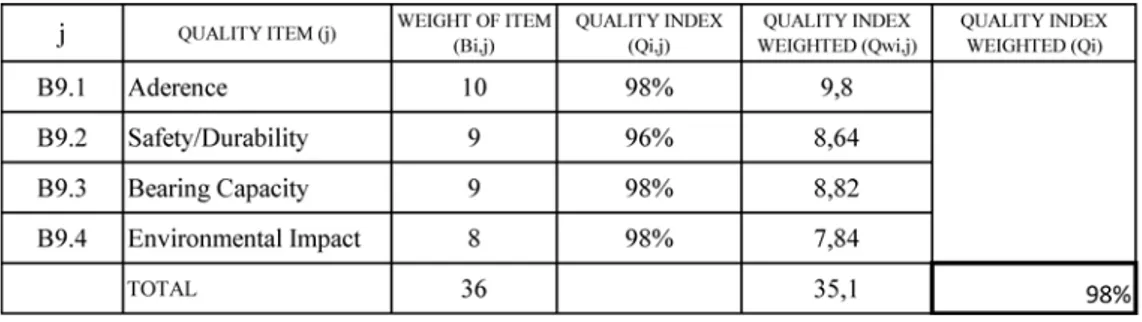
calculate stresses, strains and displacement of a casual point of an elastic multilayer subjected to circular loads on the surface. The best performance was of the structural materials of the SV2, because of the elastic modulus, even if the pavement thickness is 6 cm higher. This allows an increase of lift, endurance to the rutting and a better strain resistance. Then, after fi xing the key performance indicators for each of the project activities, it’s possible to evaluate and estimate them by attributing weights to each index related to the fi nal quality of the individual processing. The quality indicators are weighted with a score (Bi,j) from 1 to 10, where a weight of 10 means the maximum estimated effect of the quality item on the overall quality of the activity. The tables in Figure 6 show the quality assessment. It is shown as an example the one related to option 1 of the WEAR processing within the project SV2.
The present model uses prior assessments to estimate the quality of activities, thanks to the laboratory tests results. In order to evaluate the actual “Quality Performance” (Qi,j) of each construction activity (i) a satisfaction percentage is conferred to them for the quality indicator (j). That percentage is estimated in relation to the materials used and the laboratory tests results, and to Professor A.Simone experience in this sector. Then, the weighed “Quality Performance” (Qwi,j) of the quality indicator and the Quality Performance of the activities (Qi) are calculated with the following formulas.
(1)
(2)
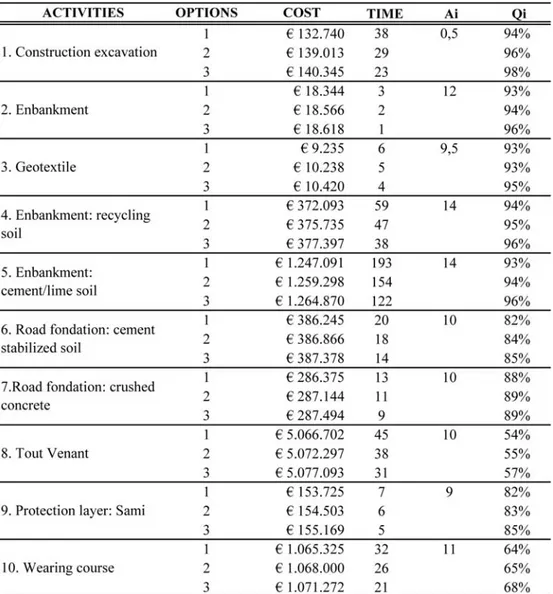
The table (Fig. 7) shows the weights of each project activity referred to the overall project and the prior quality assigned to them for each of the 3 possible options.
Figure 6. Quality assessment table
The following step consists in a recapitulatory table that reports the only useful informations for genetic algorithm implementation. A fi nal table is compiled for each project proposal, where, the options of achievement in terms of time, cost and quality are related for each activity. The weight of each activity within the overall project is also related in this tables (Ai). Every activity in the projects includes 3 possible options for its realization: that creates a search space of thousands possible solutions. The usefulness of the GAs is because its rapid calculation is able to explore the solution space in order to identify rapidly the optimal one. For example, the analyzed project consists of 9-10 construction activities, where each has 3 possible options that can be used to construct the activity as showed in Figure 8.
The possible combinations of these alternatives create a large search space of 310, where each solution in this space represents a possible resource utilization option for delivering the project. The model formulated with Matlab fi nds ideal solutions, rapidly converging towards the optimum due to genetic algorithms’ selection. The model is designed to help planners in the challenging task of searching this large solution space in order to identify optimal resource utilization plans that achieve multiple project objectives.
MODEL IMPLEMENTATION IN MATLAB
In order to program the genetic algorithms with Matlab, every project’s activity is represented by a 3-by-3 matrix reporting the options in terms of time-cost-quality. Therefore the entire project is represented by a set of matrices that constitutes a data array, in which will be selected an option for each activity.
The algorithm provide an initial random selection of options for each activity and then the calculation of the objective function setted in Matlab. The algorithm uses genetic operators such as crossover, which divides two initial solutions exchanging their informations in order to generate new solutions, and mutation, that simulates the effect of random errors. While the calculation progresses, only the best solutions is selected in order to get the higher one. Strings selected in that way are then assigned to the ga/ga-multiobjective depending on the Application, that evaluates the fi tness of fi nal results thanks to the objective functions specifi ed for the individual case examined. In this way, each solution acquires a fi tness value different from the others, according to which they may be re-selected or not in future generations. For this case study two different implementations are discussed: 1-objective algorithm (cost objective function) and 2-objectives algorithm (cost-quality objective functions). RESULTS: GA 1-OBJECTIVE
In this Application the objective function, in other words the fi tness of the problem, is represented by a cost function that involves the direct and indirect costs.
where C = project total cost; C(i) = actual direct cost of activity i; Ci = project daily indirect cost; Tt = project target duration; Ta = project actual duration; k = sharing ratio (k = ki = incentive ratio when (Tt - Ta) > 0; k = kp = penalty ratio when (Tt - Ta) < 0 (Daisy, S.Thomas, Mohan, 2002).
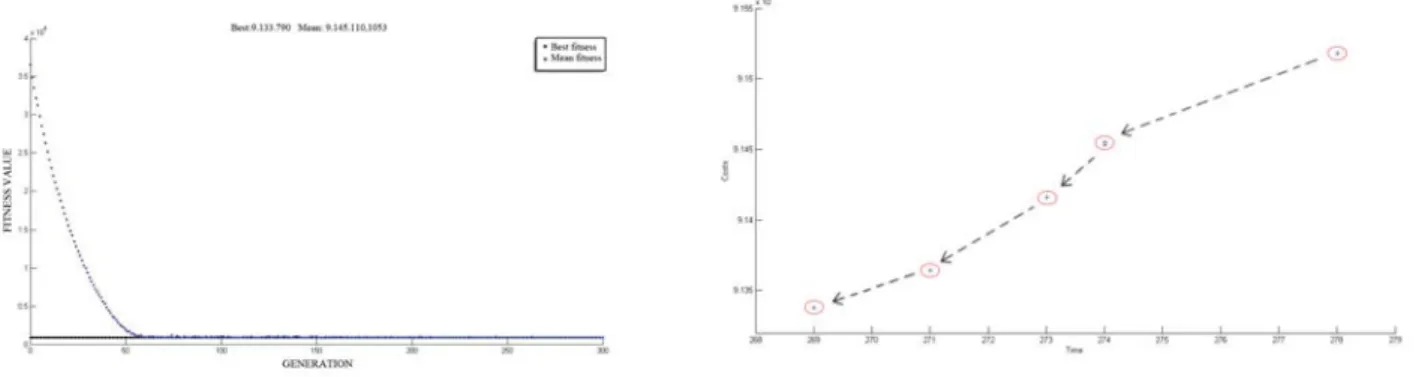
Matlab provides in output a graph having the number of generations in x-axis and the value of the cost function in y-axis. That graph (Fig. 9) shows how the value assumed by the cost function decreases more and more according to the proceeding of the calculation, up to converge at a minimum value. Five tests were done, for each of the two proposal projects, because the fi nal solution is never the same, according to the random selection of the start component that distinguishes genetic algorithms. So, the solutions that provide a lower cost for each of the projects are selected and it’s possible to understand that these also match to the lesser realization time.
The time-total cost graph (Fig.10) shows as at the beginning of the calculation the minimum values found in terms of time and cost are high, while during the progress of generations, in other terms the calculation of new solutions, these values decrease more and more until they reach a minimum value.
Figure 9. Algorithm implementation in Matlab: convergence of the solution to the minimum Figure 10. Time-total cost graph that shows the minimum value found in each generation
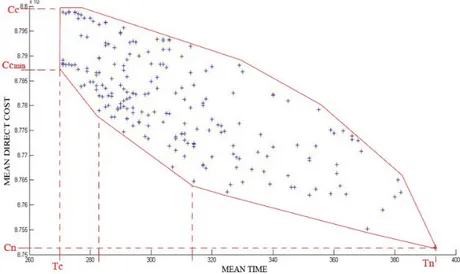
Instead, the graph time-direct costs (Fig.11) shows the enveloped area of costs. The result obtained from the experiment in Matlab perfectly matches the theory found in the literature concerning the CPM costs. The area shows in that graph is called the envelope curve of costs and encloses the region in which the representative points of the program work in terms of time and total cost will be presumably found. The graph obtained from the case study accurately refl ects the theory. The signifi cant coordinates are provided by the values of a work programmed with both normal time and cost (Tn, Cn) and the values of crash time and cost (Tc, Dc).
RESULTS: GA 2-OBJECTIVE
Regarding the multi-objective optimization algorithm, the fi tness of the problem is represented by two objective functions: the aim was to minimize time and cost of construction while maximizing its quality. The objective functions utilized are:
(3) (4)
The cost function (3) it’s the same used in 1-objective optimization. The quality function (4) take in consideration Ai, the weight of activity within the overall project, and Qi, the Quality Performance calculated for the activities options. Then, pairs of cost-quality values (C-Q) will be displayed in output, which will represent equal solutions to the examined problem and therefore correspond to any optimal solutions. Even in this case 5 different tests were done. Each of them gives in output different results, that are set of equipotential solutions for the problem, and constitute Pareto optimal front.
In the graph in Figure 12, one of that equipotential set is showed. It has cost values in x-axis and quality values in y-axis. It’s possible to see that to low costs correspond low quality and to high cost, high quality: that’s exactly the meaning of equipotential related to the problem. This means that fi ve combinations in terms of time-cost-quality have been identifi ed for the planning of the project, because there isn’t a single optimal solution that respect all the objectives. This set of solutions is known as Pareto set or Pareto front, i.e. the front of the “not dominated” solutions, for which it is no longer possible to decrease the value of one function without simultaneously increasing the value of at least one of the other objective functions. The solutions found are equally satisfactory and the aim of the multi-objective algorithm is to fi nd the largest number of these solutions.
The main challenge is to analyze this large search space to fi nd solutions that establish an optimal and delicate balance among construction time, cost and quality. Each solution identifi es an optimal option for the construction activities and, accordingly, it provides a unique and optimal tradeoff among time, cost and quality. The entire set of the identifi ed Pareto optimal solutions are represented graphically using a three- dimensional graph as shown in Fig. 13. This three-dimensional representation of the identifi ed solutions can be used to visualize the trade-offs among project time, cost, and quality in order to support decision makers in evaluating the impact of various resource utilization plans on project performance. These trade-offs can also be visualized in two-dimensional slices that illustrates trade-offs between two objectives at a time as shown in Fig 12.
DISCUSSION
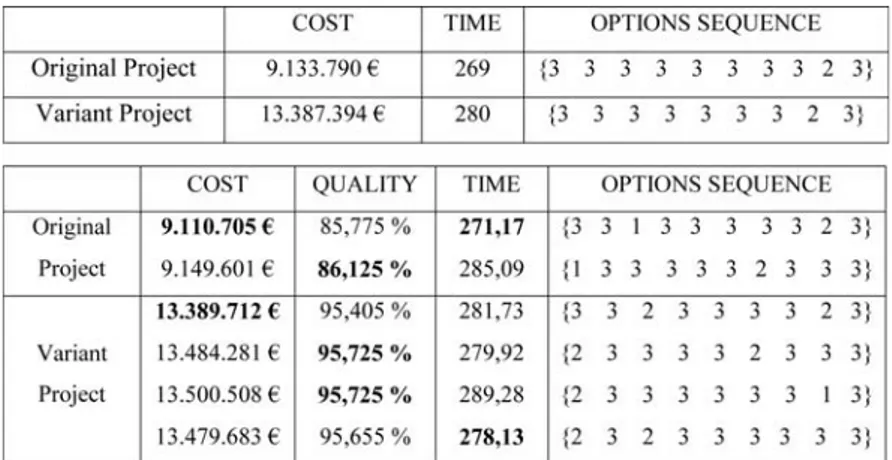
From the comparison between the two alternatives of project execution, it can be seen that the proposed variance is able to achieve a quality level about 10% higher than the original project. Despite the remarkable similarity between the alternatives, differentiated only by 4-5 activities related to the pavement, the estimated quality level shows a considerable increase. Certainly, the cost of the changed project will be higher, while there will not be any substantial differences for time. The project results obtained in both Applications, 1 and 2, are now reported and compared: minimum values found by the algorithm are selected for each of them. Interestingly, values of the same quality can be achieved by sequences of different options (Fig. 14).
Figure 12 (left). Equipotential solutions in terms of cost-quality (SV1 project, Test 1) Figure 13 (right). Time-cost-quality trade off (SV1 project)
Figure 14. On the bottom, optimal solutions computed by 1-objective optimization (Application 1). Down, optimal solu-tions computed by 2-objectives optimization (Application 2)
From the reported graphs (Fig. 12,13), clearly appears how multi-objective techniques provide a set of optimal solutions among which the planner can choose the most convenient one. This is different from the traditional planning single-objective procedures, that usually end up with a single solution point. Thus, according to the needs, it will be possible to favor one aspect rather than the other, in terms of time-cost-quality balance.
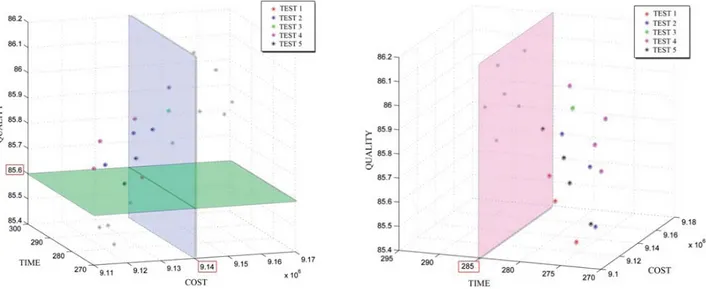
Finally, some practical methods of using the results obtained thanks to genetic algorithms are described, in particular for the planning stage of a project. Suppose that the planner wants to achieve a certain level in terms of time, cost or quality: by drawing the imposed threshold in the three-dimensional graph, he/she can choose only those solutions that provide desired levels. His/her fi nal choice will be put among these selected solutions. The Figures 15 and 16 illustrate an example of the original project’s results, that shows the usefulness of this technique. In this way, depending on needs, it will be possible to draw multiple levels in order to select the desired performance, according to the expectations and demands of clients. So, it will be easy to identify the possible alternatives and to ensure compliance with desired performances, in terms of time, cost or quality.
CONCLUSION
Despite the simplifi cations, the results were satisfactory. The single-objective optimization provided optimized cost and time values in both projects, even if the search was simple and the algorithm had a rapid convergence to the minimum. Following the development of multi-objective optimization, it’s possible to make a comparison between the two projects. That shows the clear performance superiority of the proposed variance project. SV2 project is in fact 10% better than SV1, although with an increase in cost of approximately 4 million euro, and an unchanged time of project completion. It is undisputed, however, the computational power of algorithms that, thanks to the speed of calculation and the simplicity of use, can be modifi ed as needed during construction, and permits continuous monitoring of the progress of projects. Depending on requirements, the planner will be able to choose the options he/she prefers.
Of course, quality evaluation heavily depended on indices assigned, due to planners’ experience, because there is no single criterion of appointment for those indices. This aspect shows the subjectivity
Figure 15 (left). Time-cost-quality graph where only options having cost less than € 9,140,000 which provide a quality higher than 85, 6% are selected
of the approach, which can take on different characteristics depending on the operator. Then, the intention is not to provide a method of quality assurance, but to assume a method of evaluation of total quality that can be used for contract purposes. In summary, the GA techniques has multiple advantages (Daisy, S.Thomas, Mohan, 2004):
- GAs work with a coding of the parameter set, not the parameters themselves.
- GAs search from a population of solutions rather than a single solution, which guarantees the global exploration.
- GAs use objective functions only instead of derivatives, which avoid the complex formulation of mathematical models.
- GAs use random choice as a mechanism to guide the search toward regions of the search space with likely improvement, not deterministic transition rules.
- GAs facilitate easy experimentation with different scenarios for what-if analysis.
As for the future applications, it would be interesting to continue the tests during construction execution; although this work is based on real data from a project that will be realized soon, it’s not possible to get feedback until the construction site starts. Furthermore, this method is particularly appropriate to the increasing presence on the market of performance specifi cations which, unlike the provisional ones, require a certain level of quality regardless of the materials/techniques used. Finally, this case study presents only 9-10 construction activities related to Main Road Axis and, for each of these activities, 3 alternative methods of accomplishment were hypothesized. In the real case of a complex project, the working activities are many more, as well as the possible options for implementation. Just consider for example the article by Kandil, “Time-Cost-Quality Trade-Off Analysis for Highway Construction”, where 20 activities were scheduled for the road project examined, each with 5 options of realization. That created a large space of research of about 95 trillion (520). In this case, the use of genetic algorithms is even more appropriate as the search of the optimal solution occurs between many different possibilities: the quick computing guarantees an effi cient analysis that guide the planner to choose the most appropriate solution for the specifi c case.
REFERENCES
American Society of Civil Engineers- ASCE (2002), “Report card: Reports and statistics.”, [http:// www.asce.org/reportcard/]
Allodi Daniela (2008), Project management per l’Architettura, Franco Angeli, Milano.
Archibald Russell D. (2004), Project Management - La gestione di Progetti e Programmi Complessi, Franco Angeli, Milano.
Bragadin Marco A., Kahkonen Kalle (2013), Quality Evaluation of Construction Activities for Project Control, JOURNAL OF FRONTIERS IN CONSTRUCTION ENGINEERING, Mar. 2013, Vol. 2 Iss. 1, pp. 17-24.
Bragadin Marco Alvise (2012), Quality Breakdown Structure per la Costruzione, ISTEA
Bragadin Marco Alvise (2011), La Programmazione dei Lavori con i Metodi Reticolari, Maggioli Edi-tore, Santarcangelo di Romagna.
Bragadin Marco Alvise (2008-2009), Programmazione Operativa, Appunti di lezione del Corso di organizzazione del Cantiere, Bologna.
Building and Construction Authority (2008), CONQUAS The BCA Construction Quality Assessment System, Building and Construction Authority, Singapore.
Caron Franco (2009), Gestione dei grandi progetti di ingegneria – il project management in azione, Isedi, Milano.
Coello, C. C. (2000), An updated survey of GA-based multiobjective optimization techniques, ACM Comput. Surv., 32(2), 109–143.
Daisy X.M. Zheng, S.Thomas Ng, Mohan M. Kumaraswamy, M.ASCE (2004), Applying a Genetic Algorithm-Based Multiobjective Approach for Time-Cost Optimization, Journal of construction engi-neering and management.
Daisy X.M. Zheng, S.Thomas Ng, Mohan M. Kumaraswamy, Applying genetic algorithm techniques for time-cost optimization, Department of Civil Engineering, University of Hong Kong, Pokfulam Road, Hong Kong.
El-Rayes Khaled, Kandil Amr (2005), Time-Cost-Quality Trade-Off Analysis for Highway Construc-tion, JOURNAL OF CONSTRUCTION ENGINEERING AND MANAGEMENT © ASCE, pag 477-486, April 2005.
Galbraith, J.K. (1967), The New Industrial State, Princeton University Press, U.S.
Goldberg, D. E. (1989), Genetic algorithms in search, optimization, and machine learning, Addison– Wesley, New York.
Kandil, A., El-Rayes, K. (2006), MACROS: Multiobjective Automated Construction Resource Optimi-zation System, Journal of Management in Engineering, 22 (3), 126-134.
Kerzner H. (2009), Project Management - Pianifi cazione, scheduling e controllo dei progetti, Hoepli, Milano.
Key Performance Indicators (KPI) Working Group (2000), KPI report for the Minister of Construction, Department of the Environment, Transport and the Regions, London, U.K.
PROJECT MANAGEMENT INSTITUTE - PMI (2004), A guide to the Project Managemet Body of Knowledge (PMBOK Guide)
Randy L. Haupt, Sue Ellen Haupt (2004), “Practical Genetic Algorithms”, John Wiley & Sons, Hobo-ken, New Jersey.
Rigamonti G. (2001), La Gestione dei Processi di Intervento Edilizio: Tecniche e strumenti di project management e construction management, UTET, Torino.
San Cristòbal Josè Ramòn (2009), “Time, Cost and Quality in a Road Building Construction”, JOURNAL OF CONSTRUCTION ENGINEERING AND MANAGEMENT © ASCE, pag 1271-1274, November
Simone Andrea (2013), “S.P.4: Verifi ca Pavimentazioni”, Relazione tecnica, Bologna, maggio 2013. Simone Andrea, Vignali Valeria, Appunti di lezione, Corso di Costruzione di Strade, Ferrovie ed Aero-porti, Dipartimento DICAM, Università di Bologna.