ABSTRACT ...I
RIASSUNTO ... II
ACKNOWLEDGEMENTS ... VII
DEDICATION ... VIII
LIST OF FIGURES ... IX
List of Tables ... XI
ABBREVIATION ... XII
KEY WORDS ... XVI
CHAPTER 1. ... 1
INTRODUCTION ... 1
1.1.
Hepatocellular Carcinoma ... 2
1.1.1. Treatment of HCC ... 3
1.2.
microRNAs: Biogenesis, Processing and Function ... 4
1.2.1. The Biogenesis of miRNAs and Target Recognition... 5
1.2.2. Functional and Genomic Organization of miRNAs ... 6
1.2.3. Regulation of microRNA Expression ... 7
1.3.
microRNA and Cancer ... 8
1.3.1. miRNAs as Oncogenes or Tumor Suppressor Genes ... 9
1.4.
microRNAs in Liver Health and Diseases ... 20
1.4.1. The Role of miRNAs in Liver Development ... 20
1.4.2. Involvement of Specific miRNAs in HCC ... 21
1.4.3. microRNA-221 and HCC ... 24
1.4.4. microRNA-199 and HCC ... 27
1.5.
Strategies for the Development of Therapeutics miRNAs ... 29
1.5.1. Viral Delivery of miRNAs in Liver Disease... 32
CHAPTER 2. ... 34
SPECIFIC AIMS OF THE STUDY ... 34
CHAPTER 3. ... 37
3.3.
DNA and Protein Marker/Ladder ... 43
3.4.
Vector Construction ... 44
3.4.1. Competent cell perparation ... 44
3.4.2. Glycerol Stocks Preparation ... 44
3.4.3. Restriction Enzyme Digestion ... 45
3.4.4. Ligation... 46
3.4.5. Transformation ... 46
3.4.6. Manipulation of DNA ... 48
3.4.7. Quantification of DNA and RNA ... 48
3.5.
Cell Culture ... 49
3.5.1. Cell Lines and Culture ... 49
3.5.2. Counting the Cell Number ... 49
3.5.3. Transfection ... 49
3.6.
Development of miR-221 Sponge/miR-199a Expressing Adeno
and Adeno associated Virus. ... 50
3.6.1. Construction of miR-221Sponge Oligonucleotids ... 50
3.6.2. Luciferase Expression Test ... 51
3.6.3. Duel Luciferase Reporter Assay ... 52
3.6.4. Development of Recombinant Adenoviruses ... 53
3.6.5. Development of Recombinant Adeno-Associated Virus ... 54
3.6.6. Viral Infection for Molecular Assay of rAAV ... 56
3.7.
Combination therapy of AntimiR-221/miR-199a Oligonucleotides
and Sorafenib. ... 56
3.7.1. Oligonucleotides and Therapeutic Reagent ... 56
3.7.2. IC50 Determination of Sorafenib ... 58
3.7.3. Combined Anticancer Effects of Sorafenib and Oligos (Anti-miR or pre-miR miRNA Precursor) ... 58
3.7.4. In vivo study ... 59
3.8.
Quantitative Molecular Assays ... 60
3.8.1. miRNA Analysis... 60
3.8.2. Protein assay ... 61
3.9.
Quantitative Cell Analysis ... 63
3.9.1. CellTiter-Glo® Luminescent Cell Viability Assay ... 63
3.10.
Statistical Analysis ... 67
CHAPTER 4. ... 68
RESULTS ... 68
4.1.
PART I: Development of Viral vector for Inhibition of miR-221
in HCC Cell Lines ... 69
4.1.1. Development of a Novel Sequestering Tools as microRNA Sponge for Inhibiting the miR-221……. ... 69
4.1.2. Adeno-Associate Viral Vectors Expressing miR-221Sponge Along with Reporters GFP/ LUC Constructed for in vitro and in vivo Studies. ... 70
4.1.3. Adeno-Associated Viral Delivery of miR-221Sponge Suppresses the Endogenous Up-Regulated miR-221 in HCC cell lines ... 80
4.1.4. miR-199-Dependent Recombinant Adenovirus Express Functional miR-221Sponge in vitro. . 82
4.2.
PART II: Development of Adeno-Associated Viral Vector for
Restoration of miR-199a in HCC Cell Lines. ... 87
4.2.1. Recombinant AAV Plasmids Engineered for Expressing miR-199a and GFP/ LUC Reporters for in vitro and in vivo Studies... 87
4.2.1.1. pAAV-miR-199a-IRES-GFP Construction ... 87
4.2.1.2. pAAV-miR-199a-IRES-Luc Construction ... 91
4.2.1.3. pAAV-IRES-Luc Construction ... 93
4.2.2. Recombinant Adeno-Associated Virus Developed to regulate the expression of miR-199a. ... 95
4.2.2.1. miR-199a Expression Promotes Apoptotic Cell Death and Reduces Viability in HCC Cells96
4.3.
PART III. Investigation of Combined Anticancer Effects of
AntimiR-221/mimics miR-199a and Sorafenib through in vitro and in
vivo Studies. ... 98
4.3.1. Sorafenib Decreases Cell Viability and Promotes Apoptosis in HCC Cell Lines ... 98
4.3.2. HCC Cell Lines Show Variable Sensitivity to Sorafenib ... 101
4.3.3. AntimiR-221/mimics miR-199a Oligos Have Synergistic Effect with Sorafenib in HCC Cell Lines….. ... 103
4.3.4. In vivo Anti-tumor Activity of mimics miR-199a Restoration Alone and in Combination with Sorafenib. ... 112
4.4.
PART IV: Assessment of Novel Cancer-Associated Targets of
miR-221 ... 113
CHAPTER 5. ... 116
DISCUSSION ... 116
221/miR-199 and Sorafenib. ... 122
5.4.
Perspectives ... 124
CHAPTER 6. ... 126
I would like to express my special appreciation and thanks to my adorable supervisor "Prof. Massimo Negrini" for enlightening me the best glance of research. You have been a tremendous mentor for me and your advice on both research as well as on my career have been priceless. I would also like to express my sincere gratitude to my Coordinator "Prof.
Antonio Cuneo " for allowing me to grow as a research scientist. I would also like to
thank, Prof. Silvia Sabbioni for all kindly assistance and brilliant comments and suggestions, thanks to you. My sincere thanks also goes to my fellow lab mates at the University of Ferrara: Dr. Elisa Callegari, Cristian Bassi,, Dr.Laura Lupini, Dr.Manuela Ferracin, LucillaD’Abundo, Dr.Barbara Zagatti, Dr.Elena Miotto, Fabio Corrà, Dr.Bahaeldin K. Elamin for the stimulating discussions, the technical and scientific knowledge that offer to me and for all the fun we have had in the lab. A special thanks to my family. Words cannot express how grateful I am to my mother "Shahin Heidari" and father "Dr. Ahmad Moshiri" for all of the sacrifices that you’ve made on my behalf. Your prayer for me was what sustained me thus far. Also I would like to thanks my brother "Dr. Farhad Moshiri", my sisters "Dr. Fereshteh and Farnoosh Moshiri" ,my mother-in law "Manije MalekAhmadi" , father-in-law "Eisa Sattari" and all family members for their kindly help. I would also like to thank all my friends with special thanks to Dr. Faranak Gharavi, Dr.Reza Rezazadeh, Dr.Pantea Shafiee, Dr.Behnam Makoee who supported me and incented me to strive towards my goal.
At the end I would like express deepness appreciation to my beloved husband "Dr. Arash
Sattari" who spent sleepless nights with and was always my support in the moments when
there was no one to answer my queries. Also my best appreciation goes to my Son " Small but Grand, Glorious and Honorable Man" RADMAN" for offering the moments that were belong him to me and consistently following me every time and everywhere.
I would like to dedicate my dissertation
To
My Father & My Mother
For giving all my need and all of sacrifices
My Beloved Husband
Who have never failed to give me support each step of the way
My Lovely Son
Who give me the unbelievable moral support
&
Figure 1.1. MicroRNA biogenesis………..………..…………..….…6
Figure 1.2. MiR-221/222 as oncomiRs……….…...13
Figure 1.3. MiR-221/222 as tumor suppressor miRs………..……….…13
Figure 1.4. diagram describes the miR-199a/miR-214 self-regulatory network…...15
Figure 1.5. key factors relating to miR-199a function……….….….….19
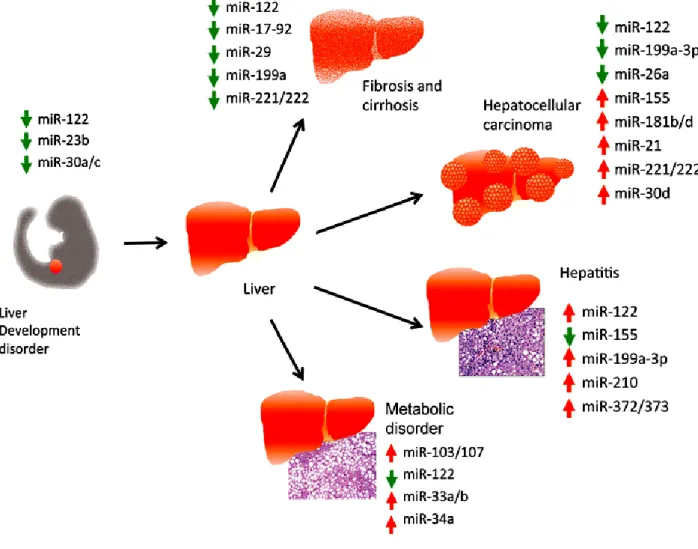
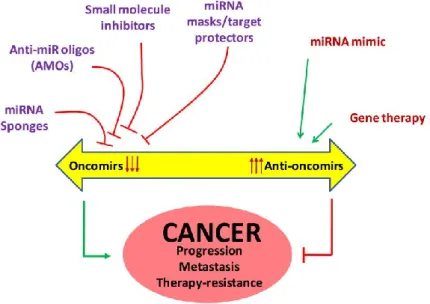
Figure 1.6. Summary of deregulated miRNAs identified in different liver disease….22 Figure 1.7. miRNA-based therapeutic strategies against cancer………...29
Figure 4.1. Schematic targeting of hsa-miR-221 by sponge duplex oligonucleotide…69 Figure 4.2. Schematic illustration of enclosing miR-221sponge oligo in AAV…...70
Figure 4.3.Control digest of pAAV-IRES-GFP………....…………..….…71
Figure 4.4. Screening of recombinant pAAV-miR-221sponge -IRES-GFP construct.72 Figure 4.5. Integrity of ITRs was verified by SmaI digestion……….…73
Figure 4.6.Schematic illustration of cloning steps of pAAV-miR-221sponge-IRES-Luc construction ……….…..…………...74
Figure 4.7.Control digest with XhoI and SalI………..……75
Figure 4.8.Screening of recombinant pAAV-miR-221Sponge-IRES-Luc construct…76 Figure 4.9.Florescent microscopy showed transfection efficiency and GFP expression of pAAV-IRES-GFP expressing construts in 293 cells (20X)………...77
Figure 4.10. Inhibition of endogenous miR-221 by sponge construct in vitro………...78
Figure 4.11. Western blot analysis of p27 target protein and beta actin………...79
Figure 4.12. Development of rAAV……….………..………...…80
Figure 4.13. Molecular assay of rAAV-sponge221-IRES-GFP………..…81
Figure 4.14.Functionalityof oncolytic recombinant adenovirus expressed microRNA sponge………..…83
Figure 4.15.Replications of recombinant adenovirus is restricted to HCC cell lines..84
Figure 4.16.Effect of miR-221sponge mediated viral delivery on apoptosis of HCC HepB3 cells by Mini, Affordable flow cytometry………86
Figure 4.18. Control digestion of pIRESneomiR199 and
pAAV-miR221sponge-IRES-GFP vectors ………..……..…88
Figure 4.19. Screening of recombinant pAAV-miR199-IRES-GFP construct……….90
Figure 4.20. Construction of pAAV-miR199-IRES-Luc………....92
Figure 4.21. Screening of recombinant pAAV-IRES-Luc construct………....93 Figure 4.22. Fold changes of average FF/renilla Luminescence of pAAV-miR-199-IRES-Luc, pAAV-IRES-Luc and miR-221sponge-IRES-Luc ………..………94 Figure 4.23. Functionality of rAAVexpressed microRNA 199……….….95 Figure 4.24. Cellular viability and apoptosis assay for HCC cells infected with rAAV-199……….…..97 Figure 4.25. Morphological changes induced by different concentration of sorafenib exposure for 48h………...…………...……...99 Figure 4.26. Sorafenib decrease viability and induces apoptosis in HCC cells….….100 Figure. 4.27. IC50 determination for sorafenib in HepG2 and Hep3B cells……...102 Figure 4.28. AntimiR-221 and/or sorafenib inhibit proliferation of HCC cells…….104 Figure 4.29. PremiR-199 and/or sorafenib inhibit proliferation of HCC cells…..….105 Figure 4.30. Apoptosis induction were detected via caspase3/7 activity…………...107 Figure 4.31. Muse Annexin V and Dead Cell analysis…… ………...108 Figure 4.32. Apoptosis induction were detected using fluorescently labeled with Annexin V in combination with the dead cell marker, 7-AAD…………..……...….109 Figure 4.33. Real time TaqMan assay for miR-221………...110 Figure 4.34. cell cycle analysis of AntimiR-221oligoes transfected Hep3B in combination with sorafenib……….111 Figure 4.35. in vivo assessment of miR-199a restoration alone or in combination with sorafenib. ……….……….112 Figure.4.36. Validation of individual miR-221 target genes……….……115
Table 1.2.miR-221/222as tumor suppresor genes ... 12 Table 1.3.miR-199a regulation and function in human cancer ... 18 Table 1.4.Differentially expressed miRNAs in liver tissues and hepatocellular
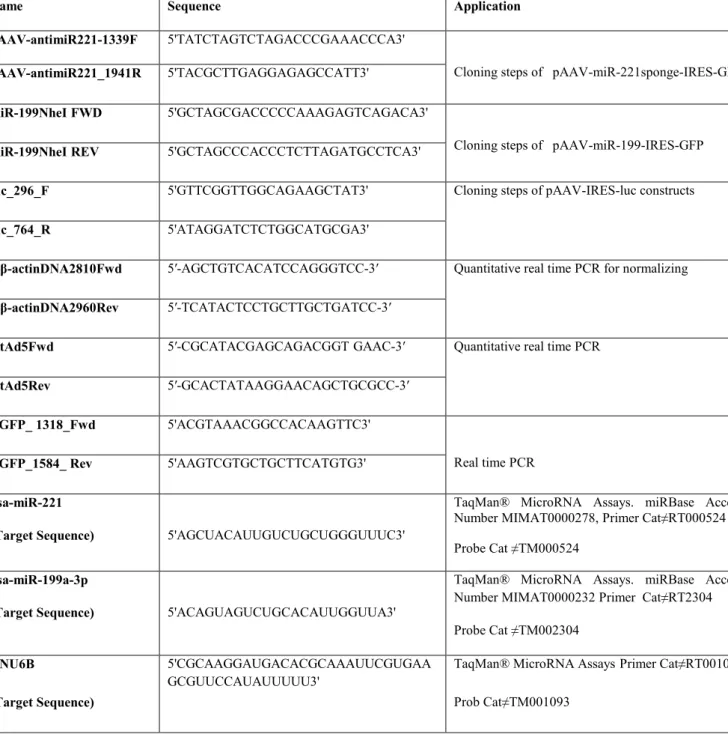
carcinoma (HCC) ... 23 Table 3.1.List of primers and probes ... 42 Table 4.1.Genes individually validated as miR-221 targets ... 113
3’UTR 3’untranslated region °C Celsius degree < Less-than sign µg Microgram µl Microliter µM Micromolar
AAV Adeno Associated Virus
Ad Adeno Virus
Ago2 Argonaute2
AMO Antisense miRNA oligonucleotide
Anti-miR Antisence microRNA
APAF1 Apoptotic Peptidase Activating Factor 1
AR Androgen receptor
ATCC American Type Culture Collection
BCL2 B-cell CLL/lymphoma 2
BH3 Bcl-2 homology 3
BMF B-cell lymphoma 2-modifying factor
bp Base pairs
Cap Capsidation
CDAA Choline-deficient and amino-acid-defined
CDK Cyclin-dependent kinase
CDKN1B/p27/kip1 Cyclin-dependent kinase inhibitors 27 CDKN1C/p57/kip2 Cyclin-dependent kinase inhibitors 57
cDNAs Complementary DNAs
CLL Chronic lymphocytic leukemia
cm Centimeter
CMV Cytomegalovirus
CRAds Conditionally replicating adenoviruses
Ct Threshold cycle
CTCF CCCTC-binding factor
DDIT4 DNA damage-inducible transcript 4 DGCR8 DiGeorge Critical Region 8
DMSO Dimethyl sulfoxide
DNA Deoxyribonucleic acid
DNase Deoxyribonuclease
dNTP Deoxynucleotide Triphosphate
dsRNA Double Strand RNA
E. coli Escherichia coli
E1A Adenoviral Eleary1A gene
E4 Adenoviral Eleary4 gene
EBV Epstein-Barr virus
EDTA Ethylene diamine tetra acetic acid EGFP Enhanced Green Fluorescence protein
ER Estrogen receptor
ERK Extracellular signal-regulated kinase
EtOH Ethanol
FASLG Fas Ligand
FBS Fetal bovine serum
FDA Food and Drug Administration
fg Fentogram
g Gram
GFP Green fluorescence protein
h Hour(s)
H2O Water
HBV Hepatitis B virus
HCC Hepatocellular carcinoma
HCV Hepatitis C virus
HEK293 Human embryonic kidney 293 cells
Hep3B Human liver cancer cells HepG2 cells Human liver cancer cells
IC50 Inhibition concentration to kill 50% of cells population IMEM Dulbecco’s Modified Iscove’s Medium
IRES Internal ribosomal entry site
ITRs Inverted Terminal Repeat
IU Infectious units
kb Kilobase
Kg Kilogram
KSRP KH-type splicing regulatory protein
LAR Luciferase Assay Reagent
Luc Luciferase M Molar mg Miligram min Minute(s) miR MicroRNA mir-221 MicroRNA-221
miRISC MiRNA induced silencing complex
miRNA MicroRNA
MOI Multiplicity of Infection
mM Milimolar
MMP Matrix metalloproteinase
nM Nanomolar
NR Nuclear receptors
NSCLC Non Small Cell Lung Cancer
nt Nucleotide
NTC Non-transfected
ORF Open reading frame
OTSCC Toncue squamous cell carcinoma
P53 Phosphoprotein 53
pAAV Adeno Associated Virus Plasmid
pAd Adeno virus Plasmid
PAGE Polyacrylamide Gel Electrophoresis
PCR Polymerase Chain Reaction
pg Picogram
pHelper Helper plasmid
PNK Polynucleotide Kinase
Pre- miRNAs Precursor miRNA
Pri- miRNAs Primary miRNAs
PS Phosphatidylserine
PTEN Phosphoinositide 3-kinase pathway phosphatase and tensin homolog PUMA p53 upregulated modulator of apoptosis
PVDF Polyvinylidene difluoride
qPCR Quantitative PCR
rAAV Recombinant Adeno Associated Virus
rAd Recombinant Adeno Virus
RAS Rat Sarcoma Virus oncogene
RB Retinoblastoma
Rep Replication
RIPA Radio Immuno Precipitation Assay
RNA Ribonucleic acid
RNA pol II RNA Polymerase II
RNA pol III RNA Polymerase III
rpm Rounds per minute
RTPCR Real Time PCR
s Second(s)
SD Standard deviation
SDS Sodium Dodecyl Sulfate
SOD2 Manganese superoxide dismutase2
SNU398 Human liver cancer cells SV40 Simian vacuolating virus 40
TAE buffer Tris-Acetate EDTA buffer
TGF Transforming Growth Factor
TIMP3 Tissue inhibitor of metalloproteinase 3
TP53INP1 Tumor suppressor protein 53-induced nuclear protein 1 TRBP/TARBP Transactivation-responsive RNA-binding protein
WNT Wingless-Type
wtAd5 Wild type adenovirus serotype 5
Hepatocellular carcinoma(HCC) microRNA(miRNA, miR)
Adenovirus
Adeno Associated Virus microRNA- Based Therapy microRNA Sponge
Antisence miRNA oligos(AMOs) Mimics miRNA
CHAPTER 1.
INTRODUCTION
1.1. Hepatocellular Carcinoma
Primary liver cancer mainly refers to hepatocellular carcinoma (HCC), intrahepatic cholangiocarcinoma (ICC), and hepatic angiosarcoma(1). Hepatocellular carcinoma (HCC) accounts for 85% to 90% of primary liver cancers which ranks as the fifth most common malignancy worldwide and the third most common cause of cancer-related mortality(2).
New Cases: An estimated 30,640 new cases of liver cancer (including intrahepatic bile
duct cancers) are expected to occur in the US during 2013. More than 80% of these cases are hepatocellular carcinoma (HCC), originating from hepatocytes, the predominant liver cell type. Liver cancer incidence rates are three times higher in men than in women. From 2005 to 2009, rates increased by 3.7% per year in men and by 3.0% per year in women(3).
Deaths: An estimated 21,670 liver cancer deaths (6,780 women, 14,890 men) are expected
in 2013. From 2005 to 2009, death rates for liver cancer increased by 2.3% per year in men and 1.3% per year in women(3).
Risk factors: In the US and other western countries, alcohol-related cirrhosis, and possibly
nonalcoholic fatty liver disease associated with obesity, account for the majority of liver cancer cases. Chronic infections with hepatitis B virus (HBV) and hepatitis C virus (HCV) are associated with less than half of liver cancer cases in the US, although they are the major risk factors for the disease worldwide. In the US, rates of HCC are higher in immigrants from areas where HBV is endemic, such as China, Southeast Asia, and sub-Saharan Africa. Other risk factors for liver cancer, particularly in economically developing countries, include parasitic infections (schistosomiasis and liver flukes) and consumption of food contaminated with aflatoxin, a toxin produced by mold during the storage of agricultural products in a warm, humid environment(3).
Pathogenesis: The exact pathophysiology of HCC is poorly understood .However
alterations in molecular pathways involved in the process of HCC are depicted as follows:(a) activation of the Wnt/Frizzled/catenin pathway through mutations in β-catenin as well as up-regulation of upstream elements, such as Frizzled receptors, (b) alteration of the MAPK signaling pathway through HBV or HCV infection, (c) activation of the JAK/STAT pathway through inactivation of JAK-binding proteins, (d) inactivation of the tumor suppressor gene p53 through gene mutation and posttranscriptional interaction with viral proteins as well as oxidative stress, (e) alteration of the tumor suppressor retinoblastoma (pRb Pathway) and p16INK4 genes through mutations or promoter
methylation and (f) alteration of the transforming growth factor-β pathway. So far, many HCC-related oncogenes, including AFP, RAS, c-FOS, c-JUN, RHO, TGF-a, HGF, CerbB2, HER-2, HER-2/neu, NEU, NGL, MDM2, MMP and IGF-β have been found. The abnormal expression of these genes with regard to a lasting cell proliferation results in carcinogenesis ultimately(4). Despite of deregulation of critical genes involve in cellular processes such as cell cycle control, apoptosis and cell migration, recent studies showed that molecules that regulate these events, including microRNAs (miRNAs) also play key role in development and progression of HCC(1, 5).
Early detection: Screening for liver cancer has not been proven to improve survival.
Nonetheless, many doctors in the US screen high-risk persons (e.g., HCV-infected persons with cirrhosis) with ultrasound or blood tests(3).
Survival: The overall 5-year relative survival rate for patients with liver cancer is 15%.
Forty percent of patients are diagnosed at an early stage, for which 5-year survival is 28%. Survival decreases to 10% and 3% for patients who are diagnosed at regional and distant stages of disease, respectively(3).
1.1.1.
Treatment of HCC
Early stage liver cancer can sometimes be successfully treated with surgery in patients with sufficient healthy liver tissue; liver transplantation may also be an option(3). Surgical treat-ment of early stage liver cancer is often limited by the high frequency of tumor recurrence and metastasis after curative resection. Statistics show that the survival rate of patients who have had a resection is 30% to 40% at 5 years, postoperatively(4). Patients whose tumors cannot be surgically removed may choose ablation (tumor destruction) or embolization, a procedure that cuts off blood flow to the tumor(3). Chemotherapy and radiotherapy are the two other conventional therapies applied in the treatment of cancer, which also get an unfavorable score because of the resistance of HCC. Moreover, occurrence of HCC often coupled with liver dysfunction, leads to restrict the use of conventional chemotherapeutics as there is more or less non-selective toxicity with significant systemic side effects(6). Fewer treatment options exist for patients diagnosed at an advanced stage of the disease. Sorafenib (Nexavar) is a targeted drug approved for the treatment of HCC in patients who are not candidates for surgery(3). Sorafenib is a multi-kinase inhibitor that targets proteins of multiple signaling pathways simultaneously—VEGFR2, VEGFR3, PDGFR, Flt-3, c-kit and the Raf/MEK/ERK pathway—to inhibit tumor growth and to induce apoptosis of
tumor cells(5). In a phase III trial, patients with advanced HCC treated with the molecular targeted agent sorafenib, reported an increase in survival of approximately 3 months(7, 8).Viral vectors, for example, recombinant adeno-associated virus (rAAV), mediated microRNAs targeted therapy which is targeting liver by hydrostatic pressure injection, is considered to be the appealing approach for liver disease as it is quite effective, associated with higher infectious rate and prolonged expression(4).
1.2. microRNAs: Biogenesis, Processing and Function
microRNAs (miRNAs) are a highly conserved group of endogenous small non-coding RNA (ncRNAs) molecules, which can be expressed in a tissue specific manner (9-11). miRNAs negatively regulate gene expression through binding of 6–8 nucleotide sequences (miRNA seed) to complementary sequences of target messenger RNA (mRNA), in the form of ribonucleoprotein complexes that mediate mRNA destabilization(12). In this way, they resulting in transcript degradation or translation inhibition(9-11). In the past 3 years, the number of microRNA loci annotated in miRBase has grown by approximately two-thirds, from 15 172 loci in 142 species (release 16, October 2010) to 24 521 loci in 206 species(release 20, June 2013)(13). Each miRNA can influence hundred of gene transcript and more than one miRNA can regulate any specific mRNA, which creates complexity in their capacity to modulate fundamental biological processes(14).
From a historic standpoint, it is curious to note that miRNAs have long been discovered (in 1993, by Victor Ambros et al.) before the 1998 Nature paper by Andrew Fire and Craig Mello, which introduced the term RNAi and was later rewarded with the Nobel prize (15, 16).lin-4 was the first miRNA, discovered from C. elegans in 1993(16). Seven years later, the second miRNA let-7 was also discovered from C. elegans(17). This publication was certainly distinct and unique, as it suggested, for the first time, that small dsRNAs could play key roles in gene expression. In 2001, this kind of endogenous tiny non-protein coding single-stranded RNAs were first designated as “microRNAs” (18). Subsequently, more and more miRNAs were identified in many species ranging from plants to human(19).
miRNAs are predicted to affect the expression of nearly 60% of protein-coding mammalian genes and thereby to control diverse cellular processes(20, 21). Fundamental changes at the cellular and organism level including development(22), aging(23), the stress response(24), cell proliferation(25) and apoptosis(26, 27), were shown to be regulated by
miRNAs. Furthermore, miRNAs have been implicated in various diseases, such as diabetes(28), cancer(29), hepatitis C(30), neuro-developmental(31) and mental (32) disorders. Rapidly growing knowledge of miRNAs as potent regulators in health and disease, makes miRNAs attractive as targets for therapeutic intervention(33, 34) as well as for diagnostic markers(35, 36).
1.2.1.
The Biogenesis of miRNAs and Target Recognition
MicroRNAs are 20-23 nucleotides in length(10). In mammalian cells, miRNAs are typically transcribed by RNA polymerase II (exceptions: a few are manuscript of RNA polymerase III ) as long pri-miRNA molecules from intergenic regions of the genome, but may also be derived from intronic and exonic regions of coding and non-coding genes(12). The mechanism of transcriptional regulation of miRNAs is not fully determined, because identification of the miRNA promoters is still a challenging task(37). In the nucleus, canonical pri-miRNAs are capped with 7-methylguanosine and polyadenylated and cleaved by the RNAse III enzyme Drosha and its cofactor Pasha (or DGCR8) to produce a 60–100 nt precursor miRNA (pre-miRNA) hairpin molecule(38).
RAN-GTP and exportin-5 complex, subsequently transport the pre-miRNAs into the cytoplasm. In cytoplasm, Dicer, also an RNAse III endonuclease, interacts with TRBP (Tar RNA Binding Protein) to mediate further processing of pre-miRNA to form a mature 20– 23 nt miRNA–miRNA* duplex(39). The duplex is unwound by a helicase and the mature miRNA is incorporated into effectors’ complex known as miRISC (miRNA induced silencing complex)(37, 40, 41), while the miRNA* (read as miRNA “star”) is degraded. The core components of miRISC are Argonaute proteins (AGO/EIF2C)(5) and GW182/TNRC6 protein families(42, 43). Within the RISC complex, miRNAs bind through imperfect base pairing to the 3’untranslated region (3’UTR) of target mRNAs(44). The binding specificity and efficiency is believed to be determined by 6–7 nucleotide sequence near 5′ region of miRNA. This sequence is called the “seed sequence” and is the initial binding site of the miRNA to the 3’UTR of the target mRNA(21). The subsequent procedures, depend on the degree of complementarily between the miRNAs and their targets. Imperfect complementarily of the miRNAs and the target mRNA, will cause translational repression of gene targets, while perfect matching, recruite the CAF1–CCR4 mRNAdeadenylation complex to initiate mRNA degradation (40)(Figure 1.1).
Figure 1.1. MicroRNA biogenesis. MicroRNA (miRs) are encoded by sequences located within intergenic regions or embedded in intronic sequences throughout the genome and transcribed by RNA polymerase II (RNA pol II) to generate long primary miR transcripts(pri-miR). The hairpin structure of pri-miRs are cleaved by the Drosha or DiGeorge syndrome critical region 8 (DGCR8) complex to yield precursor miRs (pre-miR). The pre-miR translocates from the nucleous into the cytoplasm via exportin5/Ran-GTP, and is consequently processed by the Dicer/TARBP2 (transactivation-responsive RNA-binding protein, also known as TRBP2) complex generating a miR:miR duplex. After unwinding and strand selection by unclear mechanisms, the mature miR is formed and loaded onto RISC (RNA-induced silencing complex) associated to Argonaute proteins (Ago1-4). The miR-RISC/Ago assembly complex can then target mRNAs through binding of the 3’-UTR (untranslated region) sequence or the mRNA open reading frame (ORF) which results in translation repression or mRNA degradation mediated possibly by Ago proteins(45).
1.2.2.
Functional and Genomic Organization of miRNAs
Many miRNAs share the same seed sequence that is used in mRNA targeting. Four hundred twenty-six of the 1,112 mature and miRNA*s can be organized into sequence families(46). Two hundred ninety-nine of the 557 miRNA precursors can be organized into transcriptional units (cistrons, also known as genomic clusters). These cistronic miRNAs are typically located within 5 kb of each other in intergenic regions or within the same intron/exon and are co-transcribed and yield similar read counts for each member of a given miRNA precursor cluster(47).
1.2.3.
Regulation of microRNA Expression
Several mechanisms, including gene amplification, deletion, epigenetic alterations, and single-nucleotide substitution, have been implicated in altered miRNA expression(48). Yang et,al in 2011 reviewed regulation of microRNA expression and function by nuclear receptor signaling. Nuclear receptors (NRs) are ligand-activated transcription factors that regulate the expression of target genes by binding to cis-acting DNA sequences. Since miRNAs are encoded by genes that are mainly transcribed by RNA polymerase II, their transcription can be regulated by a variety of transcription factors including NRs. For example, ERα binds directly to the promoter region of miR-221/222 and recruits NCoR and SMRT to suppress miR-221/222 expression. Androgen receptor(AR) can also bind to the promoter region of miR-221 to repress miR-221 expression in LNCaP cells. AR is a ligand-dependent transcription factor that regulates the expression of androgen target genes(49).
Post-transcriptional regulation has also been shown to essentially influence miRNA turnover rate or inhibitory activity. The 3′ end of mature miRNA can further be subject to a series of additional modifications such as uridylation that blocks Dicer processing and induces miRNA degradation and adenylation that affects miRNA stabilization. On the other hand in plants, 2′-O-methylation protects miRNA from uridylation, decay, and miRNA editing that makes an adenosine to inosine conversion resulting in altered mRNA target specificity. miRNAs expression can be dynamically regulated under certain conditions. For example, under inflammatory conditions, KH-type splicing regulatory protein (KSRP) can promote miR-155 maturation through binding to the terminal loop of pre-miRNA. In addition, expression of Dicer can be suppressed upon activation of various stress pathways, suggesting an implication of stress in alteration of miRNA expression(50). It has been demonstrated that the infection of Epstein-Barr virus (EBV) could influence human cellular miRNA expression. Godshalk et al. found that 99.5% of tested miRNAs displayed an average down-regulation of 19.92-fold upon initial EBV infection of primary cultured human B-cells, suggesting an activation of global suppression of miRNA-generating machinery(51).
Taken together, the growing body of literature has indicated that the miRNA biogenesis and its expression regulation are highly complicated, requiring participation of multiple
layers of transcriptional and post-transcriptional modifications and subject to tight and dynamic control under distinct physiological and pathological conditions(50).
1.3. microRNA and Cancer
Dysregulated miRNA expression is a common feature of solid and hematopoietic malignancies(52). The first demonstration of the link between miRNAs and cancer was reported in 2002 by Calin et al(52). They found that miR-15 and miR-16 are involved in the pathogenesis of chronic lymphocytic leukemia(CLL). Their evidence that suggests a role of tumor suppressor for miRNAs supported by the observation of down-regulation of miR-15a and miR-16–1 in two CLL patients(52-54). A study by Cimmino et al. in 2005, showed that miR-15a and miR-16–1 act as tumor suppressors by down-regulating B-cell CLL/lymphoma 2 (BCL2), a gene that is frequently up-regulated in CLL(55). Therefore, down-regulation of miR-15a and miR-16–1, which is mainly due to a genetic deletion, might promote B-cell proliferation in CLL (56).
Following, Several groups have studied the miRNA expression in cancer patients and found that miRNAs are differentially expressed in normal versus tumor tissues in different cancer types including leukemia(53), lymphoma(57), glioblastoma(58, 59), neuroblastoma(60), papillary thyroid carcinoma(61, 62), lung(63), breast(64, 65), liver (30), pancreas(66), gastric(35), colorectal(27, 67), ovarian(68), prostate(64, 69, 70), kidney and bladder cancer(71). Such researches revealed the aberration expression of miRNAs during carcinogenesis. The first report of miRNA deregulation in solid tumors was the observation of a consistent down-regulation of miR-143 and miR-145 in colorectal cancer(72). In the case of Lung cancer a reduction of >80% of let-7 expression was found by northern blotting in 44% (7 out of 16) of patients compared with healthy controls. Consequently many researches showed that profiles of miRNA expression are highly informative for tumor classification, prognosis, and response to therapy. Lu et al. at 2005 showed that miRNA expression profiles can be used in cancer diagnosis and human cancer classification(73).
In 2005, three reports provided the first mechanistic insight into how miRNAs might contribute to carcinogenesis. Two independent reports illustrated an interaction between miR-17-92 cluster and Myc(74, 75), and the third one uncovered the regulation of Ras by let-7(76). Lee et al showed that miRNA precursor processing reduce in cancer cells compared to normal human cell lines and tissues(77). Also miRNA processing
machineries, Drosha and Dicer, have a decreased expression in cancer cells. In ovarian cancer cases, the reduction of Dicer and Drosha correlates with a poor prognosis, suboptimal surgical cytoreduction and an advanced tumor stages(78).
1.3.1.
miRNAs as Oncogenes or Tumor Suppressor Genes
There are strong evidences that miRNAs can function as tumor suppressors (anti-oncomiRs) or tumor promoters ((anti-oncomiRs)(56). miRNAs are often down-regulated in cancerous tissues and target oncogenic proteins. They are classified as tumor suppressor miRNAs(79). Let-7 is widely viewed as a tumor suppressor miRNA. Consistent with this activity, the expression of let-7 family members is down-regulated in many cancer types when compared to normal tissue and during tumor progression(80). Moreover many human let-7 genes, map to regions altered or deleted in human tumors, indicating that these genes may function as tumor suppressors(25). Takamizawa et. al. observed that postoperative survival time in lung cancer patients directly correlated with let-7 expression levels: patients with lower let-7 expression survived for less time than those with higher let-7 expression(81).Development of spontaneous tumors induced by deletion of a single miRNA, miR-122, in the liver indicates that this miRNA indeed functions as a tumor suppressor. MiR-122, the most abundant miRNA in liver, was first suggested as a tumor suppressor in liver due to its diminished expression in primary HCCs of human and rodent origin, and its ectopic expression studies in HCC cell lines and xenograft models(31, 32). Loss of miR-122 results in the up-regulation of its target genes, including Adam10/17, Igf1R, Srf, and Ccng1, and inhibits tumorigenic properties of HCC cells(32). Similarly down-regulation of miR-199a-3p that abundantly expressed in the liver, induces ERK signaling pathway partly through targeting PAK4(82). Moreover Dramatic tumor suppression by the adeno-associated viral delivery of miR-26a in a Myc driven mouse model of HCC suggests that miR-26a may inhibit tumor growth by directly targeting genes involved in the control of cell cycle, such as Ccnd2 and Ccne2(34).
However, microarray analysis has identified that there is an increase in some miRNAs in tumor tissues compared to normal tissues. miRNAs with increased expression in the tumor ,often target tumor suppressors, are considered as "oncomiRs"(79, 83). The OncomiRs promote tumor development by negatively inhibiting tumor suppressor genes and/or genes that control cell differentiation or apoptosis. OncomiRs are significantly over-expressed in various tumors because of gene amplification, epigenetic mechanisms or transcriptional
dysregulation(84). miR-17-92 cluster is a typical example, which is located at chromosome 13q31, a region amplified in lung and other malignancies(84). Myc-induced up-regulation of miR-17-92 cluster has been shown to enhance tumorigenesis and angiogenesis(85). Recent studies also revealed that miR-17-92 was up-regulated in sonic hedgehog-driven medulloblastomas and induced by N-myc in sonic hedgehog-treated cerebellar neural precursors(86). Among others oncogenic miRNAs, miR-21 which is widely up-regulated in different types of cancers has been shown to promote tumor growth by targeting phosphatase and tensin homolog (PTEN). PTEN is an important tumor suppressor that is involved in control of cell migration and invasion by inhibiting its downstream targets including FAK, MMP2 and MMP9(36). Also in breast cancer cells, silencing of miR-21 inhibited cell growth in vitro and in vivo by causing down-regulation of Bcl-2 and induction of apoptosis(87).
miRNA expression profiling have reported increased expression of miR-155 in various cancers. It’s expression was significantly correlated with poor survival in pancreatic cancer patients(88). In another study, transfection of antimiR-155 oligonucleotides into pancreatic cancer induced the expression of tumor suppressor protein 53-induced nuclear protein 1 (TP53INP1) and enhanced apoptosis(89).
Furthermore, in a choline-deficient and amino-acid-defined (CDAA) diet-induced HCC model, many oncogenic miRNAs, including 155, 221/222, 21 and miR-181b/d, were up-regulated at an early stage of hepatocarcinogenesis(40-43). Interestingly, these miRs were reported to target tissue inhibitor of metalloprotease 3 (TIMP3)(40, 42, 43), which is involved in tumor invasion and metastasis as PTEN(37). 372 and miR-373 are two additional examples of oncogenic miRNAs that are shown to promote cell proliferation and tumor development by neutralizing p53-mediated CDK inhibition, possibly through direct targeting of the tumor suppressor gene LATS2. Further research is likely to add many more miRNAs to the growing list of oncomiRs(90).
1.3.1.1. miRNA-221: Its Role in Tumor Progression
miR-221 is a highly homologous miRNAs ,located in an intergenic region at chromosome Xp11. Sequence location Starts at 45605585 and ends at 45605694bp from pter (according to hg19-Feb_2009). miR-221 encoded along with miR-222 in cluster, containing identical seed sequences and both map to the X chromosome separated by 727 bases. In general, the microRNA genes are transcribed by RNA polymerase II, whereas RNA polymerase III is
also responsible for transcription of some other microRNAs. It is not known which RNA polymerase transcribes miR-221/miR-222. miR-221 and miR-222 were shown to be expressed as a single pri-microRNA transcript in c-kit positive HUVEC cells. In the following Pre-microRNA221 (Accession: MI0000298) with 110bp length has been formed and finally processed to 23 base pair mature miR-221 (Accession: MIMAT0000278)(91).
Regulation of miR-221
Regulation of miR-221 has been investigated in rare research. In neuroblastoma miR-221 was shown to induced by MYCN. Given that MYCN is a major regulator of neuroblastoma tumor biology, Schulte et al in 2008 investigated if specific miRNAs are regulated by the MYCN transcription factor in neuroblastoma cells. Using a miRNA microarray containing 384 different miRNAs and a set of 160 miRNA real-time PCR assays to validate the microarray results, they showed the role of MYCN in regulation of 7 miRNA including miR-221. Additionally, they reported miRNA induction to be a new mechanism of gene expression down-regulation by MYCN(60). Santhekadur et al in 2012 unraveled a linear pathway in which Staphylococcal nuclease domain-containing 1 (SND1)-induced activation of NF-_B resulted in induction of miR-221 and subsequent induction of angiogenic factors Angiogenin and CXCL16. CXCL16 can be induced by TNFβ treatment via NF-_B activation, and both CXCL16 and angiogenin activate NF-_B, thus establishing a positive feedback regulation. Both CXCL16 and angiogenin activate Akt/mTOR signaling, which in turn is involved in CXCL16 and angiogenin expression and secretion. On the other hand, miR-221 targets phosphatase and tensin homolog (PTEN) and DDIT4, inhibitors of the Akt/mTOR pathway. Thus, an expansive protumorigenic signaling network lies downstream of SND1(92).
miR-221 in Tumorogenesis
Many studies to date have been reported on the role of miR-221/222 in cancer development either as oncomiR or as tumor suppressors-miRs (anti-oncomiRs ) which summarized in Table 1.1 and 1.2. The two studies that evidenced a tumor suppressive role for miR-221/222 in OTSCC and erythrocytes, indicating that microRNA function is exclusively dependent on the cellular contest and tumor type(93). In Luminal Breast Cancer , most high-grade tumors express low levels of miR-221/222(94). The roles of
miR-221/222 in cellular signaling pathways as an oncomiR or onco-suppressor-miR depicted in Figure 1.2 and 1.3. These findings provide evidence that a single miRNA, through its ability to modulate different genes that involved in the same network, may act as a strong inhibitor of the entire cellular pathway, suggesting a possible greater therapeutic potential for miRNAs than for a single gene(93).
Table 00.1.miR-221/222as oncogene
miRNA Target Deregulation in Cancer
P27/Kip1 Giloblastoma, thyroid papillary carcinomas, hepatocellular carcinoma, breast, prostate and pancreatic cancer(95-100)
P57 Hepatocellular carcinoma(99, 100)
Puma Glioblastoma(101)
ER-α FOXO3 Breast(102)
PTEN TIMP3 NSCLC, Hepatocarcinoma, giloma, gastric canser(100) DDIT4 Hepatocellular carcinoma(103)
Bim Prostate cancer(104)
Table 1.2.miR-221/222 as tumor suppressor genes
miRNA Target Deregulation in Cancer
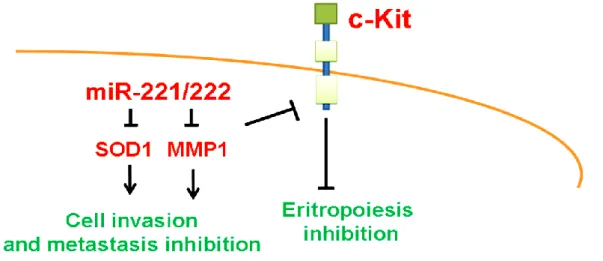
SODI MMP1 tongue squamous cell carcinoma (OTSCC)(105)
c-Kit erythrocytes(106)
Figure 1.2.MiR-221/222 as oncomiRs MiR-221/222 act as oncomiRs by targeting important tumor suppressor genes such as PTEN, TIMP3, p27Kip1, p57, Bim. MiR-221/222 over-expression induces cell proliferation through the activation of cell cycle and the Akt pathway and blocks TRAIL-induced apoptosis. Moreover, miR-221/222 determine fulvestrant resistance through the activation of the β-catenin pathway(93)
Figura 1.3. MiR-221/222 as tumor suppressor miRs.MiR-221/222 act as tumor suppressor miRs in the erythropoietic lineage cells, and oral tongue squamous cells by targeting c-Kit, matrix metalloproteinase 1 (MMP1) and manganese superoxide dismutase (SOD2) (93).
Almost all of the proposed target genes of miR-221 are associated with hallmark of cellular processes that characterized in cancer cells. miR-221 impairs apoptosis and induces cell proliferation in different types of cancer cells(93). These functional changes occur because miR-221 is capable of targeting and down-regulating known tumor suppressors; including p27Kip1, p57Kip2(70, 107), phosphatase, tensin homolog(PTEN)(107, 108), a tissue inhibitor of metalloproteinase-3(100), and the DNA damage-inducible transcript 4 (DDIT4)(103), a modulator of the mTOR pathway and p53 up-regulated modulator of apoptosis (PUMA)(107), a Bcl-2 homology 3 (BH3)-only Bcl-2 family member and a critical mediator of p53-dependent and p53-independent apoptosis.
Functional studies by Medina et al showed that miR-221 and miR-222 prevent quiescence when elevated during growth factor deprivation and induce precocious S-phase entry, thereby triggering cell death(109). Thus, the physiologic up-regulation of miR-221 and miR-222 is tightly linked to a cell cycle checkpoint that ensures cell survival by coordinating competency for initiation of S phase with growth factor signaling pathways that stimulate cell proliferation.
Gene expression profiling of miR-221-transfected-SNU-398 cells was analyzed by Negrini’s research group in 2013. This analysis revealed that enforced expression of miR-221 in SNU-398 cells caused the down-regulation of 602 mRNAs carrying sequences homologous to miR-221 seed sequence within their 3_UTRs. Pathways analysis performed on these genes revealed their prominent involvement in cell proliferation and apoptosis. Activation of E2F ,MYC ,NF-kB ,and β-catenin pathways was experimentally proven. Some of the new miR-221 target genes, including RB1, WEE1(cell cycle inhibitors),APAF1(pro-apoptotic),ANXA1,CTCF (transcriptional repressor) , were individually validated as miR-221 targets in SNU-398, HepG2, and HEK293 cell lines(110). Regard to their inhibition of RB1 expression , levels of miR-221/222 appear to be major factors in cell-cycle control(111).
Yang et al (2014) showed a negative correlation between miR-221 or miR-222 and SIRT1(Sirtuin Histone Deacetylase SIRT1), but no direct target relationship was identified. Inhibition of miR-221 or miR-222 leads to reduced cell proliferation and migration and increased apoptosis in prostate cancer cells. These effects showed potentially mediated by up-regulation of SIRT1(112).
1.3.1.2. miR-199a: Its Role in Tumor Progression
miR-199 has been shown to be a vertebrate specific miR family that emerge at the origin of the vertebrate lineage. In 2003, two mature forms derived from the same precursor, miR-199-s (from the 5’ half) and miR-199-a (from the 3’ half), were cloned from human osteoblast sarcoma cells and mouse skin, respectively(113). Expression of the microRNA was validated in zebrafish, and its ends mapped by cloning. The two microRNA sequences were named miR-199a and miR-199a* (from the 3’ arm), respectively. Later it was shown that both mature forms are expressed in humans, and it was renamed miR-199a-5p and 199a-3p, respectively(114). There are two loci that encode the precursor of miR-199a-5p and -3p in the human genome; one is on Chromosome 1(miR-199a-2, miRBase Accession MI0000281) and the other on Chromosome 19 (miR-199a-1, miRBase Accession MI0000242)(114, 115).
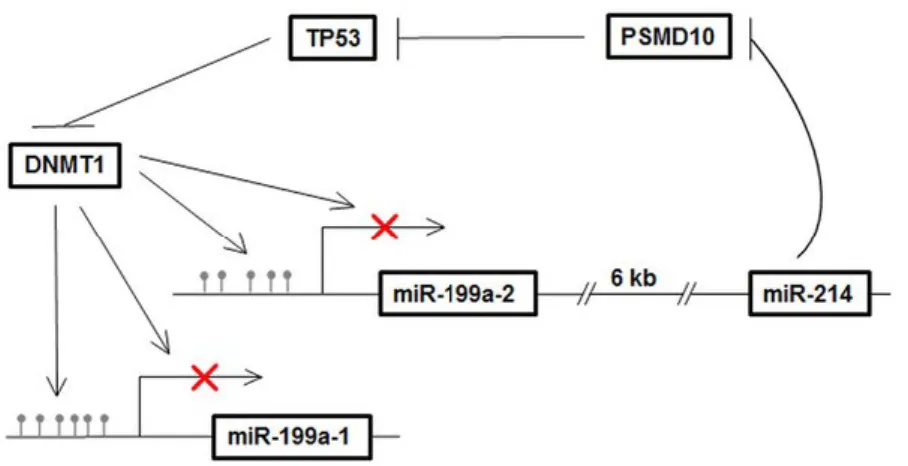
miR-199a-1 located on Chromosome 19 (Chr19) is embedded in the anti-sense strand of intron 15 of Dynamin 2 (DNM2), whereas miR-199a-2 located on Chromosome 1 (Chr1) is embedded in the anti-sense strand of intron 14 of Dynamin 3 (DNM3). Within Dynamin3 gene (Dnm3), miR-199a is associated with miR-214 and both miRs are transcribed together as a common primary transcript, demonstrated in mouse, human and zebrafish(116). The biological significance of the co-expression of miR-199a and miR-214 was revealed recently(115). it suggested that TP53 was activated by miR-214 and participated in the positive regulation of miR-199a/miR-214 via repressing DNMT1(Figure 1.4.). DNMT1 is primarily responsible for the maintenance, while DNMT3A and DNMT3B (de novo methyltransferases) are responsible for the establishment of genome DNA methylation patterns(115).
Figure 1.4. diagram describes the miR-199a/miR-214 self-regulatory network via TP53 and DNMT1 in TGCT(133).
There is no evidence of functional correlation between the expression of the dynamin genes and the miR-199a precursors: this may be due to the fact that the expression of the miRNA precursors is controlled by their own promoters.
Regulation of miR-199a
Currently, two mechanisms that control the expression of miR-199a have been discovered. One is the regulation by transcription factors TWIST1 and EGR1 on Chr1; the other is the methylation status of miR-199a promoters on both Chr1 and Chr19. Studies in several cell lines showed that both promoter regions on Chr1 and Chr19 were hypermethylated (higher than 90%) in cancer cells but hypo- or not methylated in normal fibroblasts. Correspondingly the expression of miR-199a was higher in normal fibroblasts than cancer cells(117). Genome-wide DNA methylation profiling revealed that the promoter region of miR-199a-2 on Chr1 was hypermethylated in testicular germ cell tumors compared to the hypomethylation status in normal testicular fibroblasts. Apparently hypermethylation in testicular cancer cells caused severely reduced expression of miR-199a(118). Similar observations were made in non-small cell lung cancer, colorectal cancer and breast cancer cell lines (119).
Besides TWIST1, EGR1, and DNA methylation, other factors have been reported to control expression of miR-199a. Reduced expression of miR-199a-3p in hepatocellular carcinoma was shown to be mediated by histone modification and was independent of DNA methylation(120). In vitro cell model studies of liver injury and fibrosis showed that farnesoid X receptor (FXR) could negatively regulate miR-199a-3p at the post-transcriptional level(121). In mice cardiac myocytes, miR-199a-5p was upregulated during cardiac hypertrophy via β-adrenergic receptor (β-AR) stimulation, but downregulated by AKT activation during hypoxia (122). Another transcription factor, signal transducer and activation of transcription 3 (STAT3) was demonstrated to negatively regulate miR-199a-2 by suppressing its promoter activity in mice cardiocytes (123).
miR-199a in Tumorigenesis
miR-199a has been shown to be implicated in a wide variety of cellular and developmental mechanisms such as various cancer development and progression, cardiomyocytes protection or skeletal formation(114).
During tumorigenesis, depending on the nature of the cancer, miR-199a, especially its -3p mature form, may act as either a potential tumor suppressor (anti-oncomiR) or an oncogene (OncomiR) (Table 1.3.).
miR-199a as Anti-oncomiRs
MiR-199a was frequently down-regulated in human hepatocellular carcinoma (HCC)(124). HIF-1α was identified as a direct target. MiR-199a through targeting of HIF-1α could inhibit cell proliferation , as it shown in virto and in vivo studies(125). Another study in HCC showed that miR-199a-3p could target tumor-promoting PAK4 to suppress HCC growth through inhibiting the PAK4/RAF/MEK/ERK pathway both in vitro and in vivo(120). CD44+(126), pro-invasion molecule DDR1(127) and mTOR(128) has been shown as other targets of miR-199a in HCC.
Aside from the down regulation in HCC, In serous ovarian cancer patient tissues, miR-199a was down-regulated and significantly correlated with a poor prognosis. In osteosarcoma, miR-199a-3p showed reduced expression(129). Which affecting proliferation, migration and cell cycle progression. Molecules that were affected and which might be targets of miR-199a-3p include MET, mTOR and STAT3(130). Peng et al (2013) suggested that miRNA-199a-3p is associated with human gastric cancer through its ability to decrease cancer cell proliferation and target the mTOR signaling pathway(131). Similarly, Wu et al in 2013 reported that microRNA-199a-3p regulates endometrial cancer cell proliferation by targeting mammalian target of rapamycin (mTOR)(132). Using microarray and immunoblotting analyses it has been shown that miR-199a* targets the Met proto-oncogene(117).
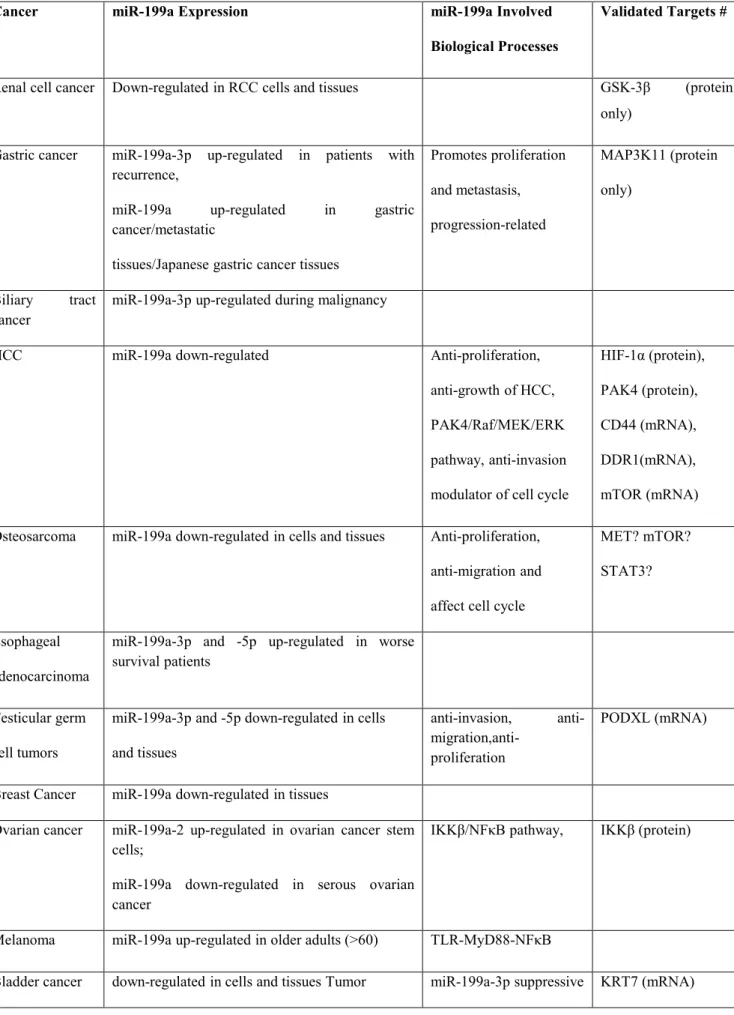
Table 1.3.miR-199a regulation and function in human cancer
Cancer miR-199a Expression miR-199a Involved
Biological Processes
Validated Targets #
Renal cell cancer Down-regulated in RCC cells and tissues GSK-3β (protein only)
Gastric cancer miR-199a-3p up-regulated in patients with recurrence,
miR-199a up-regulated in gastric cancer/metastatic
tissues/Japanese gastric cancer tissues
Promotes proliferation and metastasis, progression-related MAP3K11 (protein only) Biliary tract cancer
miR-199a-3p up-regulated during malignancy
HCC miR-199a down-regulated Anti-proliferation,
anti-growth of HCC, PAK4/Raf/MEK/ERK pathway, anti-invasion modulator of cell cycle
HIF-1α (protein), PAK4 (protein), CD44 (mRNA), DDR1(mRNA), mTOR (mRNA) Osteosarcoma miR-199a down-regulated in cells and tissues Anti-proliferation,
anti-migration and affect cell cycle
MET? mTOR? STAT3?
Esophageal adenocarcinoma
miR-199a-3p and -5p up-regulated in worse survival patients
Testicular germ cell tumors
miR-199a-3p and -5p down-regulated in cells and tissues
anti-invasion, anti-
migration,anti-proliferation
PODXL (mRNA)
Breast Cancer miR-199a down-regulated in tissues
Ovarian cancer miR-199a-2 up-regulated in ovarian cancer stem cells;
miR-199a down-regulated in serous ovarian cancer
IKKβ/NFκB pathway, IKKβ (protein)
Melanoma miR-199a up-regulated in older adults (>60) TLR-MyD88-NFκB
miR-199a as OncomiRs
Comparing two sets of acute myeloid leukemia (AML) patients, miR-199a was expressed much higher in patients with worse overall and event-free survival. High expression of miR-199a was also identified in AML patients with isolated trisomy 8. Chen et al showed that the property of ovarian cancer cells to enhance the inflammatory microenvironment as a result of the expression of an active IKKβ pathway. They identified that miR-199a-2 due to stimulation by TWIST1 down regulated IKKβ, shut down the IKKβ/NFκB pathway(133). Lijun et al identified a dramatically up-regulated microRNA, miR-199a-5p, in ADPKD(Autosomal Dominant Polycystic Kidney Disease) tissues and cell lines. Their data show that inhibition of miR-199a-5p suppressed cyst cells proliferation and induced cell apoptosis. We found that miR-199a-5p might exert this effect through targeting CDKN1C/p57(134).
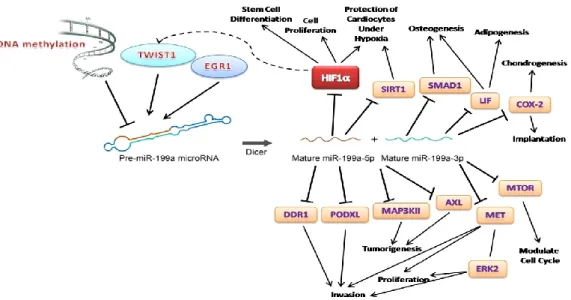
Summary of key factors relating to miR-199a and its functions on different targets illustrated in Figure 1.5.
1.4. microRNAs in Liver Health and Diseases
1.4.1.
The Role of miRNAs in Liver Development
MicroRNAs fine-tune all physiological and many pathological processes that are fundamental to normal liver functions as well as liver diseases. In the liver miRNAs regulate various cellular processes like inflammation, fibrosis, lipid and glucose metabolism(14). lin-4 and let-7, two miRNAs identified in C. elegans, are critical components to regulate different stages of development in C. elegans(135). However, its role in liver development has not been addressed because two studies that have reported phenotype of liver-specific Dicer 1 knockout mice used Alb-Cre mice where the gene is deleted after the development of the liver bud(136). Crossing Dicer 1 floxed mice to Afp-Cre or Foxa3-Afp-Cre may be helpful to address the role of miRNAs in liver development. Shu-hao Hsu et al have established essential role of miR-122 the most abundant, highly conserved, liver-specific miRNA in maintaining the differentiation state of the liver, since its loss induced proliferation of oval and bile duct cells in young adult mice and hepatocellular carcinoma HCC with age(137). In addition to miR-122, several other miRNAs appear to be involved in liver differentiation like miR-30a which its knockdown, results in defects in the intrahepatic bile duct in zebrafish and miR-23b which governs differentiation of hepatocytes and cholangiocytes by silencing Smad 3, 4 and 5. Many studies have revealed differential expression of miRNAs between embryonic and adult livers and correlated these findings with the critical factors involved in liver development. However, the expression of miRNA which is often observed in the total liver RNA, may not reflect the actual biological role of differentially expressed miRNA in specific cell types. Therefore, it is necessary to analyze the miRNA expression at different stages of liver development by monitoring their expression in specific cell types. Also, in absence of knockout animal models, it is difficult to pinpoint the developmental role of these miRs(37).
1.4.2.
Involvement of Specific miRNAs in HCC
It has been well established that dysregulation in miRNAs is associated with liverdiseases such as hepatocellular carcinoma(14). Pineue et al profiled miRNA expression in tissue samples (104 HCC, 90 adjacent cirrhotic livers, 21 normal livers) as well as in 35 HCC cell lines. They revealed set of 12 miRNAs (including 21, 221/222, 34a, miR-519a, miR-93, miR-96, and let-7c) was linked to disease progression from normal liver through cirrhosis to full-blown HCC and had the highest diagnostic value(103).
Some other studies have been revealed that specific miRNAs modulate various cellular processes in the liver and their aberrant expression correlates with the severity and poor prognosis of HCC. In one study, the expression of 199a, 92, 106a, miR-222, miR-17-5p, miR-18 and miR-20 correlated with the degree of tumor differentiation, suggesting the involvement of these miRNAs in HCC progression(138).
miRNA-122, an abundant liver-specific miRNA that modulates hepatic lipid metabolism(139), is often down-regulated in human HCC(140). Loss of expression of miR-21 correlates with loss of mitochondrial metabolic function that negatively affect on critical liver function, thereby contributing to the morbidity and mortality of liver cancer patients(141).
Examination of miRNAs in HCC with cirrhotic background revealed that members of the let-7 family and miR-145 were down-regulated(142). In these tissues and in HCC cell lines, miR-122 was also down-regulated, and its target gene product, cyclin G1, was highly expressed, promoting the growth of cancer cells(142). Other studies have shown that miRNAs associated with cell cycle inhibition (34a, 101, 199-a-5p and miR-223) were down-regulated in HCC(143) , and those involved in cell proliferation and inhibition of apoptosis (miR-17-92 polycistron, miR-21, miR-96, miR-221 and miR-224) were up-regulated(99, 144-146). Furthermore, miRNA-221 is associated with tumor multifocality(147).
As demonstrated in other examples (Table 1.4 and Figure 1.6), aberrant miRNA expression leads to the dysregulation of critical cellular mechanisms and activation of tumorigenic pathways involved in tumor differentiation, diagnosis, staging, progression, prognosis and response to therapy(139-143, 148-152).
Figure 1.6: Summary of deregulated miRNAs identified in different liver disease. The arrow indicates the abnormal expression pattern of each miRNA in the designated disease. Red, up-regulated; Green, down-regulated(37).
Table 1.4. Differentially expressed miRNAs in liver tissues and hepatocellular carcinoma (HCC)
Sample type Methods miRNA* Cellular
target/Mechanism References Tumor tissue
Tumor tissues, rat model of hepatoma Tumor tissue HCC cell lines Tumor tissues, HCC cell lines HCC cell lines Tumor tissues, HCC cell lines Tumor tissues, HCC cell lines Tumor tissues Human and Woodchuck HCC cell lines Tumor tissues Tumor tissues Tumor tissues Microarray,qPCR Microarray, Northern blot Microarray qPCR Microarray, qPCR Northern blot Western blot, Soft agar assay
qPCR, Western blot Microarray, Northern blot, Western blot Microarray, qPCR qPCR, Northern blot qPCR, Northern blot Microarray, qPCR, Northern blot Microarray miR-199a, miR-92, miR-106a, miR-222, miR-17-5p, miR-18, miR-20
122, let-7a, miR-21, miR-23, miR-130, miR-190, miR-17-92 family miR-122 miR-122 miR-122
let-7 family, miR-145 miR-122 miR-34a miR-101 miR-199-a-5p, miR-223 miR-17-92, miR-21 miR-221 miR-21 miR-224 Tumor progression Tumorigenesis Loss of mitochondrial metabolism NDRG3 Cyclin G1 ADAM17, migration, invasion, anchorage-dependence, angiogenesis, metastasis
c-Met, apoptosis, cell cycle arrest, senescence
Mcl-1, apoptosis, tumor suppression Cell cycle inhibition Cell proliferation, apoptosis CDKN1C/p57, CDKN1B/p27 PTEN Apoptosis inhibitor-5 (138) (148) (141) (149) (142) (150) (151) (153) (143) (144) (99) (145) (146)
1.4.3.
microRNA-221 and HCC
Highly expression of miR-221 has been described as part of a cancer signature in human hepatocellular carcinoma (HCC) and its targeting by tailored treatments has been proposed. (124). The evidence supporting the role of miR-221 in HCC has been mainly focused on the discovery of miR-221 targets as well as on its possible therapeutic exploitations. Negrini in 2008 showed over-expression of miR-221 cause down-regulation of CDKN1B/p27 and CDKN1C/p57, known inhibitors of the cell cycle, indicating a reverse relation between their expressions in HCC. Down-regulation of both CDKN1B/p27 and CDKN1C/p57 occurred in response to miR-221 transfection into HCC derived cells and a significant up-regulation of both CDKN1B/p27 and CDKN1C/p57 occurs in response to antimiR-221 transfection. Also they proved that through controlling these two CDKIs, up-regulation of miR-221 can promote growth of HCC cells by increasing the number of cells in S-phase. Moreover the relevance of these studies in primary tumors matched HCC and cirrhosis samples were assayed for miR-221 as well as for CDKN1B/p27 and CDKN1C/p57 expression. They showed that MiR-221 was up-regulated in 71% of HCCs cases, whereas CDKN1B/p27 and CDKN1C/p57 proteins were down-regulated in 77% of cases. Significantly, the observed down-regulation of CDKIs were not present at the RNA level, indicating that the protein down-regulation was post-transcriptionally regulated. No association was found between miR-221 levels and the causes of underlying liver disease, in particular with viral infections, gender, histopathological grading and a-fetoprotein levels. So they proved In vivo regulation of CDKN1B/p27 and CDKN1C/p57 by miR-221 and suggested that miR-221 has an oncogenic function in hepatocarcinogenesis by targeting CDKN1B/p27 and CDKN1C/p57, hence promoting proliferation by controlling cell-cycle inhibitors(99). Negrini et al in 2009 showed that miR-221 also targets Bmf, a pro-apoptotic BH3-only protein and inhibits apoptosis of HCC cells. The analysis of HCC tissues revealed an inverse correlation between miR-221 and Bmf expression and a direct correlation between Bmf and activated caspase-3, as a marker of apoptosis. They also showed that high miR-221 levels were associated with tumor multifocality and reduced time to recurrence after surgery(147). miR-221 targets other tumor suppressors including phosphatase and tensin homolog, a tissue inhibitor of metalloproteinase-3(100), and the DNA damage-inducible transcript 4 (DDIT4), a modulator of the mTOR pathway(103) in HCC. Almost all of the proposed target genes are associated with hallmark cellular processes that characterize liver cancer cells: apoptotic resistance, increased cell growth
and proliferation and enhanced invasiveness(100). Santhekadur et al in 2012, unraveled a linear pathway in which SND1-induced activation of NF-κB resulted in induction of miR-221 and subsequent induction of angiogenic factors Angiogenin and CXCL16. Because SND1 regulates NF-κB and miR-221, two important determinants of HCC controlling the aggressive phenotype, they suggested SND1 inhibition might be an effective strategy to counteract this fatal malady(92). Recently, Fornari et.al was identified, MDM2, a known p53 (TP53) modulator, as a direct target of miR-221 and a feed-forward loop was described that sustains miR-221 aberrant expression. Interestingly, miR-221 can activate the p53/MDM2 axis by inhibiting MDM2 and, in turn, p53 activation contributes to miR-221 enhanced expression. Moreover, by modulating p53 axis, miR-miR-221 impacts cell cycle progression and apoptotic response to Doxorubicin in HCC-derived cell lines. Finally, CpG island methylation status was assessed as a causative event associated with miR-221 up-regulation in HCC cells and primary tumor specimens. In HCC-derived cell lines, pharmacologically-induced DNA hypomethylation potentiated a significant increase in miR-221 expression. These data were confirmed in clinical specimens of HCC in which elevated miR-221 expression was associated with the simultaneous presence of wild-type p53 and DNA hypomethylation. In all, they revealed a novel miR-221 sustained regulatory loop that determines a p53-context-specific response to Doxorubicin treatment in HCC(154).
Yuan et al in 2013 hypothesized that modulation of miR-221 targets in primary hepatocytes enhances proliferation, providing novel clues for enhanced liver regeneration. They demonstrated that miR-221 enhances proliferation of in vitro cultivated primary hepatocytes. Furthermore they showed that adeno-associated virus-mediated over-expression of miR-221 in the mouse liver also accelerates hepatocyte proliferation in vivo. They identified Aryl hydrocarbon nuclear translocator (Arnt) messenger RNA (mRNA) as a novel target of miR-221, which contributes to the pro-proliferative activity of miR-221 and concluded that Pharmacological intervention targeting miR-221 may thus be therapeutically beneficial in liver failure by preventing apoptosis and by inducing liver regeneration(155). In 2011 Sharma et al. showed that ectopic expression of miR-221 protects primary hepatocytes and hepatoma cells from apoptosis. Importantly, in vivo over-expression of miR-221 by adeno-associated virus serotype 8 (AAV8) delays FAS-induced fulminant liver failure in mice. Additionally they demonstrate that miR-221 regulates hepatic expression of p53 up-regulated modulator of apoptosis (Puma), a well-known
proapoptotic member of the Bcl2 protein family. They suggested that miR-221 may serve as a potential therapeutic target for the treatment of hepatitis and liver failure(156).
Expression patterns of miRNAs and their role in the pathogenesis of hepatocellular carcinoma (HCC) was assessed by Pineau et. al. using 104 HCC, 90 adjacent cirrhotic livers, 21 normal livers as well as in 35 HCC cell lines. miR-221/222, the most up-regulated miRNAs in tumor samples, are shown to target the CDK inhibitor p27 and to enhance cell growth in vitro. In addition, they showed, using a mouse model of liver cancer, that miR-221 over-expression stimulates growth of tumorigenic murine hepatic progenitor cells. Taken together, these data revealed an important contribution for miR-221 in hepatocarcinogenesis and suggested a promising approach to liver cancer treatment(103). Park et al in 2011 conducted a preclinical investigation of the therapeutic efficacy of oligonucleotides directed against the oncogenic microRNA miR-221, which has been implicated in HCC. Chol-anti-miR-221 significantly reduced miR-221 levels in liver within a week of intravenous administration and in situ hybridization studies confirmed accumulation of the oligonucleotide in tumor cells in vivo. In the same period, chol-anti-miR-221 reduced tumor cell proliferation and increased markers of apoptosis and cell-cycle arrest, elevating the tumor doubling time and increasing mouse survival. They offered a preclinical proof of efficacy for chol-anti-miR-221 in a valid orthotopic mouse model of HCC, suggesting that this targeted agent could benefit treatment for patients with advanced HCC(79). The relationship between miR-221 over-expression and clinicopathological parameters in HCC formalin-fixed paraffin-embedded (FFPE) tissues was showed by Rong et.al. in 2013. They showed the relative expression of miR-221 in clinical TNM stages III and IV was significantly higher than that in the stages I and II. The miR-221 level was also up-regulated in the metastatic group compared to the non metastatic group. Furthermore, miR-221 over-expression was related to the status of tumor capsular infiltration in HCC clinical samples. Functionally, cell growth was inhibited, cell cycle was arrested in G1/S-phase and apoptosis was increased by miR-221 inhibitor in vitro. Likewise, miR-221 mimic accelerated the cell growth. They concluded that expression of miR-221 in FFPE tissues could provide predictive significance for prognosis of HCC patients. Moreover, miR-221 inhibitor could be useful to suppress proliferation and induce apoptosis in HCC cells. Thus miR-221 might be a critical targeted therapy strategy for HCC(157). High expression of miRNA-221 also can be used to predict local recurrence of HCC, and fold changes in miRNA-221 less than 1 can be used as a predictive