UNIVERSITÀ DEGLI STUDI DI MESSINA
Dipartimento diScienze Chimiche, Biologiche, Farmaceutiche ed Ambientali Dottorato di Ricerca in “Scienze Chimiche”
Doctor of Philosophy in “Chemical Sciences”
Analysis of food and food-related compounds by using
advanced chromatography techniques
Ph.D. Thesis of: Ivan ALOISI
Supervisor: Prof. Peter Q. TRANCHIDA
Coordinator: Prof. Paola DUGO
SSD CHIM/10 XXXIII Ciclo 2017-2020
TABLE OF CONTENTS
1.0 Introduction and scope of the research 1
2.0 Theory of chromatography 6
2.1 Introduction 6
2.2 Fundamental chromatographic parameters 8
2.2.1 Retention 8 2.2.2 Separation 10 2.2.3 Column efficiency 12 3.0 Gas chromatography 17 3.1 Introduction 17 3.2 Columns 18 3.3 Detectors 21
3.3.1 Flame ionization detector 23
3.3.2 Mass spectrometry 24
3.3.2.1 Quadrupole mass spectrometry 28
3.3.2.2 Triple quadrupole mass spectrometry 29
3.3.2.3 Time-of-flight mass spectrometry 31
4.0 Comprehensive two-dimensional gas chromatography 40
4.1 Introduction 40
4.2 Concept of multidimensionality 41
4.3 Column configurations 46
4.4 Modulators 48
4.4.1 Modulation ratio and phase of modulation 50
4.4.2 Types of modulator 51
4.5 Thermal modulation 52
4.5.1 Heater-based modulators 52
4.5.1.1 Thermal desorption modulator (TDM) 53
4.5.1.2 Thermal sweeper modulator 54
4.5.2 Cryogenic design modulators 55
4.5.2.1 Longitudinal modulated cryogenic system (LMCS) 55
4.5.2.2 Dual-stage jet modulators 56
4.6 Flow modulation 62
4.6.1 Differential flow modulators 62
4.6.2 Diverting flow modulators 68
4.7 Recent application and instrumental trends 71
5.0 Research in the field of food products 80
5.1 Analysis of the unsaponifiable fraction of vegetable oils by using cryogenically-modulated comprehensive two-dimensional gas chromatography-high resolution time-of-flight mass spectrometry and lipids high resolution database generation 80
5.1.1 Introduction 81
5.1.2 Experimental 82
5.1.3 Results & Discussion 83
5.1.4 Conclusions 90
5.2 Comprehensive two-dimensional gas chromatography-mass spectrometry using
milder electron ionization conditions: a preliminary evaluation 92
5.2.1 Introduction 93
5.2.2 Experimental 95
5.2.3 Results & Discussion 97
5.2.4 Conclusions 107
5.3 Chemical characterization of unconventional palm oils from Hyophorbe indica and
two other endemic Arecaceae species from Reunion Island 110
5.3.1 Introduction 111
5.3.2 Experimental 113
5.3.3 Results & Discussion 116
5.3.4 Conclusions 123
5.4 Towards the determination of an equivalent standard column set between cryogenic
and flow-modulated comprehensive two-dimensional gas chromatography 127
5.4.1 Introduction 128
5.4.2 Experimental 129
5.4.3 Results & Discussion 132
5.5 Evaluation of the fatty acid content in dietary supplements by using a fully-automated robotic station and gas chromatography with simultaneous mass
spectrometry and flame ionization detection 141
5.5.1 Introduction 141
5.5.2 Experimental 141
5.5.3 Results & Discussion 143
5.5.4 Conclusions 145
5.6 Thin layer chromatography-bioassay screening for the identification of
acetylcholinesterase inhibitor terpenoids from orange by-products 147
5.6.1 Introduction 147
5.6.2 Experimental 149
5.6.3 Results & Discussion 151
5.6.4 Conclusions 155
5.7 Evaluation of the modulation performance of a novel commercial diverting flow modulator in the context of comprehensive two-dimensional gas chromatography
time-of-flight mass spectrometry analysis of a fish oil sample 158
5.7.1 Introduction 158
5.7.2 Experimental 158
5.7.3 Results & Discussion 159
5.7.4 Conclusions 161
INTRODUCTION AND SCOPE OF THE RESEARCH 1
Chapter 1
1.0 Introduction and scope of the research
The objective of the research work, described in this Ph.D. thesis, is the development of modern analytical techniques, and improvement of established methods, for the detection, identification and characterization of complex food and food-related compounds.
In particular, the research was focused on the development and application of mono-dimensional gas chromatography (1D GC) and comprehensive two-dimensional gas chromatography (GC×GC) combined with different types of detectors (mainly mass spectrometers). Different food and food-related samples were subjected to study (i.e., vegetable oils, dietary supplements, food waste, etc.). A great deal of attention was focused on compounds potentially contained in dietary supplements (in particular, fatty acids and phytosterols).
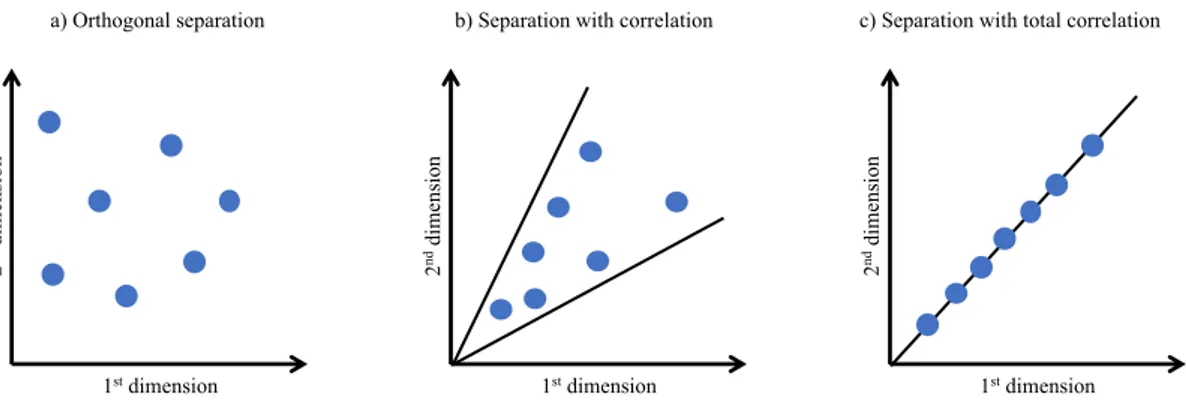
Since the introduction of open-tubular capillaries (OTC) by Golay [1], GC has become one of the most powerful analytical techniques for the analysis of volatile and semi-volatile compounds. Nevertheless, considering that one 1D GC separations often rely on a single separation criterion, such as the different volatility of the analytes, if the vapor pressure of several analytes in a mixture do not differ sufficiently, then coelution(s) will occur. In this case, to achieve the separation of these coeluting compounds, it will be necessary to apply a further separation criterion, such as their different polarity. If each separation mechanism employed for the resolution of a complex mixture is defined as a separation “dimension”, then we are in the presence of a multidimensional approach. The most powerful multidimensional GC approach, capable of a very high resolving power, is represented by the GC×GC. The concept of GC×GC was introduced in the early 1990s by Liu and Phillips [2], bringing a great improvement to the GC field. The introduction of GC×GC can be considered at the same level of OTC, in terms of the revolutionary impact that it has had on the separation science field. Since its first appearance nearly thirty years ago, many
improvements have been made in the GC×GC field, in terms of practical/theoretical studies, hardware and software.
Here is a brief introduction regarding the food-related applications carried out during these three years of Ph.D. course.
Many vegetable oils were investigated by the use of comprehensive two-dimensional gas chromatography combined with high resolution time-of-flight mass spectrometry (HR ToFMS) for the untargeted analysis of high molecular weight constituents (sterols, triterpenic alcohols, tocopherols and squalene) and also for the generation of a high resolution time of flight mass spectrometry database containing the mass spectra of the main derivatized sterols compounds (section 5.1) [3].
A sample of extra virgin olive oil (focus was devoted to the phytosterol fraction), a mixture of pesticides and a mixture of fatty acid methyl esters were analyzed by the use of comprehensive two-dimensional gas chromatography-quadrupole mass spectrometry, employing common electron ionization energy (70eV) and “milder” electron ionization conditions (40, 25 and 20 eV). The effects of using lower source temperatures were also evaluated. The use of “milder” ionization energy led to a general increase in the relative abundance of higher-mass diagnostic fragments, while the reduction of source temperatures favored a further enhancement of the higher mass ions (section 5.2) [4].
Comprehensive two-dimensional gas chromatography-quadrupole mass spectrometry was also employed for the characterization of unconventional palm oils deriving from three endemic Arecaceae species coming from Reunion Island (section 5.3) [5].
For what concerns food waste, a complex sample of bio-oil, derived from the pyrolysis process of coconut fibers, was analyzed for the determination of an equivalent column set between cryogenic and flow-modulated comprehensive two-dimensional gas chromatography (section 5.4) [6].
The use of gas chromatography was exploited for the analysis of fatty acids in dietary supplements. Fatty acid derivatization was performed by using a direct derivatization protocol previously reported [7]. In detail, a robotic preparative station enabled automatic derivatization in a fully automatic manner. With regards to the GC separation, a medium-polarity ionic liquid column was used. Dual detection was
INTRODUCTION AND SCOPE OF THE RESEARCH 3
performed by splitting the eluate between a triple quadrupole mass spectrometer (in this case used as a single quadrupole) and a flame ionization detector. This choice allowed the possibility to obtain quali-quantitative results, in a single run (section 5.5).
During the Ph.D. course, I spent six months in Madrid (Spain) at CIAL (Instituto de Investigatión en Ciencias de la Alimentatión), using monodimensional and bidimensional thin layer chromatography for the separation of terpenes in orange extracts. The main objective of this research work (still in progress) was to investigate the principal bioactive terpenoids with acetylcholinesterase inhibitor activity derived from orange juice by-products (section 5.6).
The use of a novel commercial type of pneumatic modulator was exploited for the determination of fish oil fatty acids (section 5.7).
Finally, during the Ph.D. course, other applications, not related to food products, were carried out. The use of GC×GC coupled with HR ToFMS was exploited for target analysis and absolute quantification of organic sulphur compounds (OSCs) in coal tar. The method developed allowed the pinpointing of 60 OSCs, belonging to 14 different classes. Absolute quantitative information was obtained for 8 OSCs, which can provide a good albeit approximate idea on the concentration of each chemical class in the petrochemical sample under investigation [8].
A mixture of 64 fragrance allergens in cosmetics was employed for the evaluation of an equivalent column set between cryogenic and flow-modulated comprehensive two-dimensional gas chromatography [9]. The main objective of this study was to confirm the results attained previously on a sample of bio-oil [6].
Two review articles were also published in the context of current state of comprehensive two-dimensional gas chromatography. Here is a brief description.
The information on current trends in the field of the hyphenated technology GC×GC-MS, representing the most powerful analytical tool today-available for the analysis of mixtures formed of volatile compounds, were summarized [10]. Focus was devoted to various aspects of mass spectrometry, in particular to ionization methodologies. The information reported relates mainly to 2014-2017 period. The Scopus database was consulted, leading to a number of 343 papers, with these reporting on the use of 5 forms of MS. Regarding the MS types: low resolution (LR) ToFMS was by far the most popular choice (66%), followed by quadrupole (Q) MS
(20%). The third position was occupied by HR ToFMS (8%). Two remaining forms of MS (both multianalyzer types), namely quadrupole time-of-flight (QToF) and triple quadrupole (QqQ) MS, have been reported in only 12 and 6 investigations, respectively. For what concerns the process of ionization the electron ionization maintains its dominating role.
Recent application and instrumental trends relate to the combined period 2018 to 2019 were summarized in a recent review article [11]. The information related to the present review is reported in section 4.7.
INTRODUCTION AND SCOPE OF THE RESEARCH 5
References:
[1] M.J.E. Golay, in: Gas Chromatography, Academic Press, New York, USA, (1958). [2] Z. Liu, and J.B. Phillips, J. Chromatogr. Sci. 29 (1991) 227.
[3] I. Aloisi, M. Zoccali, P. Dugo, P.Q. Tranchida, L. Mondello, Food Anal. Method. 13 (2020) 1523.
[4] P.Q. Tranchida, I. Aloisi, B. Giocastro, M. Zoccali, L. Mondello, J. Chromatogr. A. 1589 (2019) 134.
[5] Y. Caro, T. Petit, I. Grondin, P. Clerc, H. Thomas, D. Giuffrida, B. Giocastro, P. Q. Tranchida, I. Aloisi, D. Murador, L. Mondello, L. Dufossé, Nat. Prod. Res. 34 (2019) 93.
[6] I. Aloisi, T. Schena, B. Giocastro, M. Zoccali, P.Q. Tranchida, E.B. Caramão, L. Mondello, Anal. Chim. Acta. 1105 (2020) 231.
[7] G. Micalizzi, E. Ragosta, S. Farnetti, P. Dugo, P.Q. Tranchida, L. Mondello, F. Rigano, Anal. Bioanal. Chem. 412 (2020) 2327.
[8] I. Aloisi, M. Zoccali, P.Q. Tranchida, L. Mondello, Separations 7 (2020) 1. [9] B. Giocastro, I. Aloisi, M. Zoccali, P.Q. Tranchida, L. Mondello, LC-GC North Amer. 38 (2020) 548.
[10] P.Q. Tranchida, I. Aloisi, B. Giocastro, L. Mondello, TrAC Trends Anal. Chem. 105 (2018) 360.
Chapter 2
2.0 Theory of chromatography
2.1 Introduction
Chromatography represents a physical method of separation, in which the components of a sample are selectively distributed between two immiscible phases. The mobile phase, flowing through a stationary phase, carries the analytes. The separation occur thanks to the differences in the distribution coefficient of the individual sample components.
The “official” definitions of the International Union of Pure and Applied Chemistry (IUPAC) are: “Chromatography is a physical method of separation in which the components to be separated are distributed between two phases, one of which is stationary (stationary phase) while the other (the mobile phase) moves in a definite direction. Elution chromatography is a procedure in which the mobile phase is continuously passed through or along the chromatographic bed and the sample is fed into the system as a finite slug” [1].
The discovery of chromatography dates back to the early twentieth when Ramsey [2] separated a mixture of gases and vapors on adsorbents likes charcoal and Michail Tswett [3] observed that colored pigments of vegetable origin were individually separated in bands when they were injected in a column of glass filled with calcium carbonate. Tswett is credited as being the “father of chromatography” inasmuch that he coined the term chromatography (χρώμα, color and γραφή, graphy) and also because he scientifically described the process.
It is possible to classify column chromatographic separations in three different ways: by the physical state of the mobile phase and stationary phase; by the type of contact between the mobile phase and the stationary phase; or by the chemical or physical mechanism responsible for separating the analytes. Based on the mobile phase used, chromatography could be named as GC, liquid chromatography (LC), and
THEORY OF CHROMATOGRAPHY 7
supercritical fluid chromatography (SFC). The classification of main column chromatography techniques is summarized in Figure 2.1.
Figure 2.1. Schematics of various chromatographic methods. Abbreviations: OT - open tubular; WCOT - wall coated open tubular; SCOT - support coated open tubular; PLOT - porous layer open tubular; LSC - liquid-solid chromatography; BPL - bonded-phase chromatography; IEC – ion exchange chromatography; SEC - size exclusion chromatography
The detector, placed at the end of the column, provides a record of the chromatography as a chromatogram. Usually, the detector signals are proportionate to the amount of each analyte making possible, if required, quantitative analysis. Hence, the chromatogram generated is a plot of the sample concentration (y-axis) versus time (x-axis). It represents the individual component bands, separated by the chromatographic column and modified by a variety of physical processes into a peak shape. An example of chromatogram is reported in Figure 2.2.
Figure 2.2. Example of a chromatogram with three peaks isothermally eluted.
Column chromatography Gas Liquid LSC BPC IEC SEC Packed OT GSC GLC WCOT PLOT SCOT Time D et ec tor s igna l int ens it y 0 t1 t2 t3
Each chromatographic peaks represents at least one chemical substance. The position of a peak on the time scale of the total chromatogram give some qualitative information while the area under a peak is related to the amounts of individual substances separated in time space.
2.2 Fundamental chromatographic parameters
The primary purpose of chromatography is the separation of a sample in a series of chromatographic peaks, each representing, ideally, a single component. The most important chromatographic parameters are described as follows.
2.2.1 Retention
As shows in Figure 2.2, different analytes of a sample appear at the column outlet at different times. The first component eluted is the one that is not retained at all by the stationary phase. The time measured between the injection and the maximum of the first peak (tM) is defined as retention time of the unretained solute, or in gas
chromatography the gas hold up time. The time between the sample introduction and the maximum of the retained peak is the total retention time (tR) of the analyte. This
value is the sum of two time values:
𝑡" = 𝑡$+ 𝑡′"
Eq. 2.1 Where tM is the hold up time, while t’R represent the time the molecules of the analyte
spend in the stationary phase (otherwise defined adjusted retention time). The retention time could be defined also with the following equation:
𝑡" = 𝑡$(1 + 𝑘)
Eq. 2.2 where k is the capacity factor. The capacity factor is further defined as:
𝑘 = 𝐾 𝑉 -𝑉$
THEORY OF CHROMATOGRAPHY 9
where K is distribution coefficient of the solute (expressing the distribution between the stationary and the mobile phases), VS is the volume of the stationary phase, and Vm
is the volume of the mobile phase in a chromatographic column. The distribution coefficient can be calculated:
𝐾. =
𝐶 -𝐶$
Eq. 2.4 where Cs and Cm are the analyte concentration in the stationary and mobile phases,
respectively. According to Eqs. 2.2 and 2.3, retention depends on different variables: (a) the chemical nature of the column phase and its temperature, as reflected by the distribution coefficient; (b) the ratio of the phase volumes in the column VS/VM; and
(c) the value of tM. These variables are optimized in order to maximize the component
separation and the total time of analysis. Based on the retention time of an unretained component (tM) and the column length it is possible to calculate the average linear
velocity (𝑢1) of the mobile phase:
𝑢1 = 𝐿 𝑡$
Eq. 2.5 The flow rate (F), is usually expressed as mL/min and through a column with internal diameter dc is calculated by:
𝐹 = 𝜋𝑑67𝑒
9𝑢
Eq. 2.6 where εu represent the fraction of the column occupied by mobile phase between the
particles and in the pores. The so-called retention volume VR is a product of the
retention time and volumetric flow-rate:
𝑉" = 𝑡"𝐹
Since retention times represent in some manner the nature of the solute, a means of their comparison must be available. Within a given chemical laboratory, relative retention times (the values relative to an arbitrarily chosen chromatographic peak) are frequently used: 𝑎;,7 = 𝑡"7 𝑡";= 𝑉"7 𝑉";= 𝐾7 𝐾; Eq. 2.8 This equation is also a straightforward consequence of Eqs. 2.2 and 2.3. Since the relative retention represents the ratio of distribution coefficients for two different solutes, it is frequently used (for the solutes of selected chemical structures) as a means to judge selectivity of the solute-column interactions.
2.2.2 Separation
The success of a separation method is primarily dependent on increasing the differences in retention times of the individual sample components. The capacity of a chromatographic system to separate two analytes from each other is named selectivity. The selectivity factor α for two components is calculated by:
𝑎 =𝑘7 𝑘; =
𝑡"7− 𝑡$
𝑡";− 𝑡$
Eq. 2.9 where k1 and k2 represent the retention factors and tR1 and tR2 are the retention times of
the two analytes. The selectivity factor is greater or equal to one. An additional variable of such a separation process is the width (w) of the corresponding chromatographic peak. By the peak width and the retention time it is possible to evaluate resolution. The term resolution (R) is used to express the degree to which adjacent peaks are separated, and is defined as:
𝑅 = 0.5(𝑤𝑡"7− 𝑡";
7+ 𝑤;)=
2∆𝑡"
𝑤7+ 𝑤;
THEORY OF CHROMATOGRAPHY 11
where w1 and w2 represent the peak widths of the two compounds at the base. The
degree of separation between two chromatographic peaks improves with an increase in R. Thus, R is a quantitative measure of the effectiveness of a separation process. In Figure 2.3c a situation where two sample components are eluted too closely together is showed, so that the resolution of their respective solute zones is incomplete; Figure 2.3b represents a situation where the two components are resolved from each other through choosing a (chemically) different stationary phase that retains the second component more strongly than the first one; finally, Figure 2.3a shows the two peaks totally resolved, thus representing the most “efficient” handling of the two components.
Figure 2.3. Peak resolution.
D et ec tor s igna l Time 0 1 2 3 4 5 6 7 8 9 10
a
b
c
A
A
A
B
B
B
High Resolution Moderate Resolution Low Resolution WA WB (tR)B (tR)A2.2.3 Column efficiency
In order to obtain optimal separations, sharp, symmetrical chromatographic peaks must be acquired; for this reason band broadening must be reduced. It is also suitable to measure the efficiency of the column, which is defined by the number of theoretical plates, N. The latter is calculated by:
𝑁 = 16 G𝑡" 𝑤H 7 = 5.54 J 𝑡" 𝑤;/7L 7 = 2𝜋 GℎN𝑡" 𝐴 H 7 Eq. 2.11 where w1/2 represent the peak width at half-height, hp peak height and A peak area. The
equation 2.11 yields correct results only if the peak has a Gaussian shape. In case of asymmetric peaks an approximate value of N can be calculated by the following equation [4]: 𝑁 = 41.7Q𝑡 " 𝑤 R.; S T 𝑇 + 1.25 Eq. 2.12 where w0.1 is the peak width at 10% of the peak height and T is the tailing factor:
𝑇 =𝑏R.; 𝑎R.;
Eq. 2.13 where a0.1 and b0.1 are the sections (distances from the peak front to the maximum and
from the maximum to peak end, respectively) of the peak width at 10% of the peak height.
The number of theoretical plates depends on column length L: the longer the column, the higher the number of the plates. Therefore, another term has been introduced relating the plate number to column length. This is the plate height H (HETP = height equivalent to a theoretical plate), which can be calculated:
THEORY OF CHROMATOGRAPHY 13
𝐻 = 𝐿 𝑁
Eq. 2.14 The width of a chromatographic peak is influenced by a series of parameters, which are taken into account in the van Deemter equation. The Van Deemter equation identifies three effects that contribute to band broadening in packed columns:
𝐻 = 𝐴 +𝐵 𝑢1+ 𝐶𝑢1
Eq. 2.15 where A accounts for multiple paths, B/u for longitudinal diffusion, and Cu for solute mass transfer in the stationary and mobile phases, them being the experimental factors contributing to the broadening of a solute’s chromatographic band. Factor A (Eddy diffusion) accounts for the fact that the solute molecules, while passing through the column, take random paths between the stationary phase particles. These different paths with different lengths will cause broadening of the solute band. Factor B (longitudinal diffusion) is related to the fact that the concentration of the analyte is lower at the edges of the band with respect to the center. Analytes diffuse out from the center to the edges, causing also band broadening. The effect of this factor is decreased when the velocity of the mobile phase is high. The factor C (resistance to mass transfer) depends on the fact that the analyte takes a certain time to equilibrate between the stationary and mobile phase. If the velocity of the mobile phase is high and the analyte has a strong affinity for the stationary phase, then the analyte in the mobile phase will move ahead of the analyte in the stationary phase and the band is broadened. The higher the velocity of the mobile phase, the worse the broadening becomes. Figure 2.4 represents the plot of the height of a theoretical plate as a function of mobile-phase velocity, the so-called van Deemter curve. The optimum flow rate and the contributions to the terms A, B/u, and Cu are also shown.
Figure 2.4. Plot of the height of a theoretical plate as a function of mobile-phase velocity (using the van Deemter equation). The contributions to the terms A, B/u, and Cu are also shown.
Since the theory of open tubular column was introduced in 1956 by M. J. E. Golay, the absence of any packing material inside the column modified the van Deemter equation excluding factor A (Eddy diffusion). This deduction was pointed out by Golay himself, who also suggested a new term to deal with the diffusion process in the mobile phase of open tubular columns [5]. Eq. 2.16 contains two C factors connected to the mass transfer in the stationary phase, CS and another for the mass transfer in the mobile
phase, CM [6].
𝐻 =𝐵
𝑢1 + (𝐶-+ 𝐶$)𝑢1
Eq. 2.16 The efficiency of a separation system is well demonstrated by its peak capacity, nc,
which represent the number of solutes that can theoretically be resolved at the baseline on a given column. An estimate of a column’s peak capacity for a retention time window from time t1 to t2 is given by:
𝑛Z = 1 +√𝑁 4𝑅 ln G 𝑡7 𝑡;H = 1 + √𝑁 4 ln(1 + 𝑘^_`) = 1 + √𝑁 4 ln G 𝑉^_` 𝑉^abH Eq. 2.17 B/u A Total Cu
THEORY OF CHROMATOGRAPHY 15
where Vmin and Vmax are the smallest and largest volumes of mobile phase in which a
solute can be eluted and detected [7]. This estimation is valid for isocratic elution. The peak capacity in gradient elution is generally higher and can be calculated by:
𝑛Z =√𝑁 4 G
𝑡7
𝑡;− 1H + 1
References:
[1] L.S. Ettre, Pure Appl. Chem. 65 (1993) 819. [2] W. Ramsey, Proc. Roy. Soc. A76 (1905) 111.
[3] M. Tswett, Ber. Dtsch. Botan. Ges. 24 (1906) 316 and 384. [4] J.P. Foley, and J.G. Dorsey, Anal. Chem. 55 (1983) 730.
[5] M.J.E. Golay, in: Gas Chromatography, Academic Press, New York, USA, (1958). [6] H.M. McNair, and J.M. Miller, in: Basic Gas Chromatography, Wiley & Sons, New York, (1998).
GAS CHROMATOGRAPHY 17
Chapter 3
3.0 Gas chromatography
3.1 Introduction
Gas chromatography is a physical separation technique in which a gas is the mobile phase. Today, this methodology is used in scientific investigations, petroleum technology, environmental pollution control and in many scientific areas. The first paper reporting the use of GC was published in 1952 [1] by Martin and his co-worker James.
The technique is limited to volatile and semi-volatile (low-molecular-weight) compounds. The principle of separation is the relative affinity of the components to the stationary phase, while the mobile phase (a gas) migrates them through the system. Ettre published several papers retracing the history of chromatography. Three of the most representative articles are: the first one regarding the work of Tswett, Martin, Synge, and James [2]; the second one highlighting the progress of GC instruments [3]; and the third, which contained over 200 references on the overall progress of chromatography [4].
The indispensable parts of the gas chromatographic system are represented in Figure 3.1. The column is the most important part of the instrumentation, because inside of it the physiochemical process of separation occurs. The separation column contains the stationary phase, while the mobile phase (the carrier gas) is flowing through this column from a pressurized gas cylinder. The rate of mobile-phase delivery is controlled by a pressure and/or flow-regulating unit (carrier gas flow controller).
Usually, in GC, the sample is introduced through the use of a syringe inside the sample injector. The whole sample, or a part of it, is transferred from the injector to the chromatographic column, where the separation occurs by the continuous redistribution between the mobile and the stationary phases. On the basis of their different affinities for the stationary phase, the individual components, eventually form their own concentration bands, which reach the column outlet at different times. A
detector is situated at the column outlet to identify and, if required quantify, the single components eluting from the column.
A typical gas chromatograph has three independently controlled thermal zones: the injector zone that ensures rapid volatilization of the introduced sample; the oven temperature that is controlled to optimize the separation process; and the detector zone that must be at temperatures where the individual sample components are measured in the vapor phase.
Figure 3.1. The main components of a gas chromatograph.
3.2 Columns
Gas chromatography columns can be divided into two main groups: packed columns, and OTC columns, showed in Figure 3.2.
A packed column (Figure 3.2a) is a tube, made from glass or metal, filled with a granular material. This kind of column is connected to the instrument through a gas-tight connection. The mobile phase flowing between the particles, while the sample molecules interact with the stationary liquid phase adsorbed on the inert granular material. Column inner diameters are 1-4 mm, and the lengths are 1-3 m, even if departures from these dimensions may exist for special applications. The granular packing can be either an adsorbent (if the method of choice is gas-solid chromatography) or an inert solid support that is impregnated with a defined amount of a liquid stationary phase (for gas-liquid chromatography). In either case, packing
GAS CHROMATOGRAPHY 19
materials with uniformly small particles are required, because the column performance is strongly dependent on the particle size. In fact, a distinct advantage of small particles is their closer contact with diffusing sample molecules and a greater number of the mentioned equilibrium units (i.e., theoretical plates). Regarding gas-solid chromatography, the solute molecules interact with the surface of solid adsorbents through relatively weak physical adsorption forces because the adsorption process must be reversible. Silica gel, alumina, zeolites, carbonaceous adsorbents, are some examples of suitable GC adsorbents.
Figure 3.2. Schematic representation of (a) packed column and (b) open tubular column.
Gas-liquid chromatography has found considerable use in chemical analysis. The packing materials (solid supports) utilized in this method are similar to the described adsorbents even if they serve only as a supporting medium for the liquid stationary phase and do not participate directly in the separation process. The most commonly used solid supports are the diatomaceous earths that are fossil-originated minerals found in abundance in various parts of the world. The diatomaceous earths are basically siliceous materials that contain reactive surface structures, the silanol groups. Since such groups could adversely affect the chromatographic analyses, causing “tailing” of certain polar sample components, they are effectively blocked (deactivated) by a silylation reaction. The solid support is subsequently impregnated by a liquid stationary phase.
The theory of the OTC column, already discussed, was introduced in 1956 by M. J. E. Golay. A schematic representation of a capillary column is showed in Figure 3.2b. Thanks to the high separation efficiencies, OTC column have substantially improved
Liquid Phase
Solid Support Fused Silica
a b
1/8"OD
Packed Column
0.25 mm ID Open Tubular Column
analytical separations. The absence of packing material inside the capillary column is the principal advantage. The stationary liquid phase is distributed as a thin film on the surface of the inner wall of the column. Usually, capillary columns have a length ranging from 10 to 100 meters and an internal diameter ranging from 0.1 mm to 0.5 mm. Capillary columns allow to obtain narrow chromatographic peaks and a high degree of resolution among the individual components of complex mixtures. In Figure 3.3 the improved resolution of a capillary column over a packed column is evident. The constituents of Calmus oil are separated from each other by the use of a capillary column (Figure 3.3a) and a packed one (Figure 3.3b). It is evident that packed columns allow the resolution of a limited number of compounds compared with a capillary column. The reason of an increase in separation power is connected to the high permeability to the carrier gas (absence of any column packing).
Figure 3.3. Comparison between the resolution achieved with (a) capillary columns and (b) packed columns for a sample of Calmus oil. From K. Grob, and G. Grob, Pratical capillary gas chromatography – a systematic approach. J. High Resolut. Chromatogr. 3 (1979) 109.
There is also a third type of a GC column: the porous layer, open tubular columns. This column has an inner diameter and a length similar to the wall-coated columns, but the inner wall is modified through a deposition of finely dispersed particles. The porous layer can be an adsorbent or a thin layer of the solid support impregnated with a liquid stationary phase. In this case, the efficiency is not as high as those of a
GAS CHROMATOGRAPHY 21
conventional capillary column, but the greater sample capacity is an advantage in some cases. The enhanced sample capacity is obtained because of a greater surface area of such columns and, consequently, a relatively larger amount of stationary phase.
3.3 Detectors
The detector plays a crucial role in the entire process of GC analysis. The success of GC as an analytical method is also connected to the early development of highly sensitive and reliable means of detection. At the column outlet the detector provides information regarding the distribution of individual peaks within a chromatogram (which compound?) and also their relative amounts (how much?).
In one of the first books about detectors, David described about 20 detectors that were already popular in the 1970s [5].
Detectors can be classified into two large families: universal and selective detectors. Universal detectors permit to measure nearly all components present in a mixture, although their response to the same quantities of different compounds is not similar. Instead, selective detectors generate a response only to mixture components that contain a unique structural feature in their molecular structure. To give an example, gasoline sample contains a huge number of compounds belonging to different classes. Near to all the compounds of gasoline can be detected by the use of an universal detector. Instead, using, for example, a nitrogen-selective detector, only a few peaks are recorded, that are nitrogen-containing compounds in gasoline, while the others mixture constituents are not detected.
An acceptable GC detector must have several analytical properties, such as sensitivity, linearity over an extensive concentration range, long-term stability, and ease of operation. A satisfactory sensitivity values allows detectors to determinate solute quantities between 10-6 and 10-9g, and for some selective detectors it is possible
to reach values of 10-15g, representing some of the most sensitive measurement
techniques available to the chemist.
Some detectors principles are correlated to the measurement of certain transport properties of the solutes (e.g. thermal conductivity), while others detectors work as transducers, measuring ultimately some product of a solute molecules (e.g. gas-phase ionization products).
Apart from the flame ionization detector (FID) and MS detector, which are reported in the following two subsections, a brief overview of other detectors is herein reported. Almost all the first GC systems were equipped with a thermal conductivity detector (TCD). Nowadays, this detector is popular principally for packed columns and inorganic analytes, such as H2O, CO, CO2, and H2. The operation of TCD is based on
the measurements of the difference in thermal conductivity of pure carrier gas and the carrier gas plus solute.
The electron capture detector (ECD) is an instrument based on certain gas-phase ionization phenomena inside the ionization chamber. The ECD is a selective detector since only certain compounds exhibit appreciable affinities toward the low-energy electrons. Among the structures exhibiting strong electron affinities are various halogenated compounds, nitrated aromatics, highly conjugated systems, and metal chelates. The detector is extremely sensitive (amounts between 10−12 and 10−15 g can
be detected) to various pesticides, herbicides, dioxins, freons, and other substances of great environmental importance.
The atomic emission detector (AED) is an instrument that allows to measure up to 23 elements: a He plasma chamber collects the GC effluent, and due to the high temperature encountered therein, the analytes are then decomposed to their constituent atoms. The AED is characterized by high level of sensitivity for almost all of the important elements, a linear range with an extension of three to five orders of magnitude, and an element versus carbon selectivity of four to five orders of magnitude [6].
The thermionic ionization detector (TID) is a selective instrument usually utilized for the detection of N and P-containing compounds (it is also defined as the nitrogen phosphorous detector, NPD). The TID is structurally similar to the FID, apart from the presence of a ceramic bead doped with an alkali metal salt, located above the jet. It is assumed that electronegative decomposition products, derived from compounds containing N or P, are ionized through extraction of an electron from the bead surface. Later, the negative ions are directed to a collector electrode. The application of TID is mainly for pesticides.
The helium ionization detector (HID) is a sensitive and universal instrument, utilized principally for compounds with no or a low FID response, and present in low
GAS CHROMATOGRAPHY 23
concentrations for the TCD. The HID promotes photon-induced ionization processes and has the capability to ionize compounds with an ionization potential of <19.8 eV [7].
3.3.1 Flame ionization detector
This detector is very popular GC detector, thanks to its high sensitivity (the minimum detectable amounts are in the order of 10−12 g/s), linearity, and ease of
operation, in spite of the somewhat incomplete understanding of the physical (ionization) processes involved. For the early theories, it is possible to consult Sternberg et al. [8] and Sevcik et al. [9]. The detection process is based on the decomposition of the solute-neutral molecules in a flame into charged species and on the electrical measurement of the resultant changes of conductivity. A cross-sectional view of the FID is shown in Figure 3.4.
Figure 3.4. Schematic representation of an FID.
A small flame is sustained at the jet tip by a steady stream of pure hydrogen, while the necessary air (oxidant) is supplied through the diffuser. The column effluent is introduced at the detector base in a continuous manner, mixed with hydrogen and, finally, reaches the flame. Changes in conductivity between the electrodes are monitored, amplified by an electronical device, and recorded.
The carrier gas gives a small contribution to the flame conductivity; however, when organic solute molecules reach the flame, they are ionized, increasing the current in accordance with the solute concentration. With nearly all FIDs, this current increase is
linear with the solute concentration up to six orders of magnitude. The FID is also defined as a carbon counter, inasmuch that each carbon atom in the solute molecule gives a contribute to the signals (compounds with C—C and C—H bonds). Instead the presence of nitrogen, oxygen, sulphur, and halogen atoms tends to reduce the response of the detector.
Hydrocarbons are the compounds for which FID has the best response (high sensitivity). Instead, inorganic gases, carbon monoxide, carbon dioxide, and water are not detectable with this kind of detector.
3.3.2 Mass spectrometry
Mass spectrometry is one of the most interesting analytical techniques which dominate the life science scenery.
“The basic principle of mass spectrometry is to generate ions from either inorganic or organic compounds by any suitable method, to separate these ions by their mass-to-charge ratio (m/z) and to detect them qualitatively and quantitatively by their respective m/z and abundance. The analyte may be ionized thermally, by electric fields or by impacting energetic electrons, ions or photons. Ion separation is effected by electric and/or magnetic fields.” This former definition of mass spectrometry dates back to 1968 [10].
Noteworthy is the importance on how to correctly define such a technique. In fact, never make the mistake of describing it as mass spectroscopy, inasmuch that the latter involves the absorption of electromagnetic radiation and the measurement of radiation intensity as a function of wavelength [11]. An explanation behind the use of such an incorrect terms finds its origin from the historical development of MS instrumentation. In 1897, Joseph John Thomson, a physicist, demonstrated the existence of the electron and measured its m/z [12]. He later applied similar methods to the analysis of positive ions with positive ray parabolas [13]. In 1919, Aston, a student of Thomson, refined such an instrumentation by improving the use of electric and magnetic fields to focus ions on a photographic plate used as detector (focusing speed) [14]. Aston himself called that device mass spectrograph. After, Dempster constructed an instrument with a deflecting magnetic field angled at 180°. In order to detect different masses, it could have a variable magnetic field, and after focus them onto an electric
GAS CHROMATOGRAPHY 25
point detector [15]. Afterwards, the term mass spectrometer was coined for those type of instruments using a scanning magnetic field [16]. Aston and Dempster, along with the aforementioned Thomson, can therefore be considered as the pioneers of mass spectrometry.
Although the previously mentioned definition of mass spectrometry is still valid, some additional considerations have to be made. First of all, the energy directed to the analytes during the ionization processes can be varied, and this leads to the classification of the various ionization techniques on the basis of their relative “hardness” or “softness” features. Moreover, ions can also be mass separated in field-free regions (e.g., in time-of-flight analyzers). In such a case, the separation of ions within a given m/z range would be entirely governed by their masses, which will determine the time they spend into the drift region (a detailed discussion of the principles of time-of-flight mass analyzers is presented in section 3.3.2.3).
During the last decades there has been a remarkable growth in popularity of MS as a tool for both, routine analytical experiments, as well as advanced investigations. This is due to a number of features including relatively low cost, simplicity of design and extremely fast data acquisition rates. Although the sample is destroyed by the mass spectrometer, the technique is very sensitive and only trace amounts of material are used in the analysis.
Gas chromatography-mass spectrometry is the most popular analytical technique for the identification and quantitation of volatile and semi-volatile substances in complex matrices.
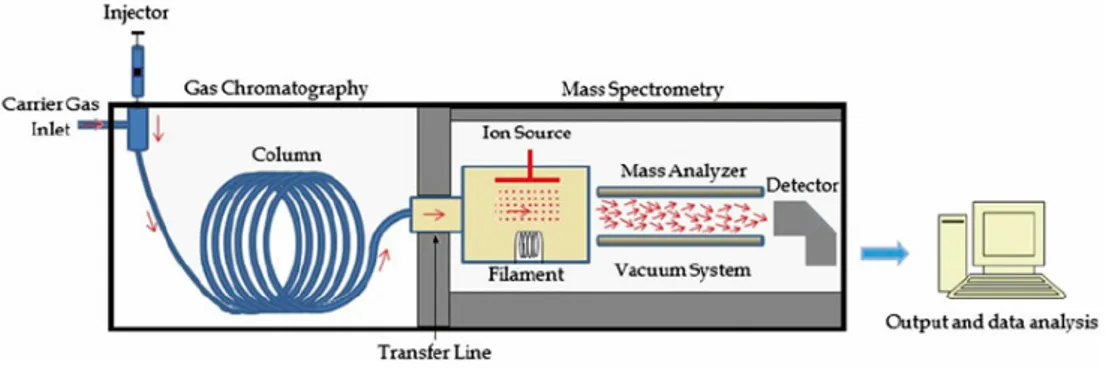
The potential of combining GC with MS for the determination of volatile compounds, contained in very complex samples, is well-known. The later introduction of very powerful data acquisition and processing systems, including automated database search techniques, guaranteed that the information content of the large quantities of data generated by GC-MS instruments was fully exploited. These early successes were the foundation of an increasingly diverse range of applications, utilizing many different mass spectrometric techniques. It is expected that a MS has the ability to form, separate and detect ions. To achieves these requirements three fundamental units are essential; an ion source, a mass analyzer and a detector [17] (see diagram scheme in Figure 3.5 and scheme in Figure 3.6).
Figure 3.5. Schematic representation of the main parts of a GC/MS instrument.
The parts of the mass spectrometer are enclosed in a housing usually kept at relatively high vacuum (10-3 to 10-6 torr), which ensures that once the ions formed in
the ion source begin to move towards the detector, they will not collide with other molecules.
Figure 3.6. Schematic representation of a mass spectrometry system.
The collision of ions would result in further fragmentation or deflection from their desired path. Furthermore, the vacuum also protects metal and oxide surfaces of the ion source, analyzer, and detector from corrosion by air and water vapor, which could compromise the spectrometer ability to form, separate and detect ions. In brief, the sample has to be introduced into the ionization source of the instrument; volatile compounds are most commonly ionized by electron ionization (EI) sources.
In an electron ionization source a high energy beam of electrons is used to displace an electron from the organic molecule forming a radical cation (M+ •), the molecular
GAS CHROMATOGRAPHY 27
ion. The ionization process normally supplies considerable energy to this first-formed ion, so that it is almost immediately fragmented. The product ions formed may themselves fragment to produce a characteristic fragmentation pattern, creating a cascade of ion forming reactions before leaving the ion source [18] (see Figure 3.7).
The collection of ions is then focused into a beam and accelerated into the magnetic field and deflected along circular paths according to the masses of the ions. By adjusting the magnetic field, the ions can be focused on the detector. The individual ion current intensities at each mass are sequentially recorded, generating a mass spectrum. The latter is an histogram of the relative abundance of the ions generated by ionization of the sample and their subsequent separation, based on their m/z. The mass spectrum is a fingerprint of the molecule conveying information about its molecular weight, and the relatives fragments that are generated during the fragmentation process.
Figure 3.7. Cascade of ion forming reactions.
An MS generates an enormous amount of data, especially when allied to separation techniques such as GC. The raw data is stored in the form of a three-dimensional array with time, m/z, and intensity as independent axes, while as aforementioned, the mass spectrum itself is a two-dimensional representation of signal intensity versus m/z. The raw data is generated by repetitively scanning the mass analyzer over a particular mass range during the separation procedure and storing the intensity data for each scan separately. Alternatively, the mass analyzer is set to switch between a few selected ions, and only these ion intensities are stored during the chromatographic separation in selected ion monitoring.
In general mass spectrometers are classified on the basis of their mass analyzer; quadrupole mass spectrometry (QMS), triple quadrupole MS (QqQMS) and timeof
-flight MS (ToFMS) are three of the main mass spectrometry detection techniques often coupled with gas chromatography.
3.3.2.1 Quadrupole mass spectrometry
The principle of the quadrupole mass analyzer was described for the first time by Paul and Steinwegen in 1953 [19]. Ever since its introduction, the quadrupoles have been developed into commercially available instruments [20].
The mass analyzer comprises four parallel hyperbolic or cylindrical metal rods arranged in a square array (Figure 3.8); each pair of opposing rods is held at the same potential which is composed of a direct current (DC) and an alternating current (AC) component. If the applied voltage is composed of a DC voltage (U) on which an oscillating radio-frequency (RF) voltage (Vcos(ωt)), is applied between one pair of rods, and the other, the field within the analyzer is created. A direct current voltage is then superimposed on the RF voltage (V) and the ions introduced into the quadrupole field undergo complex trajectories. At given values of the DC and RF potentials, only ions within a certain narrow m/z range will have stable trajectories and be allowed to reach the detector. This allows selection of a particular ion, or scanning by varying the voltages.
The motion of an ion traveling through the quadrupole is described by an equation established in 1866 by the physicist Mathieu, so-called Mathieu equation [21].
Figure 3.8. Schematic representation of a quadrupole mass analyzer.
The mass range is scanned by varying the DC and RF fields whilst keeping the voltage ratio and oscillator frequency constant. This produces a low resolution
GAS CHROMATOGRAPHY 29
spectrum. In general when the amplitude of U equals zero a wide band of m/z values will be transmitted, and as the value of U/V increases, resolution is enhanced so that at the stability limit only a single value of m/z corresponds to the trajectory, resulting in the transmission and collection of a single ion. In this manner QMS acts as a mass filter, and can be referred hereafter as a quadrupole mass filter.
Standard quadrupole analyzers have rods of 15 to 25 cm length and 10 to 20 mm in diameter. The RF is in the order of 1 to 4 MHz, and the DC and RF voltages are in the range of 102 to 103 V; ions of about 10 eV kinetic energy undergo approximately 100
oscillations during their passage.
A mass spectrum may be generated by scanning values of U and V with a fixed U/V ratio and constant drive frequency, or by scanning the frequency and holding U and V constant. The transmitted ions of certain m/z are then linearly dependent on the voltage applied to the quadrupoles, producing an m/z scale that is linear with time. The voltages applied to the rods are usually chosen to give equal peak widths over the entire mass range and unit resolution throughout the mass spectrum. The latter is then evaluated to determine the original structure of the analytes and compared with reference libraries for positive identification, providing an unparalleled qualitative ability.
3.3.2.2 Triple quadrupole mass spectrometry
Triple quadrupole mass spectrometry instruments follow a basic principle. The first quadrupole (Q1) is set to transmit a particular m/z. The second quadrupole (q) is in
truth an octapole or hexapole, and contains a gas-filled collision cell, within which fragmentation occurs through low-energy CID. In the third quadrupole (Q3), the
product ions produced from the precursor ion are analyzed (Figure 3.9).
Considering a precursor ion, m1+, which decomposes to give a product ion, m2+,
and a neutral loss, N:
𝑚;d → 𝑚 7
d+ 𝑁
MS/MS experiments can be classified according to which of these species (precursor, product ions or neutral loss) is detected. Therefore, five types of scanning mode are most commonly used, namely the scan (as a single quadrupole) the product ion scan, precursor ion scan, neutral loss scan and selected reaction monitoring (Figure 3.10).
Figure 3.10. Scan modes of triple quadrupole mass spectrometers.
Usually, the scan is carried out by setting the first analyzer (Q1) and the collision
cell as a fly-through zone and performing a scan on a range of m/z values only in the second analyzer (Q3)
The product ion scan is accomplished by setting the Q1 to a particular m/z value,
and performing a scan on a range of m/z values in the Q3. This is the most common
and well-known MS/MS mode, which is generally used for structural elucidation tasks.
CID Q3
Q1
Full Scan
Product Ion Scan
Multiple Reaction Monitoring
OFF OFF
Selected m/z
Scanning
Scanning
Selected m/z Selected m/z
Precursor Ion Scan
Scanning Selected m/z
Neutral Loss Scan
GAS CHROMATOGRAPHY 31
Precursor ion scan is achieved by performing a scan in Q1, while a specific m/z is
set at Q3. This mode is particularly useful when a given product ion, characteristic of
a compound class, is known and thus all the compounds belonging to that class can be identified.
To perform a neutral loss scan, the two mass analyzers operate at the same scan speed, but Q3 is shifted by a determined m/z value respect to Q1. In this way, only ions
which lose a neutral mass, corresponding to the m/z difference between the two analyzers, can be detected.
In the selected reaction monitoring mode, transitions of m/z values from a precursor to a particular ion produced upon dissociation are monitored. Since one or more pair of transitions can be monitored in the same time interval, that is a precursor to one or more product ions, this technique is often referred to as multiple reaction monitoring. All these operating modes may be used for both qualitative and quantitative applications, depending on the specific case and needs. Concerning qualitative applications, they aims to two main purposes: i) the identification of unknown analytes compared to reference through the recognition of common fragmentation patterns, and ii) mapping the fragmentation paths that lead to a certain mass spectrum. Furthermore, the scanning of a precursor ion and that of a neutral loss are particularly useful in screening applications.
For what concerns quantitative analyses, the major reduction of chemical background is certainly a significant advantage. Additionally, the very rapid duty cycle (10 to 50 ms) of the QqQMS also makes it particularly suitable for high throughput analysis.
3.3.2.3 Time-of-flight mass spectrometry
The principle of time-of-flight analyzers was described by Stephens in 1946 [22]. Wiley and McLaren published in 1955 the design of a linear ToF mass spectrometer which later became the first commercial instrument [23].
The ToF analyzer allows to separate the ions, previously generated into the ion source, on the basis of the different velocity assumed inside the drift region. The heavier are the ions the more time they need for traveling the flight tube and reach the detector located at the end of the path. More in detail: after being formed into the ion
sources and accelerated by an electric field, ions arrive at the interface of the ToF in the form of ion packages. Specifically, they are accelerated towards the flight tube through a difference of potential applied between an electrode and the extraction grid. When leaving the acceleration region, all intact ions with the same charge will ideally have the same kinetic energy, and ions characterized by a distribution of masses present a distribution of their velocities accordingly. After, they enter into a field-free region where they will be separated according to their velocities, and reach the detector positioned at the other extremity of the flight tube. Provided that all the ions start their journey at the same time, or at least within a suitable short time interval, the lighter ones will arrive earlier at the detector than the heavier ones. Such an instrumental setup where the ions are traveling on a straight line from the point of their generation towards the detector is called linear TOF.
The fundamental requirement in ToF analyzers is a well-defined starting time for ions belonging to a given mass range. The time difference between the starting signal of the pulse and the time at which an ion hits the detector is the time of flight (tToF) and
can be expressed as:
𝑡fgh = 𝐿 𝑣= 𝐿j
𝑚
2𝑞𝑈_ ∝ n𝑚 𝑧⁄
Eq. 3.1 where L is the length of the field-free region, v is the ion velocity after acceleration, m is the mass of the ion, q the charge of the ion, Ua the accelerating electric potential
difference, and z the charge state. This equation shows that, the lower the mass of an ion, the faster it will reach the detector, and vice versa. Summarizing, the physical property that is measured during an analysis is the flight time of the ion, which is then converted into a mass value.
An interesting advantage of these instruments is their powerful transmission efficiency which leads to very high sensitivity compared to quadrupole and sector analyzers. That is because all the mass range is simultaneously analyzed contrary to the scanning analyzers where ions are transmitted successively along a time scale.
Generally, the ToF analyzer is very fast, and a spectrum over a broad mass range can be obtained in the microseconds time interval. Thus, it is possible to produce
GAS CHROMATOGRAPHY 33
theoretically several thousand mass spectra over a very wide mass range in just 1 second. Actually, recorded spectra are generally the result of the summation of a number of individual “transient” spectra.
The resolving power of a time-of-flight analyzer depends on the mass and also on the length of the ion path inside the flight tube. Despite this, once a certain path length is exceeded, the system becomes less performing, since there is a loss of ions due to angular dispersion phenomena.
One of the main breakthroughs in the technological development of ToF analyzers arose from the design of the orthogonal acceleration ToF analyzer (oaToF). In an oaToF analyzers, pulses of ions are extracted orthogonally from a continuous ion beam. Specifically, ions fill the first stage of the ion accelerator in the space between the extraction plate and a grid. A pulsed electric field is then applied at a frequency of several kilohertz, which force ions to assume a direction orthogonal to their original trajectory, and then begin to fly towards the analyzer.
It is worthy to say that the duty cycle of an oaToF is far from 100% and it is generally lower than that of classical ToF analyzer. That is because the time required for the ion beam to fill the orthogonal acceleration region is lower than the time required for the sampled ions to hit the detector, and since new ions cannot be injected until the ions from the previous injection have reached the detector, the logical consequence is that a part of the ions produced in the source are lost in the first stage of the orthogonal accelerator.
The most significant advantages of oaToF analyzers are: i) high mass resolving power, and ii) mass accuracies even up to or below 1 ppm. Therefore, it is not surprising that oaToF instruments are currently widespread used in combination with GC and fast GC.
A further technological innovation was obtained through the development of the “reflectron” system, conceived by Mamryn in 1994 [24].
The simplest type of reflectron ToF analyzer (ReToF), which is called single-stage reflectron, usually consists of a series of equally spaced ring-shaped electrodes set at increasing potential which focus ions having the same m/z value but different kinetic energies in time. Ions with higher kinetic energy, and hence higher velocity, will penetrate the reflectron more deeply than ions with lower energy. Consequently, the
faster ions will spend more time in the reflectron and reach the detector at the same time of slower ions with the same m/z. Although the reflectron increases the flight path, though without increasing the dimensions of the mass spectrometer, the beneficial increase in mass resolution comes at the expense of sensitivity and mass range limitation. An oaToF mass spectrometer equipped with a reflectron is shown in Figure 3.11.
Figure 3.11. Schematic representation of a time-of-flight mass spectrometer equipped with an orthogonal accelerator and a reflectron.
The choice of operating ToF instruments in “linear” or “reflectron” mode depends on the species to be detected. For example, when operating in linear mode, the aim is usually to detect larger species, which will not be stable enough to survive along the strong electric field of the reflectron. Therefore, the given resolving power is much lower, as the width of the isotopic envelope do not allow for its decent resolution. The opposite is the case of ReToF, because especially in the presence of metastable fragmentations (i.e., in tandem MS), only fragments still having kinetic energies close to that of the precursor can be successfully and sensitively detected.
It is also possible to divide time-of-flight analyzers into two categories: low resolution systems (LR ToFMS) and high resolution systems (HR ToFMS).
Turbomolecular source pump Turbomolecular vacuum pump Reflectron MCP detector KADAS (Signal processing) Ion source chamber
Push and Pull electrodes
Orthogonal accelerator
GAS CHROMATOGRAPHY 35
The LR ToFMS system is characterized by a resolution of units of mass, and by an high acquisition frequency (i.e. 500 Hz). The duty cycle of a LR ToFMS is variable, with an approximate value of 30% [25], consequently the sensitivity is higher if compared to a scanning approach, such as qMS. The existence of a de-convolution software allows for the mass spectral resolution of partially co-eluted compounds during the chromatographic process. To ensure optimal de-convolution, a high spectral coherence is required, accompanied by an acquisition speed of about 20-30 spectra per peak. Quantification can be performed using the extracted ion chromatogram (EIC) technique, although there is low specificity due to the nominal mass resolution of LR ToFMS system.
The spectra generated by an HR ToFMS system are, on the other hand, characterized by higher resolution and high mass accuracy. Thanks to these capacities it is possible to generate highly specific chromatograms with the extracted ion, making a "pre-target" analysis possible. Obtaining fragments, with accurate mass values up to the forth decimal place, allows to obtain interesting information on the molecular structure. A high resolution mass spectrometer allows to obtain high mass accuracy, reducing the possibility of incorrect identification, due to the presence of isobaric interferences (same nominal mass and different molecular formula).
The term mass resolution, R, or simply resolution, usually refers to the ability of a mass spectrometer of separating two narrow mass spectral peaks. The ability of an instrument to distinguish between ions differing by a small increment in their m/z value (Δm/z) is called as resolving power:
𝑅 = ∆𝑚𝑚 = 𝑚 𝑧⁄ ∆𝑚 𝑧S
Eq.3.2 Unit mass resolution means that only integer masses can be separated, that is, you can distinguish, e.g., mass 1000 from 1001.
The most commonly used method to measure the resolution follows the full width at half maximum (FWHM) definition, which uses the width of a peak at 50% of its height as a measure for Δm (Figure 3.12).
Figure 3.12. Examples of different definitions of resolution.
Instruments capable of low resolution operates at a R = 500–2000. High resolution refers to a R > 5000. However, there is no exact definition of these terms. Furthermore, one should be aware that increased settings of resolving power are usually obtained at the cost of transmission of the analyzer, thereby reducing the absolute signal intensity. There are different ways to define and thus to calculate the mass of an atom, molecule or ion. Basically, an element is specified by the number of protons in its nucleus, i.e., the atomic number, which determines its place within the periodic table of the elements. Atoms with nuclei of the same atomic number but differing in the number of neutrons, i.e., by the mass number, are termed isotopes [26]. Those elements which do exist in the form of only one single naturally occurring stable isotope are termed monoisotopic elements. The distribution of the isotopic composition in a mass spectrum is named the isotopic pattern.
For stoichiometric calculations, chemists use the average mass, that is the result of the weighted average of the atomic masses of the different isotopes of each element in the molecule. In mass spectrometry, the nominal mass is generally used, the latter being calculated using the mass of the predominant isotope of each element rounded to the nearest integer value. However, the exact masses of isotopes are not exact whole numbers. They differ weakly from the nominal mass by a determined value, so-called mass defect, which is unique for each isotope. The monoisotopic mass is then calculated by using the exact mass of the most abundant isotope for each constituent element. It is very close to but not equal to the nominal mass of the isotope. As a consequence, almost no combination of elements in a molecular formula has the same calculated exact mass as any other one. The only exception is the carbon isotope 12C,
GAS CHROMATOGRAPHY 37
As an example, the molecular ions of nitrogen, N2+•, carbon monoxide, CO+•, and
ethene, C2H4+•, have the same nominal mass of 28 u, i.e., they are so-called isobaric
ions. The isotopic masses of the most abundant isotopes of hydrogen, carbon, nitrogen, and oxygen are 1.007825 u, 12.000000 u, 14.003074 u, and 15.994915 u, respectively. Thus, the calculated exact masses are 28.00559 u for N2+•, 27.99437 u for CO+•, and
28.03075 u for C2H4+•. This means they differ by several 10–3 u, and none of these
isobaric ions measure precisely 28.00000 u.
The type of mass measured by mass spectrometry depends largely on the resolution and accuracy of the analyzer.
The mass accuracy indicates the deviation of the instrument’s response between the measured accurate mass and calculated exact mass. It can be expressed as absolute mass accuracy, Δm/z:
∆𝑚/𝑧 = 𝑚/𝑧q`Nqra^qbs_t− 𝑚/𝑧6_t69t_squ
Eq. 3.3 or, alternatively, as relative mass accuracy, δm/m, i.e., the absolute mass accuracy divided by the exact mass, and expressed as parts per million (ppm):
𝜕𝑚/𝑚 = (∆𝑚/𝑧)/(𝑚/𝑧) × 10x
Eq. 3.4 Accurate mass measurements allow to determine the elemental composition of an analyte, and thereby to confirm the identification of target compounds or to support the identification of unknowns. Assuming infinite mass accuracy, we should be able to assign the molecular formula of any ion simply through its exact mass. In reality, deviations between the accurate and exact mass of an ion always exist to some extent and, thus, we normally deal with errors in the order of one to several ppm depending on the type of instrument and the mode of its operation.