dipartimento di fisica e astronomia
Dottorato di ricerca in fisica
Study of the
19
F(p,α)
16
O reaction
through the Trojan Horse Method
and its astrophysical enviroment
Ph.D. Thesis
Author:
Dr. I. Indelicato
Supervisor:
Chiar.mo Prof. C. Spitaleri
Abstract
Faculty Name
Dipartimento di fisica e astronomia
Ph.D Thesis by Dr. I. Indelicato
Fluorine nucleosynthesis takes place in the hydrogen-helium intershell region of Asymptotic Giant Branch (AGB) stars and in the same region also the s elements are produced. Because fluorine is produced in the He-intershell and then dredged up to the surface together with s process elements, its abundance is used as probe for AGB models and nucleosynthesis and is one of the most important input pa-rameters for an analysis of s process in AGB star conditions. The problem is that current models fail to explain the highest F enhancements found in the low-mass AGB stars. A possible way to explain this abundance found in AGB star envelopes might be provided by a revision of the uncertainties in the nuclear reac-tion rates involved in the synthesis of this nuclide in these stars. In particular, The
19
F(p,α)16
O reaction is the main destruction channel of fluorine at the bottom of the convective envelope in AGB stars, where it can experience temperatures large enough to determine its destruction, owing to extra-mixing processes. Because of the Coulomb barrier, measurements available in the literature do not have access to the energy region of astrophysical interest, corresponding to the Gamow peak (Ec.m. = 38 keV). Direct measurements of the cross section stop at about 500 keV
for the α0 channel (with 16
O being left in its ground state following 20
Ne decay), thus the astrophysical factor was then extrapolated to low energies assuming a non resonant energy trend. In the case of extra-mixing phenomena, which are char-acterized by a maximum temperature of about 107
K, the energy region below 500 keV is of key importance, thus requiring further and accurate investigations to evaluate the contribution of possible resonances, which could significantly en-hance the reaction rate at such low temperatures. So, a new experimental study through the Trojan Horse Method (THM) is important because the method is
the quasi-free contribution of an appropriate three-body reaction performed at energies well above the Coulomb barrier, to extract a charged-particle two-body cross section at astrophysical energies free from coulomb suppression. Two experi-mental runs were performed using the THM, extracting the quasi-free contribution to the 2
H(19
F,α16
O)n three-body reaction. In this work I focused on the second run especially because of the improved angular and energy resolution allowed to draw accurate quantitative conclusions from the data for the α0 channel. The
measurement was performed at the Laboratori Nazionali di Legnaro in July 2012 where the Tandem accelerator provided a 55 MeV 19
F beam which impinged onto CD2 targets. The experimental setup consisted of a telescope devoted to oxygen
detection, made up of an ionization chamber and a silicon position sensitive de-tector (PSD) on one side with respect to the beam direction and one additional PSD on the opposite side for coincident detection of the α particles. In the begin-ning of the experimental work, I described the reason leading to the choice of the three-body reaction, of the beam energy, of the setup and of the detection angles. After the off-line analysis in which I widely described the detector calibration, the three-body reaction channel selection, the study of reaction mechanism and the selection of the quasi-free contribution are discussed. Finally the cross-section reaction are extracted and compared with the available direct measurement. The analysis of the α0 channel shows the presence of resonant structure never observed
before that could lead to a significant increase in the reaction rate at astrophysical temperatures, with important consequences for stellar nucleosynthesis.
Abstract iii
List of Figures viii
List of Tables xiii
Abbreviations xiv
Introduction xvii
1 Astrophysics Motivation 1
1.1 The solar abundances . . . 1
1.2 Evolution prior and through the AGB phase . . . 5
1.2.1 Evolution prior the AGB phase . . . 5
1.2.2 Evolution through the AGB phase . . . 11
1.2.3 The Thermally Pulsing phase . . . 12
1.3 The Neutron Capture Process . . . 15
1.3.1 The s process in stellar evolution . . . 17
1.4 Nucleosynthesis and mixing processes in AGB stars . . . 19
1.5 Fluorine nucleosynthesis . . . 21
1.5.1 The ν-process scenario . . . 21
1.5.2 The Walf-Rayet scenario . . . 22
1.5.3 The AGB scenario . . . 23
1.6 Observation of fluorine . . . 25
1.7 Termination of the AGB evolutionary phase . . . 31
1.8 Pre-solar Grains . . . 32
2 Thermonuclear Reaction Rates 34 2.1 Stellar Thermonuclear Reaction . . . 34
2.2 Coulomb Barrier, Penetration Factor and The Astrophysical Factor 37 2.3 Non-Resonant Reaction Rates . . . 42
2.4 Resonant Reaction Rates . . . 45
2.5 R-Matrix theory of compound nucleus reactions . . . 50
2.5.1 Construction of internal and external wavefunction . . . 51 v
2.5.1.1 Internal Region . . . 52
2.5.1.2 External Region . . . 53
2.5.1.3 Multi-channel matrix representation . . . 55
2.5.2 Formal and observed parameters . . . 56
2.6 The problem of the measurement at the astrophysical energies . . . 58
2.6.1 The electron screening effect . . . 60
2.7 Reaction rate involved in fluorine nucleosynthesis . . . 64
3 The Trojan Horse Method 69 3.1 The Indirect Methods. . . 70
3.1.1 Coulomb Dissociation. . . 70
3.1.1.1 Experimental Applications . . . 73
3.1.2 Asymptotic Normalization Coefficient . . . 73
3.1.2.1 Experimental Applications . . . 76
3.2 Quasi-free break-up and sequential mechanism . . . 77
3.3 The Trojan Horse Method . . . 79
3.4 Plane Wave Impulse Approximation . . . 81
3.5 Distorted Wave Impulse Approximation and Modified Plane Wave Born Approximation . . . 84
3.6 Validity Test. . . 88
3.7 Application of the THM . . . 91
3.8 The 19 F(p,α)16 O: the first run . . . 94
4 A new measurement of the 19 F(p,α)16 O reaction through the Tro-jan Horse Method 98 4.1 Application of the THM . . . 99
4.2 Experimental planning . . . 101
4.3 QF kinematical conditions . . . 103
4.4 Sequential Decay . . . 107
4.5 Experimental setup and procedures . . . 109
4.6 Detector calibrations . . . 112
4.6.1 PSD working principles. . . 112
4.6.2 Position calibration . . . 115
4.6.3 Energy calibration . . . 117
5 Data Analysis 121 5.1 Data analysis: Selection of the reaction channel . . . 121
5.1.1 Selection of the 2 H(19 F,α0 16 O)n channel . . . 121
5.2 Data analysis: Selection of the mechanism . . . 129
5.2.1 Study of the SD channels. . . 130
5.2.2 Data as a function of the neutron momentum . . . 132
5.2.3 Study of Ec.m. spectra for different ps ranges . . . 134
5.2.4 Study of the experimental momentum distribution . . . 136
5.2.5 Result of the selection . . . 139
5.3.1 Angular distributions . . . 140
5.3.2 Excitation function . . . 142
5.4 The two-body cross-section . . . 145
5.5 Comparison with direct data . . . 147
6 Conclusion 150
1.1 The relative abundances of all elements measured in the solar sys-tem, as a function of mass number A normalized to 106
Si atoms
and the y-axis is a logarithmic scale. . . 2
1.2 Binding energy per nucleon as a function of mass number A [1]. Comparison with the peaks in Fig. 1.1 shows the strong correlation between elemental abundance and nuclear binding energy. . . 3
1.3 An H-R diagram showing the evolutionary track of a Sun-like star.. 6
1.4 Figure shows the pp chains [2]. Each of the pp chains fuses four protons to onehelium nucleus. . . 6
1.5 Energy production as a function of central temperature for the p-p chain and the CNO cycle. The dot denotes conditions in the solar core: the Sun is powered dominantly by the pp chain. The contribution by the CNO cycle is at roughly 10% of the total energy production. . . 8
1.6 The four CNO cycles. Each reaction cycle fuses four protons to one 4 He nucleus. . . 9
1.7 Illustration of the structure of an AGB star [3]. . . 12
1.8 One thermal pulse [4, 5]. . . 13
1.9 Convective episode in the model of M=2 M⊙ [6]. . . 13
1.10 Neutron capture paths of the s process and r process shown on the chart of the nuclides between iron and the actinides. . . 16
1.11 Schematic showing two consecutive pulses. The s processed mate-rial is later dredged to the surface of the star [7]. . . 19
1.12 Schematic of the 19 F production mechanism. . . 24
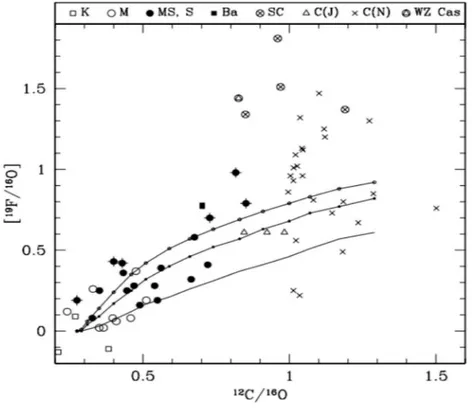
1.13 Comparison of the 19 F abundance observed by [8] and the predic-tion (long dashed, short dashed, dotted and full line) from AGB star models by [9]. Calculations show that even the highest exper-imentally observed surface fluorine abundances are reproduced for some masses and metallicities, but this occurs for C/O values much larger than what experimental data suggest [9]. . . 26
1.14 Schematic diagram of the CBP model. Material taken from the envelope circulates slowly down into the radiative zone, where it undergoes nuclear processing at temperatures near TP, and then back to the envelope where it is rapidly mixed with the other en-velope material. The mass coordinate MP is where T = TP, and MBCE is the bottom of the convective envelope[10]. . . 27
1.15 Comparison of fluorine abundances observed by Jorissen et al. (points) and model predictions (dashed lines) that take into account the par-tial mixing zone [9]. . . 28
1.16 F abundance as a function of C+N in 10 CEMP stars. The inverted triangles indicate upper limits, green symbols are CEMP-no stars. Theoretical modeling results are indicated by lines. All models are for M = 2 Modot and [Fe/H] = -2.3. [11] . . . 30
1.17 C and N isotopic ratios measured in individual presolar SiC grains[12]. Five different groups can be distinguished on the basis of their abun-dances in the meteorites, given in the legend. The dotted lines represent the solar initial values. . . 33
2.1 Sketch of the Coulomb barrier. The plot reports the total potential V(r) versus the relative distance r between the two interacting particle. 38
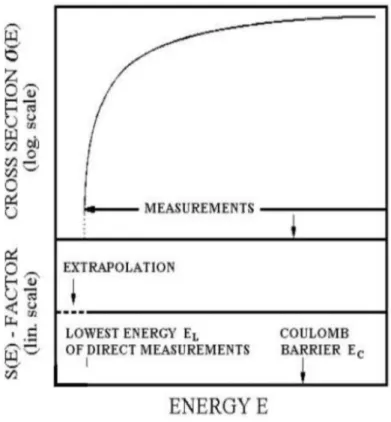
2.2 Comparition of the low-energy behaviour of the cross section (upper panel) and of the S(E)-factor (lower panel) for a non-resonant reaction. 41
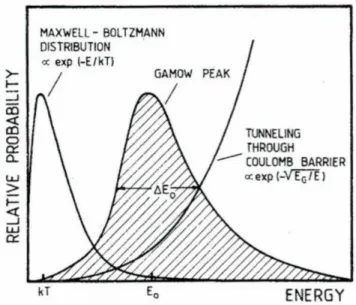
2.3 The Gamow Peak (shaded), resulting from convolution of the Maxwell-Boltzmann distribution and the penetrability. . . 43
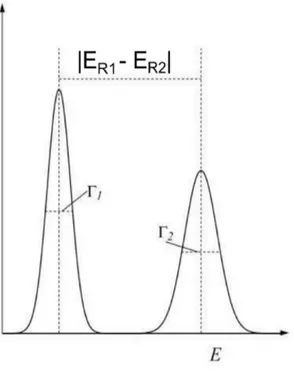
2.4 Two isolated resonances. The resonance energy is large compared with their total widths. . . 46
2.5 An isolated and narrow resonance.. . . 47
2.6 Schematic representation of the potential between charged particles. The presence of the electron cloud reduces the Coulomb barrier between the interacting nuclei. The electron screening effects cause an enhancement of the S(E)-factor [1]. . . 62
2.7 The reaction rates for the three main mechanisms responsible for destroying fluorine in AGB stars [13]. . . 65
2.8 Reaction rate for the three branches of the19
F(p,α)16
O reaction (T9
in units of 109
K) [14]. . . 66
2.9 Astrophysical S(E)-factor for the19
F(p, α0) reaction from the NACRE
compilation [15]. . . 67
2.10 Astrophysical factor for the19
F(p, α0) reaction by Lombardo et al.
[16]. . . 68
3.1 Schematic view of the transfer reaction mechanism A+X → B+Y, where X = Y ⊕ a and B = A ⊕ a, preceeding through the transfer of particle a from X to the nucleus A. . . 75
3.2 Sequential decay mechanism proceeding through compound nucleus formation, B. . . 77
3.3 Schematic view of a quasi-free three-body reaction. . . 78
3.4 The TH S(E)-factor (red circles) compared with direct data (open symbols) [17]. . . 83
3.5 The 7
Li(p,α)4
He TH S(E)-factor (full circles) [18] compared with direct data (open circles) [18]. In this study the deuteron was used like TH-nucleus and the neutron acted as spectator. . . 89
3.6 The 6
Li(d,α)4
He TH S(E)-factor (full circles) [19] compared with direct data (open circles). . . 89
3.7 The 7
Li(p,α)4
He TH S(E)-factor obtained using the3
He (panel a)) and deuteron (panel b)) like TH-nucleus respectively. . . 90
3.8 Normalized coincidence yield of the d(19
F, α0 16
O)n reaction. The black circles are the experimental data, the horizontal error bars p-19
F-relative-energy binning and the vertical ones the statistical uncertainties. . . 95
3.9 QF cross section of the d(19
F, α0 16
O)n reaction in arbitrary units. The red band is the cross section calculated in the modified R-matrix approach, normalized to the peak at about 750 keV and convoluted with the experimental resolution. The vertical error bars statistical and angular-distribution integration uncertainties. . 96
3.10 R-matrix parameterization of the 19F(p,α0)16O astrophysical
fac-tor. . . 97
4.1 Schematic diagram representing the d(19
F,α16
O)n QF process. . . 101
4.2 θH e vs. θ16O two-dimensional plot for the d(19F,α16O)n reaction, for
|ps|<10MeV/c (QF kinematical conditions). Vertical lines:
detec-tor 1 (see text), spanning 8.8◦
−21.2◦, optimized for
16
O detection. Horizontal lines mark the angular range spanned by detector 2 (see text) for α-particle detection, 38.1◦
−53.9◦. . . 104 4.3 E4H e vs. E16O two-dimensional plot for the d(19F,α016O)n reaction,
for the whole ps range. . . 105
4.4 Simulated phase space factor as a function of Ec.m.for the d( 19
F,α0 16
O)n reaction. The angular and momentum conditions (ps<40 MeV/c)
are all included. The energy region between 0 and 1 MeV is fully covered, as well the sub-threshold region. . . 106
4.5 Simulated Eα−16O vs. pntwo-dimensional plot: the energetic region
of astrophysical interest (0-1 MeV) is reached for low-momentum values ( |ps|<30 MeV/c) of the neutron. This assures the selection
of the kinematical condition at which a strong contribution of the QF-mechanism on the three-body reaction is expected. . . 107
4.6 Schematic diagram representing the SD processes which can con-tribute to the d(19
F,α16
O)n reaction cross section. . . 108
4.7 Schematic view of the experimental setup. . . 109
4.8 Picture of the scattering chamber located in the LNL. . . 110
4.9 The electronic chain used in the experiment (see the text for details).111
4.10 Schematic drawing of a Position Sensitive Detector. . . 113
4.11 Picture of a PSDs holder. A grid with 18 slits is placed in front of the holder to perform the position calibration of the detector. . . . 115
4.12 A typical position-energy two-dimension matrix of a PSD. Both energy and position signals are expressed in channels. . . 116
4.13 A typical matrix of a PSD after position calibration. . . 117
4.15 Energy loss function when a α particle passes through the alu-minium dead layer of PSD2 (thickness = 0.2µm) and the half target. The analytic expression with all parameters is also shown. This is angular independent, so that it is the same for PSD2. . . 120
4.16 Energy loss function when a 16
O particle passes through the alu-minium dead layer of PSD1 (thickness = 0.2µm) and the half target. The analytic expression with all parameters is also shown. This is angular independent, so that it is the same for PSD4. . . 120
5.1 Particle ID with the standard ∆E-E technique.. . . 123
5.2 Graphical cut in the oxygen locus. . . 123
5.3 Kinematic locus from the PSD1-2 coincidence with selection of oxy-gen nuclei (Z = 8) on the ∆E - E two-dimensional spectrum in figure 5.2. 1 and 2 mark two loci corresponding to two-body background reactions. . . 124
5.4 Reconstructed Q-value spectrum fro the coincidence PSD1-PSD2. . 125
5.5 Identification of particle s according to the procedure of [20], applied to the PSD3-PSD4 coincidences. . . 126
5.6 The graphical cut introduced to single out the background events. . 127
5.7 Kinematic locus of the 2
H(19
F, α0 16
O)n reaction channel. . . 128
5.8 Q-value from the PSD1-2 coincidence, obtained by singling out the spurious contributions observed in figure 5.3. . . 128
5.9 Energy correlation two-dimensional spectra. E16O
−n, Eα−16O, and
Eα−n are the 16
O-n, 16
O-α, and α-n relative energies, respectively. Horizontal loci in the lower panel correspond to 17
O excited states, while the vertical one correspond to20
Ne excited states . . . 131
5.10 Energy correlation two-dimensional spectra. E16O
−n, Eα−16O, and
Eα−n are the 16
O-n, 16
O-α, and α-n relative energies, respectively. The grey box emphasizes the energy range of astrophysical interest. 132
5.11 Eα−16O relative energy as a function of the neutron momentum ps. . 133
5.12 Normalized reaction yield for different psranges. The reaction yield
monotonically decreases moving to high ps values, as expected for
a QF reaction using deuteron as TH nucleus. This represent a first test of the occurrence of the QF mechanism in the2
H(19
F, α0 16
O)n reaction. . . 135
5.13 Experimental momentum distribution (full dots) compared with theoretical ones, given by the square of the Hulthen wave function in momentum space (black solid line) -40<ps<20 MeV/c . . . 136
5.14 Behavior of FWHM for the p-n momentum distribution as a func-tion of the transferred momentum qt [21]. The blue point indicate
the value obtained in this measurement. The FWHM is deduced from the experimental p-n momentum distribution, while the qt
value is calculated from the reaction kinematics. . . 138
5.15 Energy correlation two-dimensional spectra. The momentum con-dition mentioned in the text is included. . . 139
5.16 Example of angular distribution extracted at different Ec.m. via the
THM (red point) compared to the direct data(black point) [22] [23] and the theoretical ones (solid lines) calculated according to the equation 5.3.1.. . . 142
5.17 Normalized coincidence yield of the 19
F(p, α0) 16
O reaction for the two coincidences. The black circles are the experimental data, with the horizontal error bars defining the p -19
F-relative-energy binning used in data reduction and the vertical ones the statistical uncer-tainties. The black line are the contribution of the resonances and multi-Gaussian fitting of the experimental data. . . 143
5.18 Typical scheme of the possible excited states of 20
Ne [24]. The red box underlines the energetic region reached with the present experiment. . . 144
5.19 QF cross section reaction in arbitrary units for the two coincidences. The black circles are the experimental data. . . 146
5.20 QF cross section of the 19
F(p, α0) 16
O reaction in arbitrary units. The black circles are the experimental data. The middle line repre-sents the best fit to the data. . . 146
5.21 R-matrix fit of direct data (black squares from [22], black triangle from [25], black circles from [26] and green simbols from [16]). . . . 147
5.22 The cross section calculated in the modified R-matrix approach, normalized to the peak at 690-790 keV and convoluted with the experimental resolution. The red line represents the best fit to the data. . . 148
5.23 The red line show the combination of the S(E) factor from the fitting of Lombardo et al. data [16] (above 600 keV) and of the one calculated using standard R-matrix formulae, where the resonance parameters where taken from the generalized R-matrix fitting of THM data in fig. 5.22 (below 600 keV). . . 149
1.1 Brief descriptions of the stellar classifications [27]. . . 26
2.1 Gamow energy and width of the Gamow peak evaluated at the temperature of the solar core [1]. . . 44
3.1 Application of the THM. . . 92
4.1 Structure, orbital angular momentum and binding energy for some TH-nuclei. . . 99
4.2 Detector angles, positions and thicknesses. . . 110
5.1 20
Ne excited states populated in the 19
F(p, α0) 16
O reaction [24]. The third column indicates the Jπ values reported in literature. . . 143
5.2 20
Ne excited states populated in the 19
F(p, α0) 16
O reaction [24]. The column indicates the possible Si, Li and Jπ values. . . 145
5.3 Resonance energies, spin parities, and α partial widths in R-matrix fit. . . 148
BBN Big Bang Nucleosynthesis
SBBN StandardBig Bang Nucleosynthesis AGB Asymptotic Giant Branch
HR Hertzsprung Russell ZAMS Zero Age MainSequence RGB Red Giant Branch TP Thermal Pulse
PDCZ Pulse Driven ConvectiveZone TDU ThirdDredge Up
WR Walf Raye
HBP HotBottom Process CBP CoolBottom Process
CEMP Carbon Enhanced MetalPoor PPN Proto Planetary Nebulae SiC Silicon Carbide
CD Coulomb Dissociation
ANC Asymptotic Normalization Coefficient
THM Trojan Horse Method
DWBA DistortedWave BornApproximation DWIA DistortedWave ImpulseApproximation PWIA PlaneWave ImpulseApproximation QF Quasi Free
HOES HalfOff EnergyShell OES On EnergyShell SD Sequential Decay SM Sequential Mechanism DBU Direct BreakUp
PSD Position SensitiveDetector IC Ionization Chamber
ADC Analogical DigitalConverter TFA Time FilterAmpifier
TAC Time AmplitudeConverter SCA Single ChannelAnalyzer GG Gate Generator
Almost all the elements we know today are produced in stars of different types and initial masses, the only exceptions being hydrogen, helium and traces of lithium formed in the Big-Bang Nucleosynthesis. The absence of stable nuclei with A=5 or A=8, together with the Coulomb barrier increase for reactions between heavier nuclei substantially stops the cosmological production in correspondence of 7
Li in Standard Big Bang Nucleosynthesis. All of the heavier nuclides with A≥12 are produced in stars, and among them the nuclides beyond the iron peak are formed from neutron capture processes. In particular, the s-elements (heavy-element from Fe to Pb) are "cooked" inside stars with masses below about three times the Solar mass, during a late evolutionary phase called Asymptotic Giant Branch (AGB) [6]. These stars experience an ingestion of protons into the helium-rich layer during the core He-flash, resulting in the production of 13
C. In this way, the13
C(α,n)16
O reaction would then be the source of neutrons for the s process [7]. In addition to the production of s process elements, AGB stars may also be a rich site for the nucleosynthesis of lighter elements, such as fluorine.
Its nucleosynthesis takes place in the same region wher the s elements are pro-duced and its abundance is very sensitive to the physical condition in AGB. For this reason it is used as probe for AGB models and nucleosynthesis and is one of the most important input parameters for an analysis of s process in AGB star conditions. Thus, fluorine abundance observed in these objects can constrain AGB star models since it is strictly connected to the mixing processes taking place in-side them. Anyway, the highest values of the observed 19
F enhancements in the stellar atmosphere are not matched by the current models.
Primary sources of uncertainty in predicting fluorine abundances in AGB stars are both the adopted reaction rates and the treatment of the mixing phenomena as well as the associated nucleosynthesis at the bottom of the convective envelope
ing left in its ground state following 20
Ne decay) that represents the main fluorine destruction channel in this low-temperature, proton-rich environment [9]. Its reac-tion rate is determined by the contribureac-tion of several resonances, about 10, which show up below 1 MeV, and by the non-resonant contribution. Direct measure-ments of this cross section [15] stop at about 500 keV in the C.M. frame, thus only theoretical estimates or spectroscopic studies are available elsewhere.
In the case of extra-mixing phenomena, which are characterized by a maximum temperature of about 107
K, the energy region below 500 keV is of key impor-tance. Thus only model calculations of the reaction rate are actually available in the temperature region most relevant for 19
F nucleosynthesis in AGB stars. For this reason a measurement of the low energy cross section is extremely important but experimentally it is very difficult.
In fact, this measurement has to be performed inside the energy window relevant for astrophysics (the so-called Gamow windows) that as said before extends well below 1 MeV. Anyway these energies are much lower than the Coulomb barrier of the 19
F+p channel that is about 2.5 MeV. Sice cross sections exponentially drop in the sub-Coulomb region, measuring of the nuclear processes under investigation is very difficult. In addition, the electron screening effect, due to the electrons surrounding the interacting ions, prevents one to measure the bare-nucleus cross section, which is the information required for the astrophysical calculations. The only way to get the low-energy cross section is then by extrapolating the behavior of the higher energy data. This is done by means of the definition of the astro-physical S(E)-factor, which represents essentially the cross section free of Coulomb suppression and allows for an easier extrapolation:
S(E) = σ(E)E2πη (1)
where exp(2πη) is the inverse of the Gamow factor, which removes the dominant energy dependence of σ(E) due to the barrier penetrability.
But, extrapolation can introduce large errors due to, for istance the presence of un-expected resonances or high energy tails of subthreshold resonances or the wrong estimate of the electron screening potential.
Method (THM) [30], have been introduced as complementary and/or alternative approaches for determining the bare-nucleus S(E)-factor.
The last one is particularly suited for extracting low-energy cross section for nu-clear reactions having charged particles or neutrons in the exit channel. THM is an experimental indirect technique which selects the quasi-free contribution of an appropriate three-body reaction performed at energies well above the Coulomb barrier, to extract a charged-particle two-body cross section at astrophysical en-ergies free from Coulomb suppression. A reaction
A + a → C + c + s (2)
with nucleus a=x ⊕ s having a strong cluster structure and with three particles in the final states, can proceed by various reaction mechanisms. In the application of THM we are interested in the process where the Trojan horse nucleus a breaks up into a cluster x that is the transferred particle and where the nucleus s can be regarded as a spectator to the two-body subreaction:
A + x → C + c (3)
The idea is that the particle x (participant) is conducted inside the nuclear field of A, where the reaction takes place, from a, which for this reason is named Trojan horse nucleus. In this way it overcomes the problem of the Coulomb suppression and electron screening. So, under proper kinematical condition, the particle A interacts only with the cluster x which comes from the direct break-up of the target nucleus a, whereas the cluster s proceeding indisturbed behaves as a spectator to the two-body process. In order to completely determine the kinematical properties of the spectator s, the two ejectiles c and C have to be detected, identified and their energies and emission angles measured.
In the case of direct break-up, the two-body cross section can be derived from the measurement of three-body cross section and from the knowledge of the momentum distribution of x inside the Trojan-horse nucleus.
where |Φ("ps)| 2
is the momentum distribution of cluster s inside a and dσH OES
dΩ the
off-shell cross section of the reaction in equation 3. In the present work the experimental study of the 19
F(p,α)16
O reaction via the THM is described.
The experiment was performed in Legnaro at the Laboratori Nazionali di Legnaro (Padova) where the Tandem accelerator provided a 55 MeV 19
F beam impinged onto CD2 targets. The experimental setup consisted of a telescope devoted to
oxy-gen detection, made up of an ionization chamber and a silicon position sensitive detector on one side with respect to the beam direction and one additional silicon PSD on the opposite side of the beam axis optimized for coincident detection of the alfa particles. A symmetric setup allowed to double the statistic.
After detector calibration, the first step of the data analysis is to single out the events corresponding to the three-body reaction.
Since different reactions can take place in the target a careful selection of the reaction channel is necessary. The channel selection procedure begins with the separation of the oxygen locus in the ∆E-E two-dimensional plot by means of a graphical cut. As reaction n.3 has three nuclei in the exit channel, the reaction products are distributed around a characteristic kinematic locus, because their kinetic energies are correlated by energy and momentum conservation equations. From a comparison with a Monte Carlo simulation it is possible to single out the reaction channel of interest from all the other. Besides the experimental Q-value has been extracted for the selected events by imposing energy balance for the three-body reaction and compared with the theoretical one.
After the selection of the 16
O-α-n exit channel, the following step in data analysis is to establish whether in the selected experimental kinematic regions the contri-bution of the QF process to the overall16
O-α coincidence yield is evident and well separated from others.
Through this study it is shown that the QF mechanism can be selected without significant contribution from contaminant sequential decay processes and the anal-ysis in Plane Wave Impulse Approximation is sufficient to describe the process. So the extraction of the cross section from the selected data was carried out and
rate.
The structure of this work is reported hereafter:
• Chapter 1: stellar evolution and the problematic connected to the19F(p,α)16O reaction are presented. In particular the s process, the AGB phase, the mix-ing process and the fluorine nucleosynthesis are reviewed;
• Chapter 2: some quantities which are relevant for nuclear astrophysics, such as the reaction rate and the astrophysical factor are defined;
• Chapter 3: the indirect techniques are discussed. Greatest attention is ad-dressed to the TH method;
• Chapter 4: the indirect study of the19F(p,α)16O reaction through the THM, the choise of the three-body reaction, of the beam energy and the detection angles are described;
• Chapter 5: the data analysis procedure, the channel selection, the study of reaction mechanism and finally the extraction of the cross-section are reported.
Astrophysics Motivation
1.1
The solar abundances
Nuclear astrophysics is the study of the nuclear processes which drive the birth, evolution and death of stars and of how all naturally occurring elements formed and evolved into our present universe. In fact, it is one of the primary goals of physicists today to explain the origin and abundance of all the elements and their isotopes in the universe.
The basics of the nucleosynthesis occurring in stars were set in 1957 by the work of Burbidge, Burbidge, Fowler and Hoyle [31]. Their paper provided a classification of nucleosynthesis processes into eight types where each process is associated with its product nuclei and the typical temperature and site where it occurs showing how stars can produce elements and their isotopes from helium to uranium. Our current cosmological belief is that the nuclei make up the majority of matter were first made from nucleons created a short time after the beginning of the Universe, in the Big-Bang. Nuclei were later forged in the interiors of stars of different types and initial masses and stellar explosions.
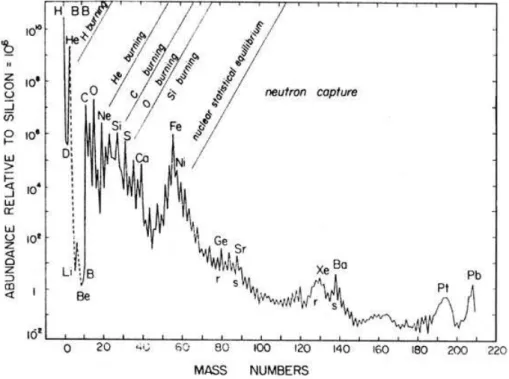
The solar system abundances of nuclides are shown in Fig.1.1, which displays the abundances of elements plotted against atomic number. This distribution displays several important features helped in the identification and early description of the nuclear process that could be responsible for their production. The graph has a decreasing trend from left to right, that is from light to heavy elements. Almost
Figure 1.1: The relative abundances of all elements measured in the solar system, as a function of mass number A normalized to 106
Si atoms and the y-axis is a logarithmic scale.
all the mass is contained in H(71%) and He(27%).
All of this hydrogen and the majority of helium were formed in the early uni-verse by big bang nucleosynthesis (BBN) and are the basic building blocks for the synthesis of heavier and more complex nuclei [32]. Because of the decreasing temperature and density of the Big Bang and the lack of nuclei at atomic masses 5 and 8, only a scant few heavier elements (hydrogen, helium and traces of lithium) could be created during BBN.
Some elements have anomalous abundances, showing a deep abundance minimum or maximum respect to the general trend. For instance, there is an abundance minimum in the A=5-11 region, corresponding to the elements Li, Be and B. These nuclides are easily destroyed in fusion reactions with protons. Therefore, their observed solar system abundances must be explained by processes that occur in sites other than stellar interiors. They are thought to be produced via spallation reactions induced by Galactic cosmic rays [33].
All of the heavier nuclides with A≥12 are produced in stars. The nuclides in the region between 12
C and 40
Ca are synthesized via charged-particle nuclear reac-tions in various stellar burning processes. Reacreac-tions between charged particles are subject to the Coulomb repulsion. The larger the charge of the reacting nuclei,
the smaller the nuclear reaction probability will become. This circumstance is reflected in the overall decline of the abundance curve from 12C
to 40Ca
.
The theories of nucleosynthesis are interwined with the theories of nuclear struc-ture as it was soon recognised that the feastruc-tures observed in the solar system dis-tribution of abundances are related to the nuclear properties of each element. For example appearing abundances peak at mass numbers for closed proton and neu-tron shells. The magic numbers 1 for nuclear stability are 2, 8, 20, 28, 50, 82 and
126; and nuclides with Z or N equal to these magic numbers are the ones that show large abundances in the diagram (because are more stable than those with slightly higher neutron numbers and have low neutron-capture cross-sections). This is particularly notable for the light doubly-magic nuclei with equal magic Z and N, for example 4H e
(Z=N=2),16O
(Z=N=8) and 40Ca
(Z=N=20).
Figure 1.2: Binding energy per nucleon as a function of mass number A [1]. Comparison with the peaks in Fig. 1.1 shows the strong correlation between
elemental abundance and nuclear binding energy.
Another significant feature is the abundance maximum of the iron peak that is re-lated to the fact that these nuclides represent energetically the most stable species (see Fig. 1.2). Because of the large Coulomb repulsion, the synthesis of nuclides
1Same elements with a configuration of a particular number of neutrons or protons are
beyond the iron peak via charged-particle reactions becomes very unlikely. These nuclei are instead produced by neutron capture processes.
Burbidge et al.[31] and Cameron [34] showed that only two sets of physical condi-tions were necessary to explain the abundances of the heavy elements in the solar system: The s process is present when there is a low neutron densities, of the order of 107
-108
cm−3; while the r process is due to a strong flux of neutrons, when the
neutron densities are higher than ≃ 1020
cm−3, and it is believed to occur during
explosives phases of stellar evolution (Novae, SuperNovae and X-rays binaries). In the s (slow) process the neutron-capture rate is much lower than the β−-decay
rates, while in the r (rapid) process the neutron-capture rate is much faster than the β−-decay so that neutron capture dominates.
About half of all elements heavier than iron are produced in a stellar environ-ment through thes processes. Many improveenviron-ments were soon presented, thanks to increased precision in the measurements of isotope abundances from meteorites and of neutron capture cross sections. Various reviews dealing with thes process, and with connected stellar and nuclear issues have been published over the years, especially for a late evolutionary phase called Asymptotic Giant Branch (AGB) stars where neutron-rich elements are produc inside stars with masses below about three times the Solar mass, and then carried to the surface by a series of mixing phenomena [6].
1.2
Evolution prior and through the AGB phase
AGB stars represent a late phase of evolution of stars with an initial mass between about 0.8 and 8 M⊙
2
[36]. In particular, low-mass stars shall be defined as those stars less massive than ≈ 2.25M⊙ while those of between 2.25 and 8 M⊙ will be
refered to as intermediate-mass stars [3].
1.2.1
Evolution prior the AGB phase
Depending on its initial mass, every star goes through specific evolutionary stages dictated by its internal structure and how it produces energy. Each of these stages corresponds to a change in the surface temperature and luminosity of the star, which can be seen to move to different regions on the Hertzsprung-Russell diagram3
as it evolves.
When a star is born, it is situated on the so called Zero Age Main Sequence (or ZAMS). Therefore, the ZAMS curve represents the position of the stars in the HR diagram at the onset of hydrogen burning in their core [2] (see Fig. 1.3).
There are two process by wich this may happen: the proton-proton chain and the CNO-cycle. The first one shown in figure 1.4 and starts with the fusion of two protons to deuterium (2
H) which can, once sufficient deuterium accumulates, cap-ture another proton to build up 3
He. Finally, two 3
He can react to 4
He, releasing two protons in the process. This set of reactions constitutes the first branch of the pp chain (ppI). There are another two set of reactions constitutes the second branch (ppII) and the third branch (ppIII) summarized in figure 1.4. These two branches contribute just a small percentage of the energy production in a star. For example, in about 70% of the energy is produced from the ppI chain, 30% from the ppII and only a fraction of a percent comes from the ppIII chain.
2
The upper limit comes from the fact that more massive stars ignite carbon in non degenerate condition. These stars through a series of nuclear burnings proceed either to the construction of an iron core and subsequent photodissociation instability with core collapse and end their life in a Supernova explosion. The lower limit reflect the fact that stars below this mass not have time to evolve [35].
3
The H-R Diagram is a graph that astronomrs use to classify stars according to their lumi-nosity and temperature.
Figure 1.3: An H-R diagram showing the evolutionary track of a Sun-like star.
Figure 1.4: Figure shows the pp chains [2]. Each of the pp chains fuses four protons to onehelium nucleus.
For all of the pp chains, the first step is the creation of the deuterium and this the slowest reaction because it proceeds via the weak interaction the cross-section is smaller than for all of the reactions in the chains. This reaction therefore governs the length of time for which a star will undergo hydrogen fusion, its main sequence lifetime [37].
Owing to the different energies carried away by the neutrinos, for each4
He nucleus produced by the ppI chain 26.5 MeV of energy is liberated, while the ppII and ppIII chains produces respectively 25.97 MeV and 19.59 MeV [38].
If a star consists exclusively of hydrogen and helium, then significant energy can only be generated during the hydrogen burning stage via the operation of the pp chains. Most stars, however, consist of gas that contains heavier nuclides, particularly those in the C, N, and O mass region. Hence, these nuclei can act as catalysts as the fusion of hydrogen [39]. The resulting different set of reactions through which hydrogen can be converted to helium are referred to as the CNO cycles [40].
Figure 1.5 compares the total energy generate for the pp chain and CNO cycles as a function of temperature and shows that the pp chain dominates for lower temperatures, while the CNO cycle dominate energy production for higher tem-peratures.
The pp chain is the principal energy source in the stars with M≤M⊙ [1]. Above
temperatures of 2x10⁷
K, and in the presence of heavier elements, a different set of reactions dominates energy production from hydrogen.
The temperature dependency of energy production (ǫ(T)) for the pp chain is ǫ ≈ T4
, while for the CNO cycle is ǫ ≈T18
. The consequence is that for a given metal-licity4 the first one is the dominant source of energy at lower core temperatures
while at higher temperature the CNO cycles dominates the energy production. The temperature in the stellar interior depends on the stellar mass. Therefore, in all hydrogen burning stars with insignificant CNO seed abundances the pp chain dominate the energy production [39]. In stars with significant CNO seed abundances, the pp chain is the main source of energy in the low-mass stars ,
4The fraction of mass composed by elements heavier than He in a star is commonly indicated
Figure 1.5: Energy production as a function of central temperature for the p-p chain and the CNO cycle. The dot denotes conditions in the solar core: the Sun is powered dominantly by the pp chain. The contribution by the CNO cycle is
at roughly 10% of the total energy production.
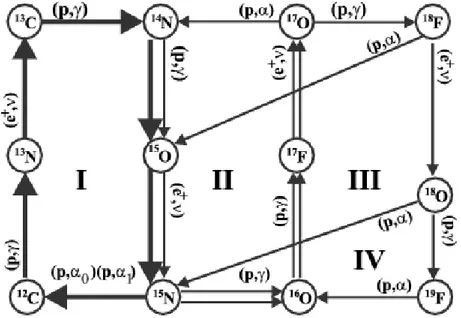
while in stars more massive than Sun, the energy production from the CNO cycle overtakes the pp chains and becomes the dominant mode of energy production [1]. The CNO cycle is shown diagrammatically in fig. 1.6. Like the pp chain, this cycle converts four protons into a helium nucleus and only the hydrogen nuclei are consumed in the cycle. For example, if the cycle starts at 12
C leads through a series of proton capture and β-decay processes via 13
N, 13 C, 14 N, 15 O and 15 N back to 12 C. The 15
N+p reaction shows a branching via 16
O into an additional cycle, which is roughly 103
times less probable [38]. The situation is best illustrated in fig. 1.6 in which are shown all of the cycles.
The various CNO cycles exist because at each of the branch point nuclei 15
N,17
O,
18
O, the (p,α) reaction will compete with the (p,γ) reaction. In fact, while the proton-induced reactions on the nuclei 12
C,13
C, 14
N and 16
O can proceed via the (p,γ) reaction, for the proton-induced reactions on these nuclei both the (p,γ) and (p,α) channels are energetically allowed [39].
The main sequence eventually terminates when all the hydrogen in the core has been processed into helium.
Figure 1.6: The four CNO cycles. Each reaction cycle fuses four protons to one 4
He nucleus.
The star leaves the main sequence and nuclear burning reactions advances in a shell surrounding the contracting 4
He core [3].
When the mass of the He core is about 10% of the total stellar mass, the central core becomes electron degenerate and the outer layers of the star respond to the increasing temperature in the core5
by expanding and cooling down; they become convective 6
and the star makes the transition to what is know as the Red Giant Branch (RGB), far to the right of the H-R diagram (see fig. 1.3) [41].
As the star ascends the RGB the convective envelope deepens, reaching into layers that have been partially processed by hydrogen burning. Some of these nuclei, as 4
He, 13
C, 14
N, are then moved up to the stellar surface altering the surface composition. The surface becomes enhanced in 4
He and14
N while the abundance of carbon drops [42]. The process is called the first dredge-up (1DUP).
When the core temperature reaches about T ≈ 0.1 GK, helium starts burning in the core. This provides the star with a new source of energy and re-establishes a new hydrostatic equilibrium [39].
5
the gas pressure in a degenerate gas is independent of temperature. Therefore, when the core contracts, the temperature increases
6
However, depending on the star’s total mass, the ignition of helium can take place either violenty during a helium-core-flash 7
in low mass stars due to their degenerated cores after the main sequence, or quietly in intermediate mass stars, who reach the necessary temperatures before the core degenerates [43].
Helium in the core can burn via the following chain of reactions:
4 H e +4H e ↔8Be + γ (1.1) 8 Be +4H e →12 C∗+ γ (1.2) 12 C∗ →12C + γ (1.3)
In the first step, two α particles interact to form 8
Be in its ground state. This nucleus is unstable by an energy of only 92 keV and disintegrates back into two α particles with a half-life of T1/2=6.7x10−17 s [39]. However this half-life is large
enough to allow for a second capture of a α particle. It is facilitated by the fact that the combined energy of a Be and a He match almost exactly an excited state of the carbon nucleus corresponding to an excitation energy of 7.68 MeV [31, 44]. There are a number of other reactions which contribute during helium burning. In fact, as the carbon abundance increases, helium may also burn via the reaction:
12 C +4H e →16O + γ (1.4) or 16 O +4H e →20 N e + γ (1.5)
Therefore, the result of core helium burning is a CO-core with traces of neon. The next phase of the evolution is very similar to the evolution we have already discussed following exhaustion of the hydrogen burning core. The contraction of the core leads to a strong expansion of the star’s outer layers, causing its surface
7
Unlike an ideal classical gas, whose pressure is proportional to its temperature,the gas pres-sure in a degenerate gas is indipendent of temperature. Matter becomes degenerate at relatively high densities as a result of the Pauli exclusion principle which states that no more than two spin-1/2 particles (such as electrons) can occupy a given quantum state simultaneously. A degen-erate gas strongly resists further compression because electrons cannot move into lower energy levels that are already occupied [39]. Ignition in a degenerate core results in a explosive start of fusion knows as the "Helium Flash".
temperature to drop and moving the star to the right and upwards in the H-R diagram (see fig. 1.3) along the Asymptotic Giant Branch. The AGB is so named because the evolutionary track approaches the line of the RGB asimptotically from the left, and indeed it can be thought of as the shell He-burning analogue of the shell H-burning RGB.
1.2.2
Evolution through the AGB phase
After helium is depleted in the core, in stars with masses M < 8M⊙ there is
insufficient gravitational energy to generate the high temperatures required to fuse C and O into heavier nuclei. Thus, carbon does not ignite, and the C/O core contracts and becomes increasingly electron-degenerate [36]. However, the core contraction generates sufficient heat for the surrounding layer of He to start fusing in a shell and the stars enter their AGB-phase. A this point, as illustrated in Figure 1.7, the star consist of:
• a degenerate C/O core;
• a He-burning shell, located just above the core; • an inert He intershell around it;
• a H-burning shell;
• an outer H-rich convective envelope.
During the first part of the AGB phase, called the early AGB, in stars more massive than 3-5M⊙, the large energy flux produced by the He-burning shell causes
the base of the H-rich envelope to expand and cool, so that H-burning in the shell is immediately switched off [43]. When this occurs, the outer convection zone penetrates inwards, into the intershell region. This process is known as the second dredge up. For lower mass stars, H-burning in the shell remains efficient, and prevents such a mixing. The mixing that results during this second dredge-up phase increases the He and N content of the envelope; in fact hydrogen has been completely converted into helium and both12
C and16
O have been converted almost completely into 14
Figure 1.7: Illustration of the structure of an AGB star [3].
Finally, when the He burning shell gets closer to the H/He discontinuity, it dies down and, after a rapid contraction, the H burning shell fully supplies the surface energy loss. The temporary stop of the He-burning shell marks the beginning of the Thermally Pulsing AGB phase (TP-AGB) [45].
1.2.3
The Thermally Pulsing phase
The four distinct phases present in the thermal pulse are shown schematically in fig.1.8. are:
• the on phase;
• the power down phase; • the dredge-up phase; • the off phase;
The first thermal pulse occurs when the H burning shell accumulates enough He below it (10−3
M⊙at a core mass of 0.8M⊙), so that the He-rich zone is compressed
and heated, and He reignites and a thermonuclear runaway (also known as thermal pulse, TP) occurs [43]. Due to the fast energy release, the local temperature increases and the He burning luminosity blows up, in extreme cases to 109
L⊙.
Figure 1.8: One thermal pulse [4,5].
(pulse driven convective zone, PDCZ) that extends from the 4He-shell almost to
the H-shell (see fig.1.9).
Figure 1.9: Convective episode in the model of M=2 M⊙ [6].
This convective zone is comprises mostly of4He (about 75%) and12C (about 22%),
and lasts for about 200 years [7]. The time of maximum energy output is known as the "peak" of the pulse and the decline in output thereafter is the power-down phase. In this phase, the helium luminosity decrease and intershell convection lessens. The previously released energy drives a substantial expansion, pushing the hydrogen burning shell to cooling so much that it is extinguished. In these
conditions, a third dredge up (TDU) episode is strongly favoured. After a small number of pulses, the convective envelope penetrates the into regions where the intershell convection zone had been active. This mean that the nuclei (mainly carbon) that produced during helium burning and mixed outward by the flah-driven convection, pulled into the envelope is an extremely important process as it allows material processed by nuclear reactions in the depths of a star to reach the surface where they can be observed and also returned to the interstellar medium via mass loss and planetary nebulae[37]. Especially increases the C/O ratio. This is because the third dredge-up process dredges up carbon from the interior of the star to its surface. At the end of TDU, He burning may increase again in the He shell and the star continues through a quiescent He-burning phase, which lasts until the reservoir of He produced prior the flash is used up again. At this point, He-burning dies down again and the star embarks on another long phase of quiescent H-burning. When the mass of the He-rich layers reaches the critical value previously specified, another thermal pulse is initiated and this cycle is repeated many times [43].
Spectroscopical observations show that the surface of these stars is strongly en-riched in s process elements [46], which are produced through slow neutron cap-tures.
1.3
The Neutron Capture Process
As discussed earlier, while the elements lighter than mass number A ∼ 60 are made by charged particle fusion reactions, another physical process is therefore needed to explain the existence of the nuclides beyond the iron peak. Neutron captures are the most likely way to produce these elements because capture of charged particles, such as protons or α particles, are inhibited by the large Coulomb barrier and moreover the production of any heavier nucleus by direct fusion is an endothermic process.
The capture of a neutron by an isotope of atomic number Z and mass number A defined by the following equation:
(A, Z) + n → (A + 1, Z) + γ (1.6) The isotope (A+1, Z) could be stable or unstable. In the first case the neutron capture process continues accordingly with the capture cross section of the isotope involved and the isotope (A+2 ,Z) will be synthesized. In the other case, the neutron capture time scale τnof the isotope (A+1, Z) has to be compared with its
β-decay time scale τβ, where the β-decay is define by the following equations [47]:
➣ β−-decay (A + 1, Z) → (A + 1, Z + 1) + e−+ ν e (1.7) ➣ −β+-decay (A + 1, Z) → (A + 1, Z − 1) + e+ + νe (1.8)
There are three possible situations:
• τn ≫ τβ The neutron capture to the isotope (A+2, Z) is favoured with
respect the β−-decay to the isotope (A+2, Z+1)
This case is defined as r process and it is characterised by high neutron density (1020
cm−3), which requires very high temperatures and extreme
conditions. During r-process, isotopes extremely enriched of neutrons are formed until the β−-decay is favoured with respect the neutron capture. In
this way the τβ involved can reach values close to 10−6 sec. When the
neu-tron density decreases unstable nuclei reach a stable configuration through consecutive decays.
• τn ≪τβ The β−-decay is favoured with respect the neutron capture. If the
isotope (A+2, Z+1) is stable or its τnis longer or comparable with its τβ the
nucleosynthesis by neutron capture can go ahead to heavier nuclei. This case is defined as s process, where the typical neutron density is 106
-109
cm−3 [31]. The s-process path goes along the valley of β stability and its
termination point is 209
Bi (Z=83).
• τn∼τβ The neutron capture is comparable with the β−-decay. In this case
the isotope (A+1, Z) is an open branching between the two processes during the neutron exposure.
Figure 1.10: Neutron capture paths of the s process and r process shown on the chart of the nuclides between iron and the actinides.
Fig. 1.10shows that the neutron capture path of the s process follows the valley of stability. The r process path is shifted to the far neutron-rich region, from where the reaction products decay back to stability.
1.3.1
The s process in stellar evolution
The key ingredient in activating the s process reactions is the neutron source. At the time of B2
FH, many of the reaction rates necessary to predict which reac-tions were key for neutron production were poorly known. For this reason several candidate reactions were proposed. Chief among these were the 13
C(α, n)16
O and
21
Ne(α, n)24
Mg reactions which can be produced by the 12
C(p, γ)13 N(β+ν)13 C and 20 Ne(p, γ)21 Na(β+ν)21
Ne reaction chains, respectively, during Helium burn-ing [48]. Soon after B2
FH, it was suggested by Cameron [34] that because most of the CNO nuclei are converted into 14
N (slowest reaction rate), the reaction chain
14 N(α, γ)18 F(β+ ν)18 O(α, γ)22 Ne(α, n)25
Mg was a viable candidate as an s process neutron source.
Furthermore, in a stellar interior, the problem of predicting the main source of neutrons for s process nucleosynthesis is more complex than simply which neutron emitting reaction has the highest rate. In fact, the several reactions purposed by B2
FH are dependent on proton captures. If s process nucleosynthesis is to occur in Helium burning, this requires that some mixing occur between the hydrogen shell and the helium core [48]. But, the question how the process of the extra mixing of proton really works is not well understood.
The exception is the reaction chain 14
N(α, γ)18 F(β+ν )18 O(α, γ)22 Ne(α, n)25 Mg where only α-capture reactions are involved. From this point of view, the 22
Ne(α, n)25
Mg is a more natural candidate since the 14
N and 4
He are already present in the burning environment.
Our current understanding of s process nucleosynthesis suggests at least two nuclei represent the best candidates for the source of neutrons: 13
C and 22
Ne, which produce neutrons, respectively, via the 13
C(α,n)16
O and via the 22
Ne(α,n)25
Mg reactions [49, 50].
Depending on the dominant neutron source, a different s element pattern is ex-pected. This is due to the fact that the 13
C(α,n)16
O reaction is activated at tem-peratures around 0.9 x 10⁸
K, while the22
Ne neutron source can only be efficient in intermediate mass AGB stars where the temperatures are higher [43].
Clayton et al. [51, 52] showed that to reproduce the solar system abundance of s only nuclei we a mix of three components:
1. Weak Component: is required in order to explain most of the s isotopes with A<90, from Fe to Sr;
2. Strong Component: may be necessary to explain the abundances of the A=204 - 209 nuclei;
3. Main Component: produces most of the nuclei in the mass range 90 <A<204, from Sr to Pb.
The weak component likely comes from central He burning in massive stars (M>15M⊙),
where the neutron source is the 22
Ne(α,n)25
Mg reaction. This source produces a high neutron density of about 1010
−10
12
n/cm3
and needs a temperature larger than 3− 3.2 x 10⁸
K to be activated.
The strong component is associated with metal-poor AGB stars [53], and the main component is originate from thermally pulsing, low mass AGB stars (section 1.8, [54]). This second component is activated at relatively low temperatures (T = 0.8 -1.0 x 10⁸
K) and can therefore easily explain why the abundances of s elements are highly enhanced in low mass AGB stars, where the temperature is low. Low mass AGB stars experience an ingestion of protons into the helium-rich layer during the core He-flash, resulting in the production of 13
C. In this way, the13
C(α,n)16
O reaction would then be the source of neutrons for the s process, as discussed in section 1.4.
1.4
Nucleosynthesis and mixing processes in AGB
stars
The TP-AGB phase of evolution is crucial because during the thermal pulses, the temperature is high enough, on the order of 108
K, for a very rich nucleosynthesis to begin [46]. In this phase, main neutron sources are the 13
C(α,n)16
O reaction, active during the interpulse period, and the 22
Ne(α,n)25
Mg reaction, marginally activated within the convective shell originated by the TP [55]. In fact, this source needs a temperature larger than 3 - 3.2 x 10⁸
K to be activated, while the maximum temperature achieved in low mass stars at the bottom of TPs does not exceed T = 3 x 10⁸
K, hence the22
Ne source is only marginally at play [54].
In the He-intershell, He is partially converted into carbon, thus, in order to obtain a sufficient amount of 13
C, a diffusion of protons from the H-rich envelope into the C-rich radiative zone is needed.
Neutron production and concordant s processing occur in two steps [56] and is shown schematically in fig. 1.11.
Figure 1.11: Schematic showing two consecutive pulses. The s processed material is later dredged to the surface of the star [7].
Proton which are deposited by the semiconvection during the TDU episode are in region about 75% 4
He and 22% 12
C, so these proton are captured from the abundant 12
C via the 12
C(p,γ)13
N(β−)13C nuclear chain, leading to the formation
of a layer enriched in 13
C, called the 13
C-pocket [57]. When the star contracts again, the H shell reignites and the temperature in the 13
108
K where the timescale for α-capture decreases below the time between pulses and the 13
C(α, n)16
O reaction results efficiently activated. The 13
C produced according to this scenario is fully burned via the 13
C(α, n)16
O reaction during the time between two consecutive thermal pulses, thus producing a low neutron density of the order of 107
cm3
which are captured by the seed nuclei (belonging to the iron peak) to produce the s process isotopes.
Together with the H-burning ashes the s elements produced by this mechanism are then engulfed by the He-flash convection zone and can reach the surface by the next dredge-up event [58].
In addition to the production of s process elements, TP-AGB stars may also a rich site for the nucleosynthesis of light elements.
Goriely et al. [59] proposed that AGB stars could be a site for the synthesis of
19
F, an element whose origins have long puzzled astronomers.
During the interpulse period, only in the intermediate-mass AGB stars when the temperature at the base of the convective envelope reaches 20 x 106
K, the convec-tive envelope penetrate the H-burning shell, thereby activating the so-called hot bottom burning (HBB process).
As a result, these stars depending on their initial metallicity, undergo a nucle-osynthesis which involves a series of proton capture reactions at the base of the H-burning shell. Under these conditions the CN cycle is activated, carbon is con-verted into nitrogen by proton captures and the C/O ratio remains below unity (that is why HBB is responsible for preventing the production of carbon stars). The nucleosynthesis signatures of HBB includes enhancement in helium and nitro-gen abundances; depletion of 18
O; a low 12
C/13
C ratio; a low C/O ratio; efficient destruction of 19
F via the 19
F(p,α) and 19
F(p,γ) reactions; and enhancement of the abundances of 23
Na,25
Mg,26
Mg and 26
1.5
Fluorine nucleosynthesis
Three different astrophysical sites for fluorine nucleosynthesis have been proposed. The first was proposed by Woosley and Haxton in 1988 [60]. In the scenario they suggest, core-collapse supernovae might produce fluorine through the neutrino dis-sociation of 20
Ne and eject it prior to its destruction into the interstellar medium (see section 1.5.1). In fact, although the cross sections of neutrino-nucleus reac-tions are small, a large flux of nutrinos is released when the core of a massive star collapses to form a neutron star. For this reason, the ν-process can have a significant effect on the nucleosynthesis of core-collapse supernovae.
A different scenario was proposed by Meynet and Arnould in 2000 [61]. They concluded that 19
F could be produced in particular massive stars, so called Wolf-Rayet stars via helium-burning and then eject into the interstellar medium extreme solar winds (see section 1.5.2).
The first observational evidence in 1992 by Jorissen and Arnould [8] indicate that fluorine can be produced in the He-rich intershell region of AGB stars (see section
1.5.3). In their paper measurement of HF-features 8
in the spectra of AGB stars was published.
They found that stars with hight C/O ratios showed also higher fluorine abun-dances, suggesting a strong correlation between this element and these stars and that this must in some way be connected with the carbon enrichment on the stellar surface.
It is still unknown which of the three above sources is the main contributor for fluorine. The above scenario is based on several observational studies that, dur-ing the last decade, have been addressed the problem of the fluorine origin and evolution [63].
1.5.1
The ν-process scenario
Woosley and Haxton postulated that fluorine may be produced in this scenario by a two-step process. First neutrinos interact with the abundant 20
Ne found in
8
The HF molecule is efficiently formed in cool stellar atmospheres and a number of strong lines appear in the near-IR K band [62]. Lines of this molecule have been used by Jorissen et al. (1992) to measure F abundances outside the solar system for the first time.
the collapsing star via neutral current inelastic scattering. These inelastic collision exicite 20
Ne nuclei and then the exicited 20
Ne* emits a proton:
20
N e(ν, ν)20
N e∗
→19F + p (1.9) A tipical neutrino energy in this scenaio is 10 MeV and the cross section expected for inelastic neutrino collision is less than 10−18
barn [64]. However, a core-collapse supernova produces a large flux of neutrinos (can be estimated from the total energy of neutrinos produced in the collapse of about 1053
ergs, the radius of the Neon-rich shell of about 2x10⁹
cm and the neutrino temperature), approximately 1058
neutrinos. This large flux of neutrinos making this scenario a potentially important method of fluorine production.
The estimate of the amount of fluorine produced via neutrino nucleosynthesis is 0.42% of the original 20
Ne abundance (about one order of magnitude larger than the solar abundance). More recent simulations predicted significantly less fluorine production than previous studies [65].
Improving stellar model (including in the model the mass loss in the evolution of the progenitor, the nuclear reaction rates all of the heavy elements and using a more sophisticated statical model nuclear evaporation process-emission of a pro-ton, neutron, or α-that takes into account known nuclear levels and their spins and parities) was found a value much lower than earlier calculations had predicted. This translates into a fluorine production reduction of about 40% [65].
This lower theoretical predictions of fluorine abundance and the absence of obser-vation in supernova remnant [66] indicate that different sites of fluorine production should be considered.
1.5.2
The Walf-Rayet scenario
Wolf-Rayet stars represent an advanced phase of massive star evolution. These are a type of hot giant star, temperature above 30.000 K and masses of 10-25 M⊙,
extending up to 80 M⊙ and are characterize by powerful stellar winds [67]. Their
speeds are very fast (up to 6000 km/s) and remove large quantities of material causing the lose of their hydrogen envelopes. In this condition fusion reactions, which normally take place close to the stellar core and have direct impact on the
observed nuclear abundances, take place close to the stellar surface.
In WR-stars fluorine can be produced during early helium core burning via the chains [61]: 14 N(α, γ)18 F(β+ )18 O(p, α)15 N(α, γ)19 F (1.10)
where neutrons and protons comes from the reactions13
C(α,n)16
O and14
N(n,p)14
C respectively.
Fluorine that is produced by the star via helium-burning can be carried out by high stellar winds and in this way saved from destruction.
This scenario might be an important fluorine-source but there is no direct measure-ment of fluorine in the stellar winds. However, there are observations of planetary nebulae which indicate fluorine production in WR-stars [68].
1.5.3
The AGB scenario
Fluorine nucleosyntesis in AGB stars takes place in the intershell region.
Jorissen [8] and Forestini [69] investigated many possible formation scenarios and the one they judge as most promising is illustrated in fig. 1.12. Here,13
C produces neutrons via the13
C(α,n)16
O reaction discussed above, and some of these neutrons are captured by 14
N to produce 14
C and protons via the 14
N(n,p)14
C reaction. The 14
N nucleus needed is formed in the hydrogen burning shell, where hydrogen is burned via the CNO cycle which converts some of the dredged-up carbon into
14
N. This acts as a seed for the production of several species. The detail of this process depend primarily on the temperature of the intershell region, both during a pulse and during the interpulse phase, and also on the metallicity of the star [7, 70].
Starting with 14
N as a seed, the pathway for the production of 19
F is the same process as suggested for Wolf-Rayet stars:
14 N(α, γ)18 F(β+ )18 O(p, α)15 N(α, γ)19 F (1.11)
Figure 1.12: Schematic of the19F production mechanism.
A significant portion of 15
N results from the ashes of H-burning (CNO), but, this alone is not sufficient to explain the observed values. For the production of additional 15
N via the process 18
O(p,α)15
N, both the heavy oxygen isotope 18
O and a proton source are required. 18
O can be produced in the intershell region via the chain 14
N(α, γ)18
F(β+
)18
O and is not the limiting factor, since both 14
N and
4
He in the H-burning ashes.
This oxygen isotope comes from the ashes of the previous thermal pulse that have been partially incorporated into the current pulse. 18
O easily survives α-captures at the temperatures considered and remains abundant in the pulse [7, 69].
The proton source is a problem, however, since the intershell region is H-depleted and the two possible proton source reactions,14
N(n,p)14
C and26
Al(n,p)26
Mg, both require neutrons to be present.
Free neutrons are unstable and must be produced in the intershell region via the reaction 13
C(α,n)16
O, which is also the main neutron source for the s process element seen in these stars, but they are also available for14
N and26
Al to capture.
13
C, however, is not too abundant in the intershell and a mixing-down of protons during the thermal pulse, when the outer convective zone can penetrate into the intershell region, is necessary to form a 13
C-rich pocket. This convective zone is also required to move the synthesized fluorine out of the area, before it can be

![Figure 1.11: Schematic showing two consecutive pulses. The s processed material is later dredged to the surface of the star [ 7 ].](https://thumb-eu.123doks.com/thumbv2/123dokorg/4531496.35345/41.892.223.722.633.891/figure-schematic-showing-consecutive-processed-material-dredged-surface.webp)
![Figure 2.7: The reaction rates for the three main mechanisms responsible for destroying fluorine in AGB stars [ 13 ].](https://thumb-eu.123doks.com/thumbv2/123dokorg/4531496.35345/87.892.230.714.129.468/figure-reaction-rates-mechanisms-responsible-destroying-fluorine-stars.webp)

